International Research Journal of Engineering and Technology (IRJET) e-ISSN: 2395-0056

Volume: 09 Issue: 08 | Aug 2022 www.irjet.net p-ISSN: 2395-0072
International Research Journal of Engineering and Technology (IRJET) e-ISSN: 2395-0056
Volume: 09 Issue: 08 | Aug 2022 www.irjet.net p-ISSN: 2395-0072
1 , Liu Yue Tian2
1 Student, College of Petroleum Engineering, China University of Petroleum, Chang ping, Beijing 102249, China
2Professor, College of Petroleum Engineering, China University of Petroleum, Chang ping, Beijing 102249, China ***
Abstract - Enhancing the recovery of an oil reservoir is one of the major roles of any oil company. This is achieved by development of the oilfields by employing different techniques such as Water injection, gas injection, water alternate gas (WAG) injection and even thermal methods. In this work a simulation study was performed in KEYI oil field models to determine the optimal production strategy. Water injection, Gas injection and Water Alternate Gas injection Scenarios were compared for a Sudanese oil field. Results indicated that WAG injection technique better recoveries than water or gas injection.
Key Words: Water injection, Gas injection, WAG injection, Reservoir Simulation, KEYI oil field, Eclipse software
Hydrocarbon is produced from the subsurface through primary, secondary, and tertiary (Enhanced Oil Recovery, EOR) methods. The primary stage is the period in the oil recoveryprocesswhenoilflowsnaturallytothewellsdueto natural energy such as depletion drive, initial pressure gravity,andwaterdrive.Secondaryrecoveryarerecovery techniques used to augment the natural recovery of the reservoirby injectionfluid(gasorwater)inthereservoir theoiltoflowintothewellborethesurface[5].Waterand gasinjection arethe most commonmethodsof secondary recovery.Inthisprocess,waterisinjectedintothereservoir tomaintainthepressureandalsotosweeptheresidualoil. In order to select the most economical scenarios of water injection,atooltoforecastperformanceisessential[3]and gasinjectionistheactofinjectiongasintoanoilreservoir for the purpose of effectively sweeping the reservoir for residualoilaswellasmaintenanceofpressure.Substantial quantities of oil normally remain in the reservoir after primaryandsecondaryrecovery,whichcanbeeconomically recoveredthroughwateralternatinggasinjection[4].Water alternate gas (WAG) injection was originally intended to improvesweepefficiencyduringgasflooding.Intermittent slugsofwaterandgasaredesignedtofollowthesameroute throughthereservoir.Eithergasisinjectedasasupplement to water or water is injected as a supplement to gas, primarily to reach other parts of the reservoir [1]. WAG
injection is improving oil recovery by taking advantage of theincreasedmicroscopicdisplacementofgasinjectionwith the improved macroscopic sweep efficiency of water injection.Compositionalexchangesbetweentheoilandgas duringWAGprocesscanalsoleadtoadditionalrecovery[6]. Moreover, distinction should be drawn between miscible and immiscible WAG injection. Immiscible wag injection, water and gas can be injected simultaneously rather than intermittently [1]. Reservoir simulation provides a prediction of reservoir performance. There are several methods of simulation from simple to complex ones. The choice of each of these methods depends on the available dataandthelevelofdesirableaccuracy[2].
Themainscopeofthepresentworkistomakeasimulation studyintoKEYIoilfieldinordertooptimizeoilrecovery. Simulationstudyusedtodeterminethesuitablemethodfor increaseand enhancedrecovery.Inorder toa accomplish theaimofthisstudy,thesimulationmodelwasdeveloped using three – phase, 3D, and black oil option in Eclipse software
Athree–dimensionalreservoirmodelwasestablishedasa basemodelforthesimulationstudystudiedinSudaneseoil field.
ReservoirsimulationstudiesforKEYIoilfield,Mugladbasin, Sudan. The synthetic reservoir description is based on an actualproducingfield.Thegeologicalmodelisasyntheticoil zone sector of a Sudanese oil field. Reservoir pressure at datumdepthis1754.957Psia.Thedatumdepthofreservoir isabout4429.134ft.KEYIoilfieldisafaultnose;theinternal structureidsimplewithnoobviousfault.Reservoirishighly heterogeneous, characterized by medium porosity and medium–highpermeabilityaccordingtothestratigraphy and development of sand bodies, in Zaqa, Chazal layers, more than dozen individual sand bodies are classified
Fatima Musa EdrisInternational Research Journal of Engineering and Technology (IRJET) e-ISSN: 2395-0056
Volume: 09 Issue: 08 | Aug 2022 www.irjet.net p-ISSN: 2395-0072
delayed,buttherearesixmainoilbearingsandlayers.The averagehorizontalpermeabilityis966.75mdandaverage porosity is 0.22. The average vertical to horizontal permeabilityis0.1.Thebasemodelcontains gridblockofwhich[37044]blocksareactive.TheXandY dimension of each grid block are164 ft and the vertical direction: 13 – 210 ft. The model is dividedinto 12layers vertically, there are 6 main oil bearing sand layers respectively.GA4,GA5,GB1,ZD2,ANDZD3,differentlayers havedifferentoilwatercontacts
22wells(13wellsasproductionwellsand9wellsas injectionwells)arespecifiedintheareaunderstudy.The productionisinitially2000(STB/DAY)whengasoilratio (GOR)attheproductionwellreaches15(MSCF/STB)the productionwellwillbeshut.Thebottom-holepressure lowerlimitis1700Psia.Considersomeconstrainswhich isclassifiedbellow:
Wateroilratioshouldnotexceedthevalue20:1.Inother wordthefractionofwatermustlessthan0.99.
Producinggasoilratio(GOR)shouldbelessthan15 MSCF/STB.
WellBottomHolePressuremustbegreaterthan1500 Psia.
Theinjectionrateissettovalueof2000STB/DAY.
Pressureofinjectionwellsshouldnotexceedthe7000 Psia.
Wellboreradiusofbothinjectionandproductionwellsis 0.124ft.
Thereservoircontainsoil,water,gas,anddissolvedgas. Theinitialreservoirpressureis1800Psia.Therelative permeabilityandcapillarypressuredataandtheother PVTareshowninTable1.
KEYI oil field KEYI was proven productive in September 2010,productionstartedfrom6intervalsnamely,GA4,GA5, GB,ZD1,ZD2,andZD3.Alloftheselayersdistributedinthe formations named, the Ghazal Formation, and e Zarqa formation.Coreanalysisandwellloggingshowedthatthe reservoir rock is characterized by both medium to high porosity and medium to high permeability The average matrix permeability is on the order of 20 to 2300 md approximately,withaverageporositiesrangingfrom1to30 %.Basedongeologicalmodel,up-scalingwasdonebasedon sixzones(GA4,GA5,GB,ZD1,ZD2,andZD3)dividedto12 singlelayers. Basedonthatinformationthereservoir
PVT for Water W-Phase Pressure W-FVF Wcompressibility W-viscosity 188549 1.03 4.63 10-6 0.0.65
EquilibriumCondition DatumDepth(ft) PressureatDatum Depth(Psia) WOC(ft) GOC(ft) 4450 1800 4420 3280.84
PVTfortheDeadoil OilPhase Pressure(Psia) OilFVF(bbl/stb) Oil Viscosity(cp) 127.5 1.1045 17/8 201.0 1.1002 18 423.0 1.0945 19 715.5 1.0919 20.1 1000.5 1.0897 21.15 1515.0 1.0866 23.05 2162.0 1.9831 25.60 3015.0 1.0792 28.57 4015.0 1.0749 32.1 5015.0 1.0708 35.6
Water–OilSaturationTable Sw Kro Krw 0.30 1.00000.39 0.4508 0.0025 0.46 0.2275 0.0160 0.51 0.1312 0.0361 0.56 0.0724 0.0618 0/58 0.0475 0.0778 0.60 0.0383 0.0861 0.62 0.0278 0.0968 0.63 0.0214 0.1057 0.65 0.0141 0.1151 0.67 0.0094 0.1256
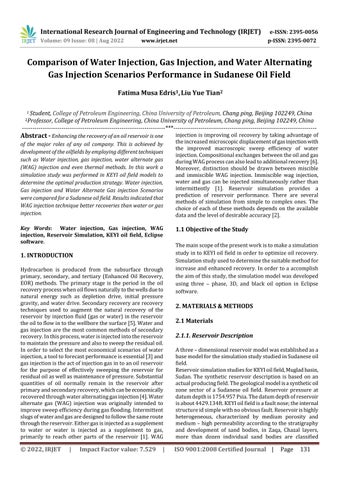
ModelfortheKEYIareaisdevelopedusingtwo-phase,3D and black oil options in Eclipse. The grid dimension is (49x63)with(3087)gridblocksinthehorizontaldirection and(12)gridblocksintheverticaldirection.Atotalnumber of(37044)gridblockswereusedtosimulatethearea.The twelvemainzonesweremodeledwithsixinterveningshale layers. It was assumed that there was no vertical communicatinginthematrixbetweenthetwelvedifferent sandzones,bysettingthetransmissibilityofmatrixinthe interveningshaleto bezero.Thisassumptionagreeswith recenthorizontalcoreanalysis.Figure(1)shows3DofKEYI oilfield.
Fig -1:3DofKEYIOilField
International Research Journal of Engineering and Technology (IRJET) e-ISSN: 2395-0056
Volume: 09 Issue: 08 | Aug 2022 www.irjet.net p-ISSN: 2395-0072
Our base run has Grids. This base run has beenusedforeachthreeEORprocess.First,Waterinjection and then Gas injection and finally Water Alternating Gas (WAG)processhasbeeninvestigated.Afterthattheeffectof different parameters (WAG cycle time and WAG injection rate) for the Water Alternating Gas injection have been analyzed.
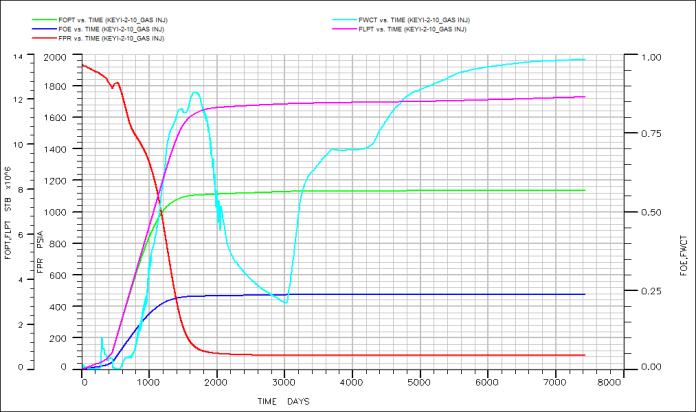
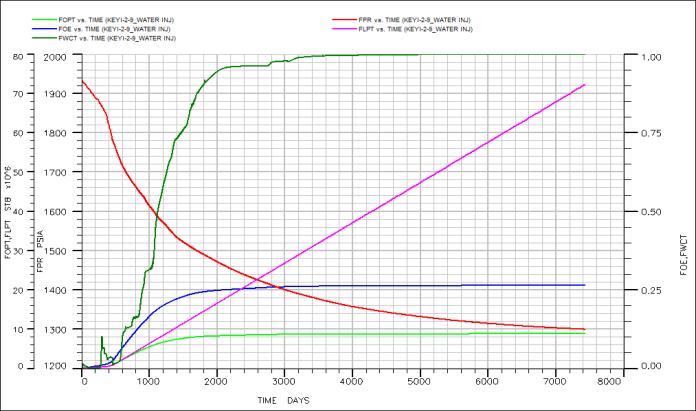
Water injection Method: First we start with water injection.WeuseBASERUNor grids.Weuse manytimestepsallowwatertoreachproducingwellsand fractionalflowofwaterreachthevalueof0.99.Wetesttwo casesofwaterinjectionandruntheDatafileforthewater injection with ECLIPSE software and obtained the results whichshownasgraphs.Figure(2)shows3-Dgraphsoffinal state of the KEYI oil field during water injection in cross sectionalviewaroundinjectionwell.
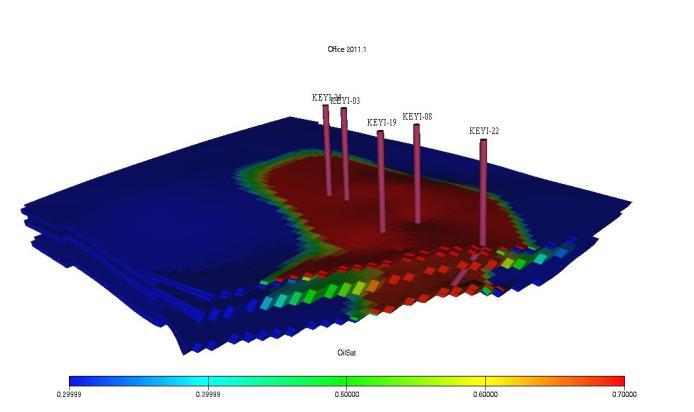
Gas Injection Method: Afterrunningthemodelforwater injection and seeing the result. We run the Base Run fortheGasInjectionProjectandseeingthe
result.WeinjectedtheGaswithRate2000MSCF/DAYand the pressure of injection well should not exceed the 7000 psia. Also the producing GOR should not exceed the 15 MSCF/STB.Figure(4)shows3-Dcrosssectionaroundthe injectionwellaftergasinjection.
BylookingattheresultgraphsforthefieldFigure(5)wecan see that the ultimate oil recovery for the gas injection is 23.78%whichresultsintheproductionof7.9 106STBof
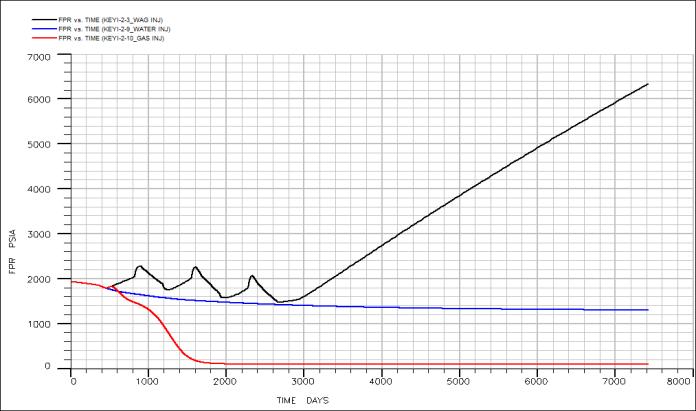
crude oil. As we know the Gas Injection is mostly used as pressuremaintenancemethodingascapratherthanEOR methods. If we compare the Water Injection with Gas Injection,wecanconcludethatUltimateRecoveryofWater Injection is higher than Gas Injection. Also the reservoir pressureofWaterInjectionattheendoftheprojectismuch higher than the final reservoir pressure of Gas Injection method.
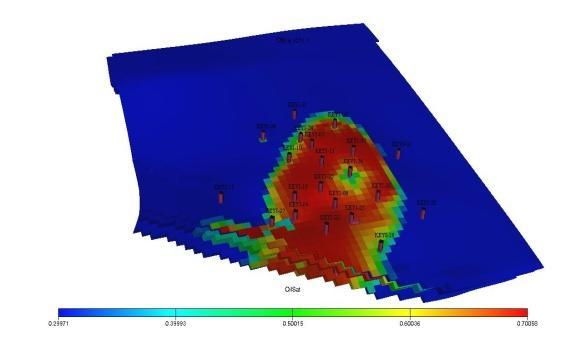
The results of the water injection project were shown by Figure(3). Bylookingattheoilrecoverycurve(FOE).We seethatthemaximumoilrecoverywithwaterinjection is 26.37 %, which is equivalent to the 8.8 106STB of the cumulativeoilproduction(FOPT).
Fig 4: FinalstateofthemodelafterGasInjection
Fig 3: FieldresultofbasecaseforWaterInjection
Fig 5: FieldresultofbasecaseforWaterInjection
Water Alternating Gas (WAG) Injection method:We usetheBaseRunforWaterAlternatingGas(WAG)injection
International Research Journal of Engineering and Technology (IRJET) e-ISSN: 2395-0056
Volume: 09 Issue: 08 | Aug 2022 www.irjet.net p-ISSN: 2395-0072
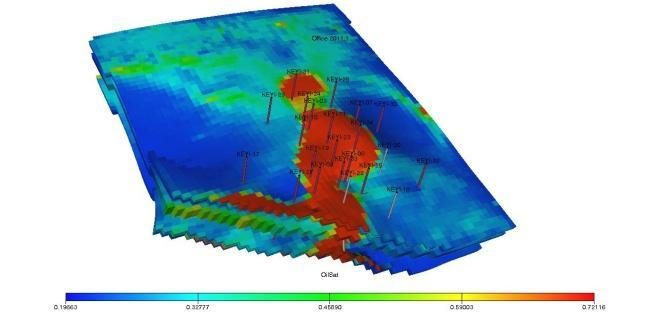
inKEYIoilfield.Theperiodforinjectionwells(Waterand Gasinjection)is7426days.Itmeansthatwaterinjectedfor oneyearandinthisperiodthegasinjectorwellsareshut, and during the injection of gas for one year, the water injectorwellsareshut.Figure(6)shows3-Dcrosssection aroundtheinjectionwellsafterWAGinjection. ByanalyzingtheresultofWAGtechnique,Figure(7)wecan find the ultimate recovery of this EOR method for typical 26.46 %. The total oil production of WAG method is 8.83
106STBofcrudeoil.
Fig 6: FinalstateofthemodelafterWAGInjection
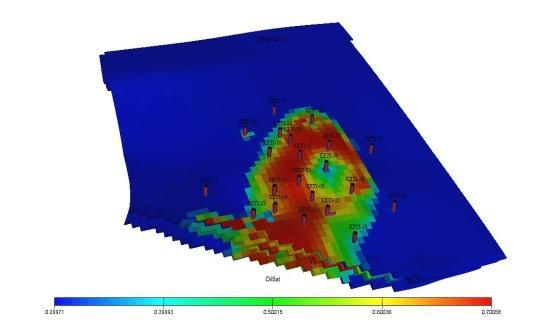
Table 3: FieldOilProductionTotal( 106STB)
EORmethod FieldOilProduction Total( 106STB)
WaterInjection(days) 8.8 GasInjection(days) 7.9 WaterAlternate Gas(WAG)(days) 8.83
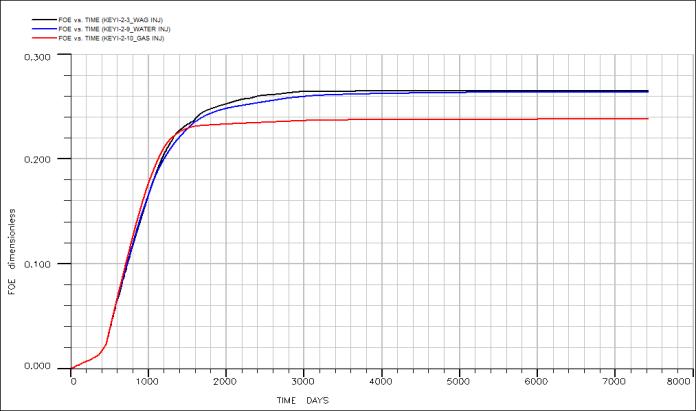
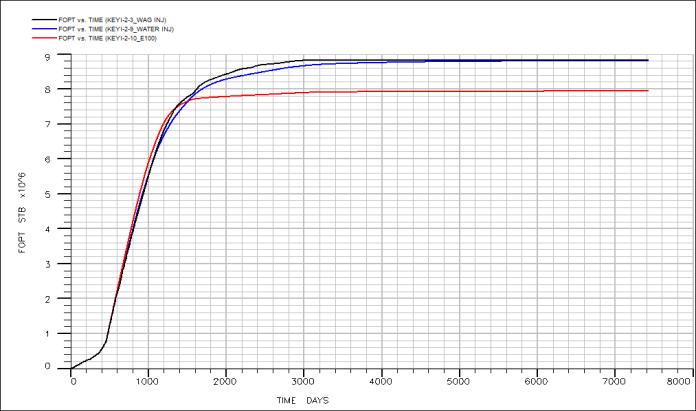
FromFigures(8to11)ithasbeenconcludedthatthewater injection is the best choice for our model, because water injectionhasthegreatestrecoveryfactor.Ifonewanttohave theoverallviewtothesethreeEORmethods,itcanbesaid thatthewateralternategasinjectionisthebest.
Followingresultsanalyzedifferentparameters(FOPT,FOE,
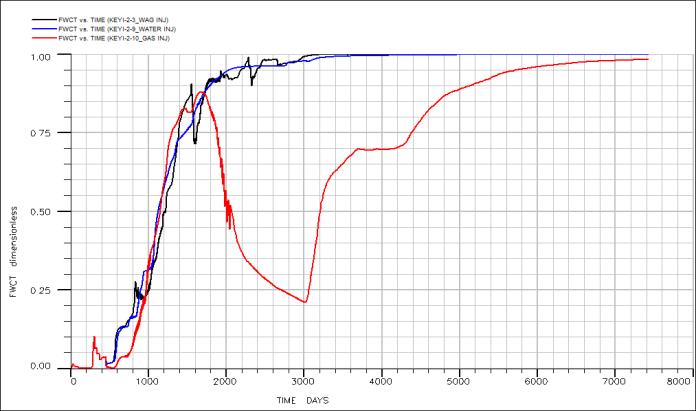
FPR, and FWCT) of the 3 methods (Water Injection, Gas Injection,andWaterAlternatingGasInjection).Bylookingat thewatercutcurveforthesethreemethods,Waterflooding hastheearlierbreakthroughofwaterduetowaterinjection. Andgasinjectionhasthelowestfractionalflowofwater
Fig 7: FieldresultofbasecaseforWAGInjection
3 RESULTS & DISCUSSION
The overall result for water injection, Gas Injection and Water Alternate Gas (WAG) in term of oil recovery efficiency(FOE),OilProductionTotal(FOPT).Havebeen comparedintables(2and3)inthefollowing:
Table 2: FieldOilEfficiency(RecoveryFactor)
EORmethod UltimateRecovery Factor(%)
WaterInjection(days) 2637
GasInjection(days) 2378 WaterAlternate Gas(WAG)(days) 2646
Fig 8: Comparethefieldresultof FOPT forWI,GI,and WAGinjectionmethods
Fig 9: Comparethefieldresultof FOE forWI,GI,andWAG injectionmethods
International Research Journal of Engineering and Technology (IRJET) e-ISSN: 2395-0056
Volume: 09 Issue: 08 | Aug 2022 www.irjet.net p-ISSN: 2395-0072
Fig 10: Comparethefieldresultof FPR forWI,GI,and WAGinjectionmethods
Firstofall,Iwouldliketoexpressmyspecialappreciation andgreatgratitudetomyadvisor Professor Liu YueTian for accepting me into his group, providing a wonderful combinationofadvicesupportandfriendship. Professor Liu Yue Tian isalwaysavailabletoanswermyquestions,orto help me in finding the right path to answers. When I felt depressed because of some unsuccessful struggling, Professor Liu Yue Tian kept her belief in my ability of solving problems and encouraged me to overcome the difficulties eventually. He has provided positive encouragementandawarmspirittofinishthisthesis.Ithas beengreatpleasureandhonortohavehimasmysupervisor.
I will forever be thankful and recognition are due to Professor Zhang Laibin, the president of China University of petroleum,whoencouragedmetocometoChinabygive me this chance to study PhD, and believed I had the conditionstoundertakeandtosucceedintheadventureof PhD.
Iwouldalsoliketothank China University of Petroleum, the foreign student office, Sudan University of scienceand technology, The College of Petroleum Engineering & Technology, and Sudanese Ministry of Higher Education fortheirfinancialsupport.
Fig 11: Comparethefieldresultof FWCT forWI,GI,and WAGinjectionmethods
Byanalyzingtheobtainedresultsintheprevioussection thefollowingremarksareconcluded:
1 ThebestmethodtochooseasEORforKEYIoil fieldisWAGInjection.
2 WAGInjectionhasthelargestTotalField Recovery.
3 WAGInjectionhasthehighestReservoirPressure attheendoftheproject.
4 ThemaindisadvantageoftheWaterFloodingis itshighfractionalflowofwater.
5 AlsotheWaterFloodingmethodhasthelowest valueofProducingGOR.
6 AfterWaterFlooding,themethodofWater AlternateGas(WAG)hasthelargestOilRecovery.
7 GasInjectionhasthelowestFieldOilRecovery.As wementionedbefore,GasInjectionisalmostuse asPressureMaintenanceMethodratherthanEOR method.
Mydeepestgratitudegoes tomy entirefamily member. It would not be possible to write this paper without the supportfromthem.
I would like to thank my husband Montasir Yosif Mohammed Salih for his love, patience and unwavering support.
AlsoIwillforeverbethankfultomylover Nahid and Noun forthemloveandhelp.
Lastly I wish to express my heartiest gratitude to my colleaguesforhelps.
EOR:EnhancedOilRecovery
WAG:WaterAlternatingGas
FOPT:FieldOilProductionTotal
FOE:FieldOilrecoveryEfficiency
FPR:Fieldaveragepressure
FWCT:FieldWaterCut
WI:WaterInjection
GI:GasInjection
International Research Journal of Engineering and Technology (IRJET) e-ISSN: 2395-0056
Volume: 09 Issue: 08 | Aug 2022 www.irjet.net p-ISSN: 2395-0072
[1] Caudle,B.H.andA.B. Dayes,1958. Improvingmiscible DisplacementbyGas-waterInjection,Trans,AIME,213: 281-84
[2] Ertekin, T., J.H. Abou-Kassem, and G.R. King, 2001. Basic applied reservoir simulation. Society of PetroleumEngineers,Richardson,Tex.
[3] Fanchi, J.R., 2001. Principles of Applied Reservoir Simulation, Second Edition. Gulf Professional Publishing,Burlington.
[4] Fatemi,M.S.,Sohrabi,M.,Jamiolahmady,M.,Ireland,S., &Robertson,G.(2011).Experimental Investigationof Near-Miscible Water-Alternating-Gas (WAG) Injection PerformanceinWater-wetandmixed-wetSystems.SPE OffshoreEuropeOilandGasConferenceandExhibition (pp.1-16).Aberdeen
[5] Speight,J.G.(2009).Enhancedrecoverymethodsfor heavyoilandtarsands.Houston:GulfPub.Co.
[6] Stenby,E.,Skauge,A.,&Christensen,J.(2001).Reviewof WAG Field Experience. SPE Reservoir Evaluation & Engineering,1-10