International Research Journal of Engineering and Technology (IRJET) e-ISSN: 2395-0056

Volume: 09 Issue: 08 | August 2022 www.irjet.net p-ISSN: 2395-0072
International Research Journal of Engineering and Technology (IRJET) e-ISSN: 2395-0056
Volume: 09 Issue: 08 | August 2022 www.irjet.net p-ISSN: 2395-0072
1PG Scholar, Department of Civil Engineering, DRGIT&R, Amravati, Maharashtra, India.
2 Professor, Department of Civil Engineering, P. R. Pote Patil College of Engineering and Management, Amravati, Maharashtra, India
3Assistance Professor, Department of Civil Engineering, DRGIT&R, Amravati, Maharashtra, India ***
Abstract - The knowledge of different macroscopic parameters of traffic volume is an important basic input required for planning, analysis and operation of roadway systems. Expressing traffic volume as number of vehicles passingagivensectionofroadortrafficlaneperunittimewill be inappropriate when several types of vehicles with widely varying static and dynamic characteristics are comprised in the traffic. The problem of measuring volume of such heterogeneous traffic has been addressed by converting the different types of vehicles into equivalent passenger cars and expressing the volume in terms of PCU (Passenger Car Unit) perhour,spotspeedstudyandsaturation flow.Thevehiclesof highlyheterogeneoustraffic with widely varyingphysicaland operational characteristics such as the one prevailing on Indian roads, occupy based on the availability of space, any convenient lateral position on the road without any lane discipline.Theinteractionbetweenmovingvehiclesundersuch heterogeneous traffic condition is highly complex. In this paper, the approach is practically applied to evaluate and improve the safety performance of some congested intersections in Amravati city in Maharashtra.
Key Words: Keywords:PassengerCarUnit(PCU).
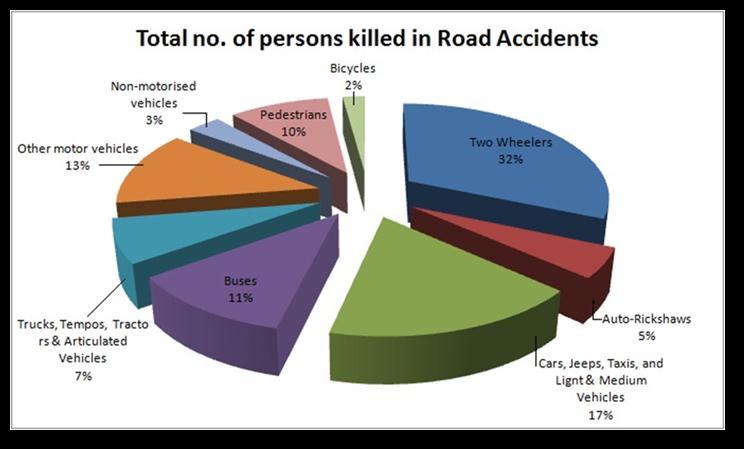
Most of the injuries and crashes has chance to occur at intersection.Withtherapidgrowthofthenumberofvarious vehicles,theratioofthetrafficaccidentstovehiclenumber isincreasinggreatly.Safetyonroadsisamajorconcernin the developing world because of its impact on the global economyandpeople’swelfare.Duetotherisingpopulation, thetrafficriskhasincreasedespeciallyindevelopingnations likeIndia,astheinfrastructureisunabletocopeupwiththe increasingtraffic.
Trafficvolumeisdefinedastheno.ofvehiclescrossinga particular cross section per unit time. It is measured in vehicleperminute,vehicleperhourandvehicleperday.In ordertoexpressthetrafficflowonaroadperunittime,itis necessarytoconverttheflowofthedifferentvehicleclasses intoastandardvehicleclassknownaspassengercarunit.
Theproblemofmeasuringvolumeofsuchheterogeneous traffichasbeenaddressedbyconvertingthedifferenttypes
ofvehiclesintoequivalentpassengercarsandexpressingthe volumeintermsofPassengerCarUnit(PCU)perhour.
Hourlypattern:Thewaytrafficflowcharacteristicvaries inMorningandEvening.Maximumhourlyvolumeoftraffic issaidtobepeakhourlyvolume.DailyPattern:Theday-today variation throughout the week 24 hours count at specifiedlocationissaidtobeaveragedailytrafficandthe 24hourstrafficvolumeatgivenlocationaveragedoffull365 daysissaidtobeaverageannualdailytraffic(AADT).
Significanteffortshavebeenimplementedinthelastfew decades, for reducing the rate of accidents particularly at intersections.Thisliteratureassessmenthastestedmanyof thoseproposedcountermeasuresdesignedtoeitherprevent accidentsorreducefatalaswellasminorinjuriesintheevent of crash at unsignalized intersection. Further, the need of enhancements to the effectiveness or methods of implementationofmodern-daycountermeasureshasbeen assessed. This chapter affords an evaluation of applicable literature to bring out the historical past of the observe undertakenonthisdissertation.Theresearchcontribution whichhasadirectrelevancearetreatedinagreaterdetail andmajorfindingssummarizedbriefly.Someofthehistorical workwhichhavecontributedgreatlytotheunderstandingof the safety concerns of the unsignalized intersections. The
International Research Journal of Engineering and Technology (IRJET) e-ISSN: 2395-0056
Volume: 09 Issue: 08 | August 2022 www.irjet.net p-ISSN: 2395-0072
amountoftheliteratureonthesubjecthasincreasedhastily inrecentyears,inparticulartoimprovesafetyofintersection, numerous of that is to be had in the court cases of the conferencesthatareveryusefultounderstandthecurrent developmentsinsitevisitorsengineering.
The aim of the protection techniques is to reduce annual highwayfatalities.Thisaimcanbedoneviathegood-sized utilityoflow-value,testedcountermeasuresthatlessenthe varietyofcrashesonthekingdom’shighways.Manyofthe hintsandresearchforimplementationofsafetyPlangives techniques that can be hired to reduce the variety of unsignalizedintersectioncollisions.Thedocumentmaybeof precise interest to protection practitioners with duty for enforcingapplicationstoreduceinjuriesandfatalitiesonthe highway system. Though research done on the various macroscopic parameters on the road is not highly documented,thecontributionsfromresearchersacrossthe nation and the world have proven to be significantly essential.Thispaperindicatesaverycomprehensivereview of literature for studies analyzing safety of congested intersection.
Thesetypesofintersectionsareparticularlydividedinto types:oneisdirectassessmentthat'sbasedonthestatistics oftrafficaccidents;theoppositeisindirectassessmentwhich isbasedonsitevisitorswarfaremethod.Directevaluation approach in particular includes crash frequency, crash valuation, crash severity, and crash statistic models. However,whilstthosetechniquescarriedout,theassessment endresult'saccuracyisaffectedbecauseoflonglengthand inaccuracy of statistical data. To accumulate intersection crashrecordsmightbeatroubletomanyresearchers,mainly
becauseofthedifficultytoattainthesedataandthereliability ofpastcrashrecords.
Theindirectassessmenttechniquebasedtotallyon-site visitors battle technique is a noticeably new traffic safety assessmenttechnique,thatisbroadlyspeakingimplemented toevaluateintersectionsitevisitors’safetythroughtheratio of struggle quantity and visitors’ flow. Traffic war method strategies typically cover conflicting points, number of conflicts, conflict price, conflict distribution, and battle forecastingmodels.Butthistechniquealsohasshortcomings, along with the inaccuracy of the located visitor’s conflicts numbers,andtheshortageofrightdivisionoftrafficconflicts inkeepingwithuniquetrafficconflictsdiverseoutcomeson sitevisitors’safety.Thejudgmentanddeterminationoftraffic conflicts are greater subjective nature. One-of-a-kind observers might also give special site visitors struggle judgments. Similarly, traffic war approach is a time-eating challenge.Althoughsitevisitorsconflictapproachhassuch issues,thistechniquehasbeenutilizedbymanyresearchers to examine intersection site visitors’ safety overall performance.Asmentionedabove,bothcrash-basedtotally and war-based protection evaluation methods have a few limitationsinactualpackages.
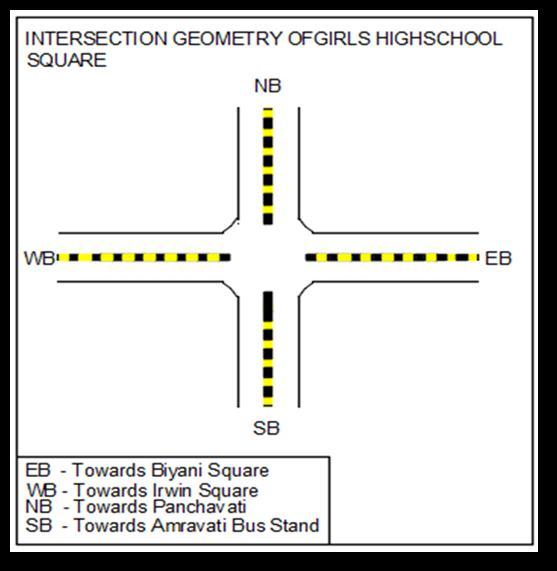
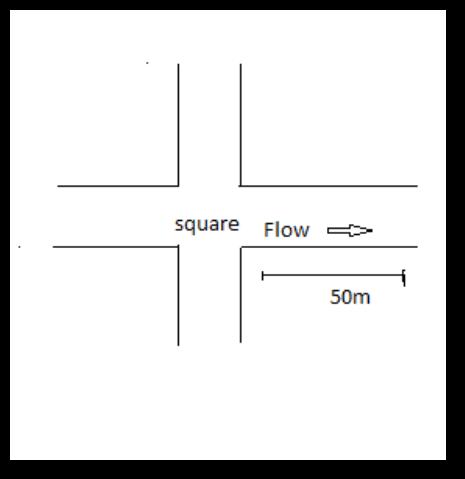
4.1 Intersection: Girl’s high school square, Amravati:
Fig -3:IntersectionGeometryofGirlsHighSchoolSquare
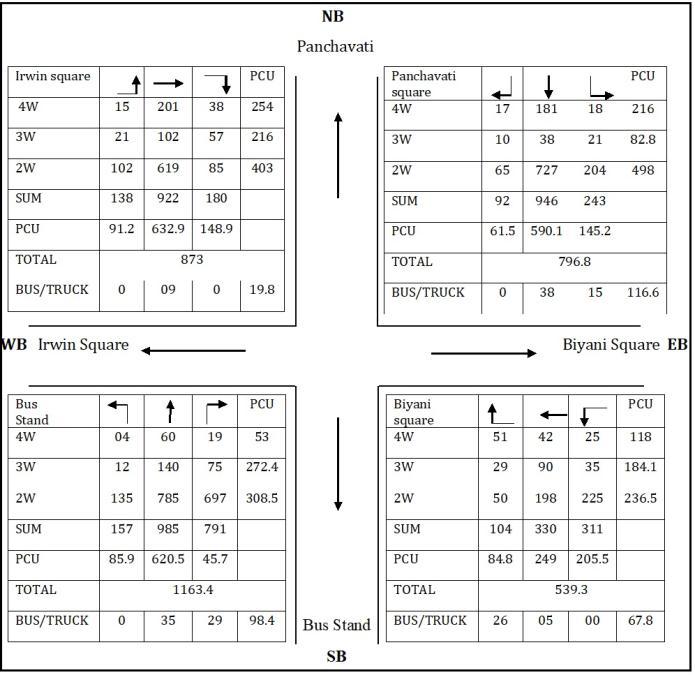
4.2 Volume Count Survey on Girls High School Square
PCUatGirl’sHighSchoolSquare(EveningPeakHour5:30 pmTo6:30pm)
International Research Journal of Engineering and Technology (IRJET) e-ISSN: 2395-0056
Volume: 09 Issue: 08 | August 2022 www.irjet.net p-ISSN: 2395-0072
20 22 21 18 8.78 52.68 22 24 23 21 10.24 62.93 24 26 25 22 10.73 73.66 26 28 27 18 8.78 82.44 28 30 29 15 7.32 89.76 30 32 31 9 4.39 94.15 32 34 33 6 2.93 97.07 34 36 35 3 1.46 98.54 36 38 37 2 0.98 99.51 38 40 39 1 0.49 100.00 40 42 41 0 0.00 100.00
Fig -4: VolumeCountSurveyonGirlsHighSchoolSquare NB–NorthBound EB–EastBound WB–WestBound SB–SouthBound
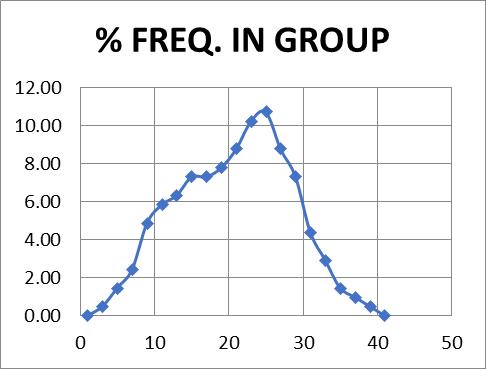
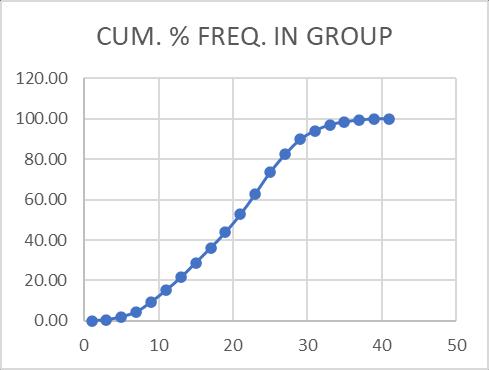
4.3 Spot Speed of Girl’sHighSchoolSquare
Table -1:SpotspeedstudybetweenGirl’sHighSchool square&IrwinRoad Lowest Limit Kmph
Upper Limit Kmph
Middle Speed (S) (Kmph)
Observed Freq. In Group
% Freq. In Group
Cum. % Freq. In Group 0 2 1 0 0.00 0.00 2 4 3 1 0.49 0.49 4 6 5 3 1.46 1.95 6 8 7 5 2.44 4.39 8 10 9 10 4.88 9.27 10 12 11 12 5.85 15.12 12 14 13 13 6.34 21.46 14 16 15 15 7.32 28.78 16 18 17 15 7.32 36.10 18 20 19 16 7.80 43.90
Chart -1:CumulativePercentageFrequencyinGroupfor Girl’sHighSchoolsquareRoad
Chart -2:PercentageFrequencyinGroupGirl’sHigh SchoolsquareRoad
International Research Journal of Engineering and Technology (IRJET) e-ISSN: 2395-0056
Saturation Flow is calculated by Saturation Headway Method, in this method by observing queue at the intersections.Aheadwayvalueiscalculatedandfromthat finally saturation flow is obtained. Saturation flow is the value which is the maximum traffic movement at the intersection by assuming fully green time is allowed for 1 hour,thisisneededforthecalculationfordelaysandlevelof service at intersections, it is important to adopt correct saturation flow rates for the intersection to be used, as a resultofinappropriatevaluesthatwouldoftenuseasdefault fromoverseassoftwaredevelopers.Thiscanresultinwrong resultsanddecisionsbasedonsaturationflow.
To determine the saturation flow rate from time measurements taken in the field the following equation is used:
s= 3600/hs
Where,s=saturationflowrate; 3600=numberofsecondsperhour; hs=saturationheadway.
Table -2:SaturationFlowofGirlsHighSchoolSquare
Sr. No Duration of 4th Vehicle
Duration of 8th Vehicle
No. of last Vehicle Saturation Headway
1 11.03 19.52 8 2.123
2 18.23 27.1 9 1.774
3 16.35 23.05 10 1.117
4 20.31 22.1 10 0.298
5 17.69 24.95 8 1.815
6 12.58 19.78 9 1.440
7 8.46 19.68 9 2.244
8 16.78 23.89 9 1.422
9 11.9 19.84 8 1.985
10 16.54 25.32 10 1.463
11 13.1 20.24 8 1.785
12 11.03 19.52 8 2.123
13 16.35 23.05 9 1.340
14 20.31 23.08 10 0.462
15 12.58 19.78 9 1.440 16 16.78 23.89 8 1.778
17 16.54 25.32 8 2.195 18 13.1 20.24 8 1.785 19 16.35 23.05 8 1.675 20 12.58 20.18 8 1.900 21 18.23 27.1 10 1.478 22 20.31 22.1 9 0.358 23 12.58 19.78 9 1.440 24 16.78 23.89 10 1.185 25 16.54 25.32 10 1.463 26 11.03 19.52 8 2.123 27 20.31 23.08 8 0.693 28 16.78 27.19 8 2.603 29 13.58 19.78 10 1.033 30 16.54 25.32 8 2.195 31 12.58 24.19 8 2.903 32 13.1 20.24 9 1.428 33 16.35 23.05 9 1.340 34 9.46 20.18 9 2.144 35 17.69 24.95 10 1.210 36 11.9 19.84 10 1.323 37 16.78 24.19 9 1.482 38 12.58 19.18 10 1.100 39 12.08 20.18 8 2.025 40 15.9 22.19 8 1.573 SUM= 63.260 hs=Sum/40 1.582 s=3600/hs 2276.308
5.1 Application of advance methodologies for improvement of intersections in Amravati city, Maharashtra, India.
AmravaticityissituatedincentralregionofIndia,itlies onthegeographicalcoordinatesofLatitude20°56'0"Nand Longitude77°45'0"E.
Therearemanynumbersofsignalizedandunsignalized intersections in Amravati city. All the unsignalized intersectionsareinflatareaandmanyoftheseintersections
Volume: 09 Issue: 08 | August 2022 www.irjet.net p-ISSN: 2395-0072 © 2022, IRJET | Impact Factor value: 7.529 | ISO 9001:2008 Certified Journal | Page1306
International Research Journal of Engineering and Technology (IRJET) e-ISSN: 2395-0056
Volume: 09 Issue: 08 | August 2022 www.irjet.net p-ISSN: 2395-0072
are controlled by police men or by signs and some of intersectionsareuncontrolled.Severalofintersectionsare located in major arterials or in local roads and their main functionismobility.Accordingtopastcrashdata,thesumof unsignalizedintersectionshaveahighannualcrashrate.Site visitswasconductedatmostintersectionstodeterminethe variousparametersoftraffici.e.spotspeed,trafficvolume, density. These characteristics reviewed included traffic control, sight distances, pedestrian facilities, road surface condition, crosswalk facilities, geometric design, lighting, vehicle speeds, and on-street parking. This research has plannedtoevaluateandimprovethesafetyperformanceof unsignalizedintersectionsinAmravaticity.Therefore,there isaneedtorankthesafetyproblemsattheseintersections causedbyexistingconditionsandrankthepossiblesafety countermeasures.
In this phase of the research, the field survey of fourteen intersection are carried out to analyse traffic parameterswhichcontributesinreducingsafetyandrelated countermeasures.Allmajorintersectionshavebeenselected situatedthroughoutthecityforstudy,eachoftheselected intersection has major crash rate due to high volume of traffic and congestion. Data were collected at all intersections. In addition, an attempt was made to select locations of varying characteristics (e.g., flow, speed flow, density,headway).Thedatacollectedattheseintersections wereusedasthebasisofanalysisforthisstudy.Anattempt wasmadetoselectlocationswithvaryingparameters
5.3 Based on field observations, there are some notices at selected intersections in Amravati city:
Numberofvehiclescomingonroadcanbecountedas follows.
Floworvolume:Numberofvehiclesthatpassapointon ahighwayduringaspecifictimeinterval.Formeasurement number of vehicles are counted, nt, which are passing a particular point on road in a defined period t. The flow q expressedinvehicles/hourisgivenby
q=nt/n
Flowisexpressedinplanninganddesignfieldtakinga dayasthemeasurementoftime.
Passengersaremoreconcernedwiththespeedofthe journey.Speedofjourneydeterminesthequalityoftravel.It can be defined as distance travelled in per unit time. Mathematicallyspeedorvelocityvisgivenby,
Where, ‘S’ is the speed of the vehicle in m/s, ‘d’ is distancetravelledinmintimetseconds.
Speedofdifferentvehicleswillvarywithrespecttotimeand space.Therearedifferenttypesofspeed.Importantamong them are spot speed, running speed, journey speed, time meanspeedandspacemeanspeed.
Spotspeedcanbedefinedas‘theinstantaneousspeedof avehicleataspecifiedlocation’.Fordesigningofgeometry of road, super elevation etc. Location and size of signs, designofsignals,safespeed,andspeedzonedetermination, spotspeeddataisrequired.IntheanalysisofAccidents,road maintenance,andcongestionspotspeeddataisusedasthe basic input. Endoscope, pressure contact tubes, radar speedometer,time-lapsephotographicmethodscanbeused to calculate spot speed. It can be determined by speeds extracted from video images by recording the distance travelingbyallvehiclesbetweenaparticularpairofframes.
Density can be defined as the number of vehicles occupyingagivenlengthofroadorlane.Itcanbeexpressed asvehiclesperKM.Photographofalengthofroadxcanbe
International Research Journal of Engineering and Technology (IRJET) e-ISSN: 2395-0056
Volume: 09 Issue: 08 | August 2022 www.irjet.net p-ISSN: 2395-0072
taken,Numberofvehiclesontheroadcanalsobecounted, nxatthatpointoftimeandthedensitycanbecalculatedas
Thedensityisthenumberofvehiclesbetweenthepoint AandBdividedbythedistancebetweenAandB.Densityis alsoequallyimportantasflowbutfromadifferentangleasit is the measure most directly related to traffic demand. Density measures the proximity of vehicles on the road whichinturnaffectsthefreedomforcomfortabledriving.
This study analysed the Traffic Parameters for Heterogeneous Conditions. It can be concluded that Light vehicles (car, jeep, etc.) occupied 35% of total vehicle. Percentageoftwowheelersisrelativelyhigh.Percentageof publictransportisverylessneedtobestrengthened.Road wideningisnecessarywherethereismorecongestion.PCU valueofavehiclesignificantlychangeswithchangeintraffic volume.Ifthetrafficvolumeismaximumthenspotspeedis minimumatsamepoint.InIndiatrafficismixedinnature havinglevelofsafetyis“F”outof“A,B,C,D,E,F”Thuswe need improve loss up to “C”. Thus, we need to form new equationforheterogeneoustrafficofIndia.Roadsideparking shouldbemodifiedorproperlyorganizedasperrulesand regulations.
IwouldliketoexpressmydeepgratitudetoProfessor Ashish Bijwe, my research supervisors, for his patient guidance,enthusiasticencouragementandusefulcritiquesof thisresearchwork.
IwouldalsowanttothankDr.MohammadZuhairforhis guidanceandhelpinkeepingmydevelopmentontrackand assistedmeincalculatingtheVolumecount,Saturationflow andSpotspeedstudy.
I would also want to thank all the teaching and nonteachingstafffortheirassistanceinprovidingmewiththe resourcesIneededtoanalysealltheparameters.
[1] IRC106–1990–Guidelinesforcapacityofurbanroads inplainareas
https://thelibraryofcivilengineer.files.wordpress.com/2 015/09/irc-106-1990-guidelines-for-capacity-of-urbanroads-in-plain-areas.pdf
[2] ChetanRPatelandDr.G.J.Joshi(2000),“Capacityand LOSforurbanarterialroadinmixedtrafficcondition.”
ASCE Journal of Transportation Engineering, 140 (1), 81-88.
[3] Chandra.SandKumarU.(2002),“Effectoflanewidthon capacityundermixedtrafficconditionsinIndia,”Journal oftransportationengineering,129,155-160.
[4] “CapacityEstimationofUrbanroadsunderMixedTraffic Condition”PratikU.Mankar,Dr.B.VKhode
[5] Velmurugan.S, Sitaramanjaneyulu.K and Gangopadhyay.S.(2010),“Criticalevaluationofroadway capacity of multi-lane high speed corridors under heterogeneoustrafficconditions”.
[6] JournalofIndianRoadsCongress,235-264.
[7] Ahmed Al.Kaishy, Younghan Jung and Hesham Rakha. (2005),“DevelopingPassengerCarEquivalencyFactors for Heavy Vehicles during Congestion”. Journal of TransportationEngineering,ASCE,Vol.131,No.7,pp. 514-523.
[8] AndrewP.Tarko,RafaelI.Perez–Cartagena,“Variability ofa Peak HourFactoratIntersections”,Submittedfor presentation at the 84 nd Annual Meeting of the Transportation Research Board, January 9- 13, 2005, WashingtonD.C.
[9] Arkatkar,S.S.(2011),“EffectofIntercityRoadGeometry on Capacity under Heterogeneous Traffic Conditions UsingMicroscopicSimulationTechnique”,International JournalofEarthSciencesandEngineering,ISSN09745904,Volume04,No06SPL,October2011,pp.375-380.
[10] Central Road Research Institute, (1988), “Capacity of RoadsinUrbanAreas”,ProjectSponsoredbyMinistryof SurfaceTransport,Sept,1988.