International Research Journal of Engineering and Technology (IRJET) e-ISSN:2395-0056

Volume: 09 Issue: 08 | Aug 2022 www.irjet.net p-ISSN:2395-0072
1Ph.D Student, ED-STII, Antananarivo University, Madagascar 2Professor, ED-STII, Antananarivo University, Madagascar 3Professor, ED-STII, Antananarivo University, Madagascar ***
Abstract - This paper presents studies to improve the results obtained by a localization system of a moving object using the asynchronous method as distance measurement method First, the filtering of the measured values by limiting the values in an interval to eliminate erroneous values, and after, the study of the different calculation methods such as the calculation of the average, the modal calculation and the median to improve the result, and with the shift values selection to stabilize it.
Key Words: Localization system, Plane, Trilateration, Distance, Asynchronous system, Arithmetic average, Mode, Median, Shift values selection
1 . INTRODUCTION
Therearetwomethodsforalocalizationsystemusingthe propagationtimeofasignal,synchronousorasynchronous dependingonthesystemusedtomeasurethedistance.
Valueserrorsduetotriggersignalprocessingdelayareless forsynchronoussystemthanforasynchronoussystem,the source of error in the asynchronous system being the estimationofthesourcesignaldeparturetime.
Thesynchronoussystemneedstwosignalswithdifferent speed to make the synchronization and used for the measurement. The measurement signal speed must be slower than the synchronizationsignal which itmust be toohigh,Indeed,thespaceofmeasurementisverylimited because of this slow measurement signal speed whose rangeisweak.[1]
We chose to continue the study on the asynchronous systemwhichisabletodolargescalepositioningandable touselongrangesignals.
Thus, in this paper, we will study some methods to improve the values measured by the sensors before applyingthetrilaterationcalculationfortheasynchronous system.
2 . Improvement of the result by selection and filtering of the measured values
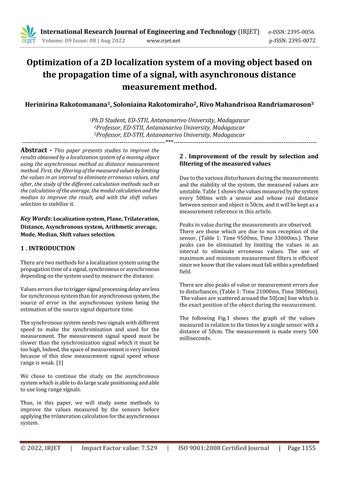
Duetothevariousdisturbancesduringthemeasurements and the stability of the system, the measured values are unstable.Table1showsthevaluesmeasuredbythesystem every 500ms with a sensor and whose real distance betweensensorandobjectis50cm,anditwillbekeptasa measurementreferenceinthisarticle.
Peaksinvalueduringthemeasurementsareobserved. There are those which are due to non reception of the sensor, (Table 1: Time 9500ms, Time 33000ms.). These peaks can be eliminated by limiting the values in an interval to eliminate erroneous values. The use of maximumandminimum measurement filtersisefficient sinceweknowthatthevaluesmustfallwithinapredefined field.
Therearealsopeaksofvalueormeasurementerrorsdue todisturbances,(Table1:Time21000ms,Time3800ms). Thevaluesarescatteredaroundthe50[cm]linewhichis theexactpositionoftheobjectduringthemeasurement.
The following Fig.1 shows the graph of the values measuredinrelationtothetimesbyasinglesensorwitha distance of 50cm. The measurement is made every 500 milliseconds.
Optimization of a 2D localization system of a moving object based on the propagation time of a signal, with asynchronous distance measurement method.Herinirina Rakotomanana1, Soloniaina Rakotomiraho2, Rivo Mahandrisoa Randriamaroson3
International Research Journal of Engineering and Technology (IRJET) e-ISSN:2395-0056
Volume: 09 Issue: 08 | Aug 2022 www.irjet.net p-ISSN:2395-0072
Tableau-1: Valuesmeasuredwitharealdistancebetweentheobjectandthesensorof50[cm]. Time [ms] Distance measured [cm] Time [ms] Distance measured [cm] Time [ms] Distance measured [cm]
0 53.76 14500 48.96 29000 49.92 500 53.28 15000 54.84 29500 47.4 1000 48.6 15500 51.48 30000 49.92 1500 48.6 16000 48.96 30500 53.28 2000 51.12 16500 51.12 31000 52.44 2500 49.8 17000 48.12 31500 51.96 3000 49.92 17500 54 32000 53.88 3500 53.88 18000 51.24 32500 54.6 4000 49.2 18500 51.6 33000 28699.8 4500 52.2 19000 50.28 33500 48.24 5000 49.44 19500 50.76 34000 49.44 5500 50.28 20000 48.24 34500 54.72 6000 47.28 20500 48.96 35000 48.96 6500 48.96 21000 54.84 35500 49.44 7000 51.36 21500 53.28 36000 51.84 7500 49.44 22000 49.56 36500 48.6 8000 53.16 22500 48.96 37000 50.28 8500 51.48 23000 48.24 37500 48.96 9000 50.28 23500 50.64 38000 58.44 9500 3319.92 24000 49.92 38500 49.32 10000 51.6 24500 49.44 39000 49.92 10500 49.8 25000 48.96 39500 46.92 11000 49.8 25500 49.92 40000 48.12 11500 47.28 26000 48.84 40500 49.44 12000 50.52 26500 50.28 41000 46.44 12500 50.28 27000 48.6 41500 51.12 13000 49.32 27500 51.12 42000 52.8 13500 49.92 28000 49.08 42500 49.8 14000 51.48 28500 49.44 43000 51.96
2022, IRJET | Impact Factor value: 7.529 | ISO 9001:2008 Certified Journal | Page1156
International Research Journal of Engineering and Technology (IRJET) e-ISSN:2395-0056
Volume: 09 Issue: 08 | Aug 2022 www.irjet.net p-ISSN:2395-0072
Fig-1 : Graphofthedistancemeasuredvalues
The quality of the positioning calculation result of the trilaterationmethoddependsontheselectionorfiltering ofthesemeasuredvalues.
Indeed, we are going to study and compare methods of filtering and selection of values. The arithmetic average, themode,themedianarecalculationstohavevaluescloser totherealvalue.Theshiftvaluesselectionmethodisalso studiedforstabilizinganddampingoftheresults
3 The arithmetic average
The classic method exploiting the calculation of the arithmetic average is a way to have a closer result that doesnotderivemuchfromtherealvalue.Thearithmetic averageisdefinedinEq.1.
(1)
4 Value processing time and response time
Itisnecessarytowaitforthereceptionofallthevaluesofa seriestobeabletocalculatetheaverageafterwards,sothe processing time depends on the period of the signal (durationbetween2consecutivesignals)andthenumber ofvalueschosenforaseries.
Hencetheresponsetimewhichdependsontheprocessing timeofeachseriesofvaluesisgivenbyEq.3. (3)
With Systemresponsetime, Thenumberofvalues inaseries, Theperiodofthesignal.
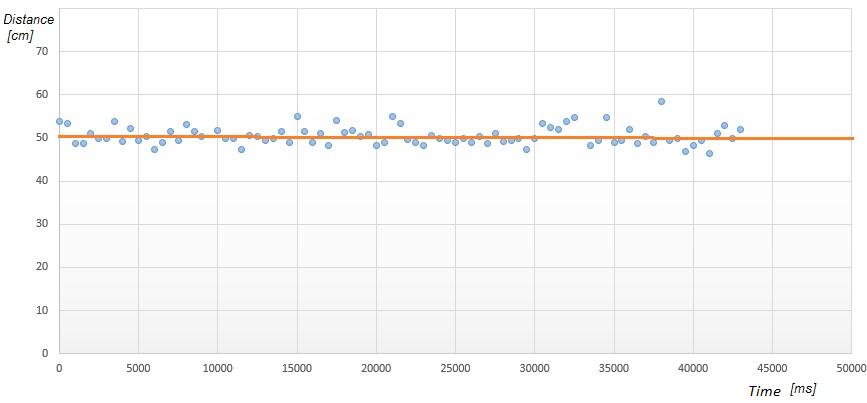
Byapplyingthearithmeticaveragetoaseriesof10values wehavethegraphinFig.2.
Usingtheseriesofvalues
Theaverageis rewritteninEq.2 (2) [2][3]
It can be seen that the curve of distances obtained by arithmeticaverageissmoothercomparedtothecurveof themeasuredvalues.

International Research Journal of Engineering and Technology (IRJET) e-ISSN:2395-0056
Volume: 09 Issue: 08 | Aug 2022 www.irjet.net p-ISSN:2395-0072
Fig-2 : Graph measuredvalue/arithmeticaverage (n=10),
5 The Mode
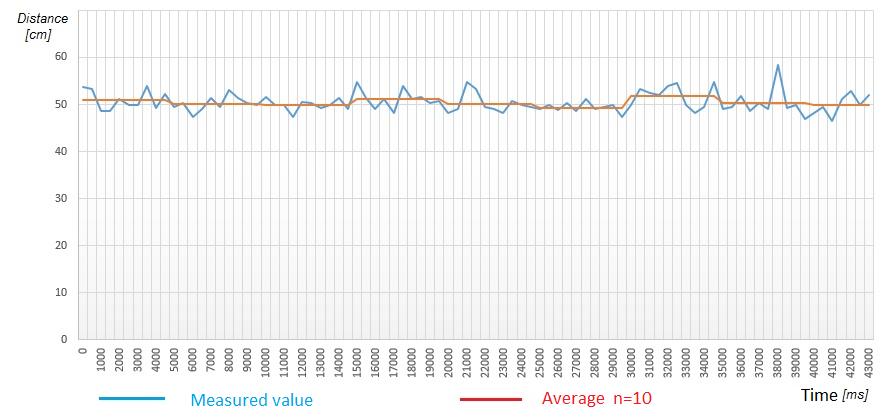
Modeisamethodforimprovingtheselectionofmeasured valuesthatmostcloselymatchtherealvalues.Thismethod consistsbyselectingthemostfrequentvalueinaseriesof measuredvalues [2][3]
Example:themodeoftheseries{4,2,4,3,2,2},is2because it appears three times. 2 is the value with the highest numberofoccurrences.[2][3]
ThealgorithminFig.3allowstodeterminethevalueofthe modeinaseriesofnvaluesandFig.4showsthegraphof thevaluesbyapplyingthisalgorithmbytakingn=10.
Fig-3 : Modecalculationalgorithm.
International Research Journal of Engineering and Technology (IRJET) e-ISSN:2395-0056
Volume: 09 Issue: 08 | Aug 2022 www.irjet.net p-ISSN:2395-0072
Fig-4 : Graph measuredvalue /mode.
6 The median
Itisthecentralvalueofaseries whoseobservedvalues have been arranged in ascending order. It is the value whichdividesthepopulationstudiedintotwosubsetsof thesamenumber(ifthenumberofobservationsniseven, the median is the half-sumof the terms of rank n/2 and (n/2)+1). [2][3]
Example : The median of the series :(4, 2,1, 7,7)is 4 because,afterorderingthevaluesinascendingorder (1,2,4,7,7),4isthevaluethatdividestheseriesintotwo equalhalves.[2][3]
ThealgorithminFig.5allowstodeterminethevalueofthe medianofaseriesofnvaluesandFig.6showsthegraphof thecorrespondingvalues(withn=11).
International Research Journal of Engineering and Technology (IRJET) e-ISSN:2395-0056
Volume: 09 Issue: 08 | Aug 2022 www.irjet.net p-ISSN:2395-0072
Fig-6 : Graph measuredvalue/Median (n=11)
7 Comparisons and Interpretations
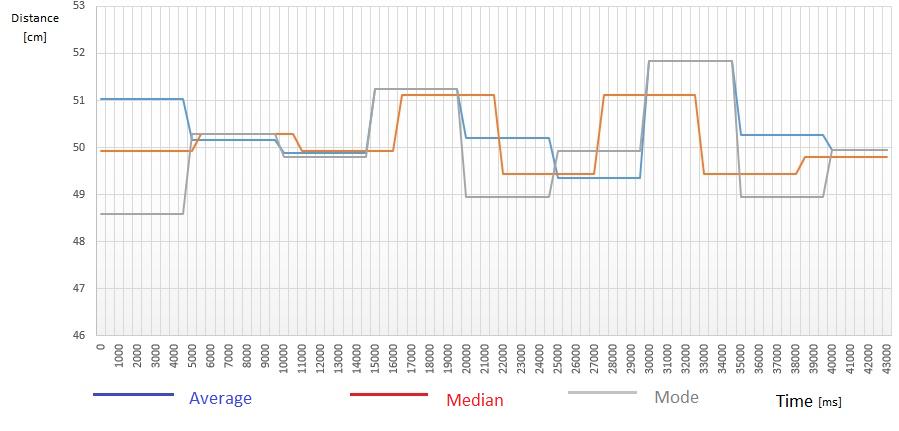
Thecalculationofthearithmeticaverageofseriesofvalues presents peaks which cause the value of the calculated averagetodeviateconsiderably.
The mode calculation cannot succeed on some series of values because of the non-existence of similar values. Indeed, with a precision of 10-2 it is rare to find a redundantoccurrence.
Themediancalculationisnotaffectedbytheexistenceof peak values. Moreover, regardless of the measurement series, a result is always obtained by the calculation algorithm.
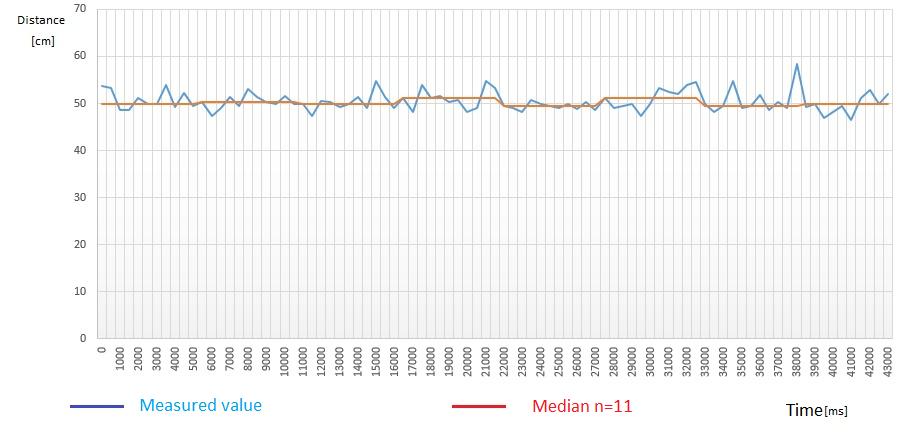
Figure 7 shows the superimposed graphs obtained by usingtheaverage,mode,andmediancalculationmethods. Itcanbeseenthattheuseofthemediangivesaresultthat isclosertoreality.
Fig-7 : Graph average(n=10)/ mode(n=10)/median(n=11)
International Research Journal of Engineering and Technology (IRJET) e-ISSN:2395-0056
Volume: 09 Issue: 08 | Aug 2022 www.irjet.net p-ISSN:2395-0072
8 Shift values selection
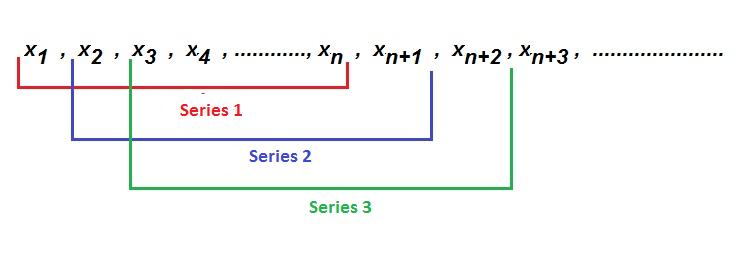
Consideringthattheobjecttobelocatedisamobileobject, in order to consider the displacement of the object, the shift values selection is introduced into the system. The shift values selection method provides a more damped resultbyshiftingtheselectedvaluesoneleveleachtimea newvalueisreceived.Fig8illustratesthevaluesselected ateachnewseriesbyrunningthealgorithminFig.9.
Fig-8 : Illustrationof shiftvaluesselection
Fig-10 :Graphaverage/averagewithshift,(n=10)
10 Median with Shift values selection
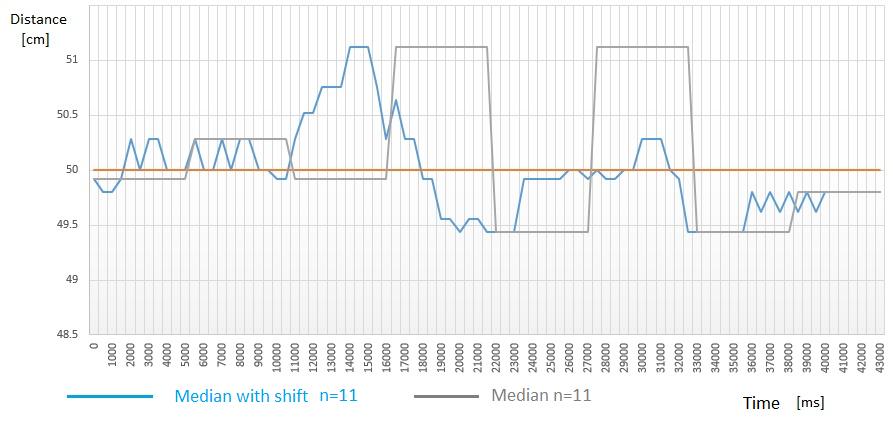
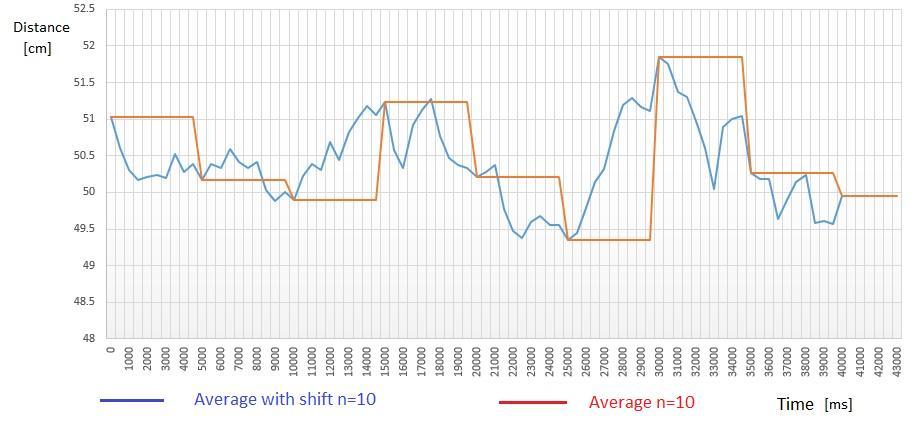
Fig.11presentsthemeasurementresultsusingthemedian andthemedianwithshiftvaluesselection.
Fig-11: Graphmedian/medianwithshift,(n=11).
11 Interpretation
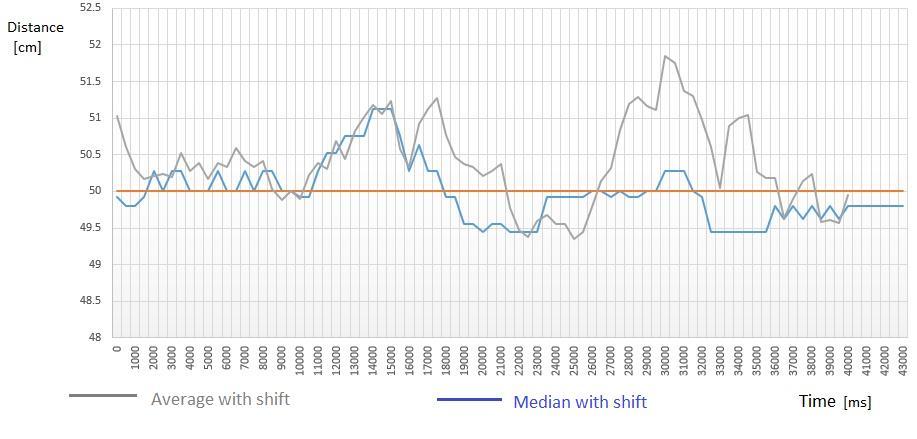
By overlaying the moving average and moving median plots(Fig.12),itcanbeseenthatthemovingmediancurve isclosertothetruevaluecurve.Thisfurtherconfirmsthe effectiveness of the method by median with shift values selectionfortheasynchronousmeasurementsystem.
Fig-9 : shiftvaluesselectionalgorithm.
9 Average with Shift values selection
Byapplyingtheshiftvaluesselection onthecalculationof thearithmeticaverage,Fig.10isobtained.
value:
International Research Journal of Engineering and Technology (IRJET) e-ISSN:2395-0056
Volume: 09 Issue: 08 | Aug 2022 www.irjet.net p-ISSN:2395-0072
Fig-12: Graphaveragewithshift/medianwithshift (n=11)
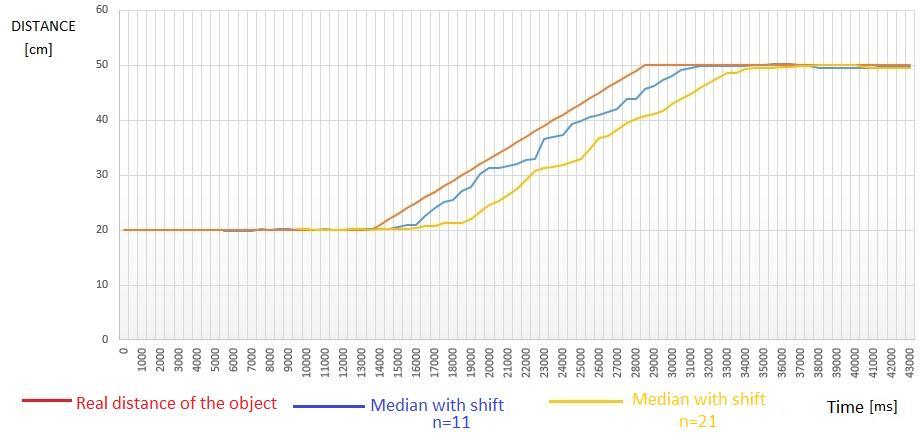
Fig-14 : Graphmedianwithshift(objectinmovement) withdifferentnumberofselectedvalue
12
Application
of the median with shift values selection on the asynchronous measurement system
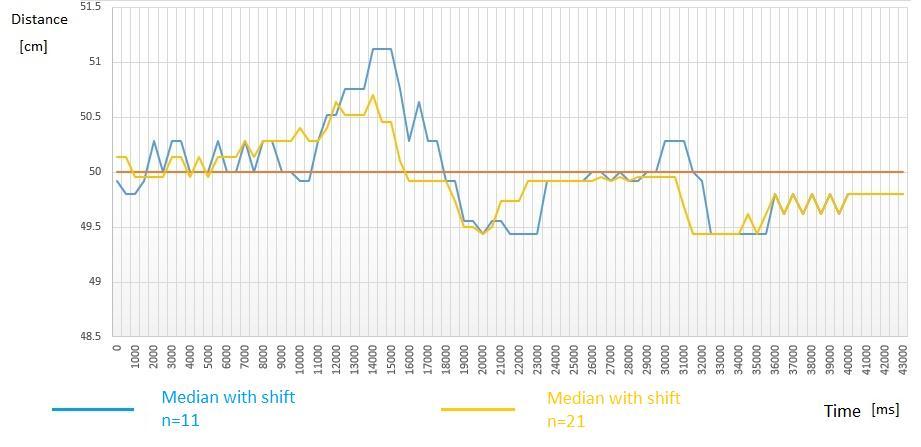
Instaticmode(stationaryobject)themorethenumberof valuesselectedinaseriesisincreased,thebettertheresult isobtainedasshowninFig.13.
But in dynamic mode (moving object) increasing the numberofselectedvaluesleadstoadelayinresponse,as showninFig.14.
13 CONCLUSIONS
Afteranalyzingalltheresultsobtainedbysomemethods applied to improve the accuracy of the distance measurement,themethodofferingthehighestaccuracyis themedianwithshiftvaluesselection.
Nevertheless,theprecision/responsetimedualitybecomes themainconstraintfortheimplementationofthesystem. Indeed,moremeasurementprecisionneedmorenumber ofmeasurements,thusgeneratingadelayinthesystem. In order to further reduce errors on these systems, the reviewoftheTDC(TimetoDigitalConverter)systemcould helptorefinethecalculationofthetimes.
REFERENCES
[1] H. Rakotomanana, S. Rakotomiraho, and R. M. Randriamaroson. “2D localization systems of a mobile object based on the propagation time of signal, using synchronous and asynchronous distance measurement systems” https://www.irjet.net/archives/V9/i6/IRJETV9I6366.pdf,2022.
[2]K Polisano.CoursdeStatistiquesniveauL1-L2.Licence. HAL.https://hal.archives-ouvertes.fr/cel-01787365,2018.
Fig-13: Graphmedianwithshiftforstationaryobject
[3] J. Kalani, BASIC STATISTICS FOR ADVANCED LEVEL MATHEMATICS,https://www.academia.edu/28448063/ BASIC_STATISTICS_FOR_ADVANCED_LEVEL_MATHEMATI CS,2005.
[4] Geoffrey Blewitt, “Basics of the GPS Technique: ObservationEquations”,2000.
[5]A.Bodin,L.Blanc-Centi,N.Borne,B.Boutin,L.Desideri, P. Romon, “GEOMETRIE”, http://exo7.emath.fr/cours /livre-geometrie.pdf,2016.
2022, IRJET | Impact Factor value: 7.529 | ISO 9001:2008 Certified Journal | Page1162