International Research Journal of Engineering and Technology (IRJET) e-ISSN: 2395-0056

Volume: 09 Issue: 08 | Aug 2022 www.irjet.net p-ISSN: 2395-0072
International Research Journal of Engineering and Technology (IRJET) e-ISSN: 2395-0056
Volume: 09 Issue: 08 | Aug 2022 www.irjet.net p-ISSN: 2395-0072
Abstract - Currently the seismic design of reinforced concrete structure is subjected to a concern earthquake are the only natural disasters that may wipe out human life and financial source. by doing response spectrum method to a structure subjected to a static loading. The RC shear walls are better used in the structure to reduce the lateral forces occurring due to the earthquake in tall structures. The behavior of RC shear wall structure is significantly influenced by distributing stiffness and the mass of the building and the soil structures.In this study RC frame models with and without shear wall are subjected to the pushover analysis. To track the ultimate yield point and the targeted displacement and performance point as well. Structure is symmetrical with 5 bays in X direction and 5 bays in Y direction area of the building is (25m X 25m). The models are Bare frame, shear wall at centre ,Shear wall at Exterior and lastly Shear wall at corners these models are analyzed in Etab’s 2017 software and the results are determined and compared with each one of the models
Key Words: seismic design,PushoverAnalysis,non-linear StaticAnalysis,Hinges
Any structure that is subjected to seismic loading needsextensiveknowledgeofhowthestructurewillbehave under significant in elastic deformation. Unlike, seismic loads behave differently understanding the behavior of inelastic deformation is necessary to predict structural behaviorunderseismicloads.Pushoveranalysisalsoknown as non-linear static analysis is a process used to assess structuresloadedbeyondtheirelasticrange.Thenon-linear static push over analysis approach has recently gained preciseknowledgetotheintroductionofperformancebased design. In a static non-linear process know as push over analysis the amount of structural loading is gradually increasing in the lateral direction according to a predeterminedpattern.
Theresultsthatcanbeseeninformofstoreyforces ordisplacementorfundamentalmodeshapesformanditis consideredthathowmodescontrolsthestructurebehave. Thenon-linearbehaviorof various structuralelementsby thiswecometoanconsiderationthatbydoingthepushover analysisanalysisitshowtheweaklinksinthemembersso that members can be retrofitted by increasing the reinforcement to that members. This analysis is done by manysoftwaressuchasEtabs,StaadProetc..
Pushoveranalysisalsoknownasnon-linearstatic analysis,hasbeencreatedoverthepast2decadesandhas growntobeaprominentanalyticalmethodforfaststyleand unstable performance analysis because it is a comparably simpleprocess.The(FEMA356,440,ETC)and(ATC-40)are thetwoorganizationsthataredevelopedandadvocatedfor the non-linear static analysis, also called as the pushover analysis which is done as per the American standards. As non-linearstaticanalysisisaprocedureforsimplifiednonlinear methods to estimate the seismic behavior of the structureatwhatforcethestructureisdeformed.These non linear methodisanincrementalstaticmethodwhichisused generally to determine capacity curve or the demand capacitycurvewhichshowstheresultsinprescribedpattern ofthestructure.Suchthatpushingastructurebyapplying thelateralsloadsand the controlleddisplacementat each floor,untilthestructurereachingtoitsultimateconditionor at the collapse prevention condition. Push over analysis procedurewhichhelpsustofindtheweaklinksinthebeams andcolumns
DCM
CSM
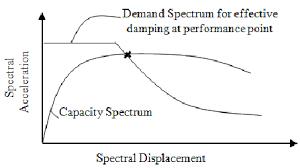
(DCM)DisplacementCo-efficientMethod:Thismethodis usedtocalculatethetargeteddisplacementofthememberin thestructure.
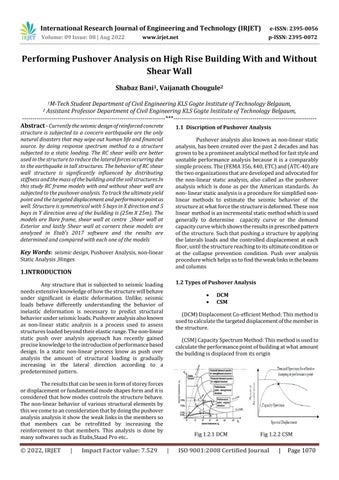
(CSM)CapacitySpectrumMethod:Thismethodisusedto calculatetheperformancepointofbuildingatwhatamount thebuildingisdisplacedfromitsorigin
Fig1.2.1DCM
Fig1.2.2CSM
International Research Journal of Engineering and Technology (IRJET) e-ISSN: 2395-0056
Volume: 09 Issue: 08 | Aug 2022 www.irjet.net p-ISSN: 2395-0072
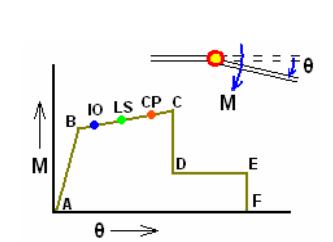
Plastic hinges are the hinges in the structure where the structuralelementactsinaninelasticbehavior.Bysimply addingtheconcentratedplastichingesinthestructurefor beams,columnsandthewalls.Elasticbehaviorhappensover the length of the member and the deformation within the elasticlimitoccursentirelyonthestructure.Byintegrating theplasticstrainandtheplasticcurvatureatintervalshinges defined at a length. In the structure distant from 0.1% to 0.9%hingeswerecreatedoneachmemberofthestructure. Asetofhingescanbedescribedtorepresentplasticitythatis spread along the length, many hinges can be located at a same spot. Deformation may occur due to force and the displacementonthemodel.Belowfiguresshowsoperational levelsandthehingescreatedoneachfloor
IO-ImmediateOccupancy LS-LifeSafety CP-CollapsePrevention
2.0
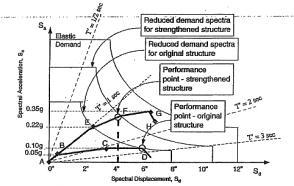
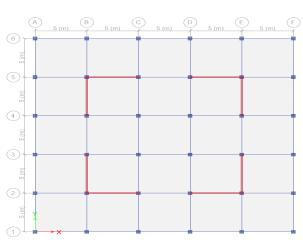
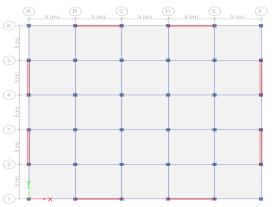
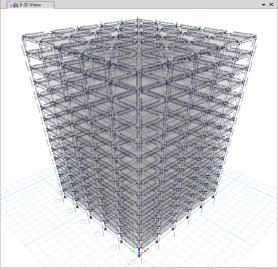
Forthepurposeofdesign,multistorystructureisconsidered with G+15 storeys having a dimension of 25mX25m.Thickness of slab is considered 150mm throughout the analysis. Floor height is considered 3m.ColumnsandBeamsare describedin belowtable.The deadloadis1kN/m2 andliveload2kN/m2 .Fortheseismic analysis,thestructureisconsideredinzoneV,importance factoristaken1andsoiltypeistakenasmedium.Theshear wallsystemswithvariousconfigurationarelocatedhaving widthof200mmalloverthedesign.
Sl No Discription 1 NoofStorey G+15 2 TypicalFloorHeight 3m 3 GroundFloorHeight 3m 4 PlanDimension 25*25m 5 BeamSize 0.3*0.45m
6
ColumnSize 0.4*0.4m 7
ThicknessofSlab 0.15m 8
ConcreteGrade M25 9 RebarGrade Fe500 10
ThicknessofShearWall 200mm 11 FloorFinish 1kN/m2 12 Liveload 2kN/m2 13
SeismicloadasperIS 1893-2016 14 ImportanceFactor 1 15 Zone V
Finalizing the structure. Analysing and design the model firstly with response spectrum to check whether all membersarepassing
After analyzing the model. Adding the load cases to the structure and changing the dead load to the non-linear staticfromtheremethodwillstartworking
AfterthataddingthecasesforPush-XandPush-Yasanon linearstaticanalysisbygivingloadcasesonit
Applyingthehingepropertiestomembersofthestructures i.ebeamsandcolumnsandwalls
Assigningthehingespropertiestothemembersdistantfrom 0.1%to0.9%oneachmember
After the hinges. Hinge over write should be done it will divideitin0.1
Runanalysisisdoneonlyondeadload,Push-X,Push-Yrest allloadsdonotRun
Checking the hinges that are created at each step of the members
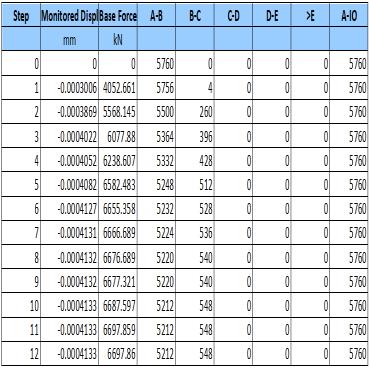
Checkthestoryresponsesandthecapacitycurve
Hingecurves
International Research Journal of Engineering and Technology (IRJET) e-ISSN: 2395-0056
Volume: 09 Issue: 08 | Aug 2022 www.irjet.net p-ISSN: 2395-0072
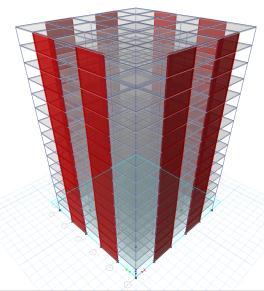
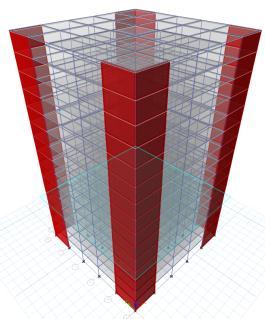
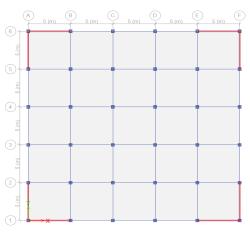
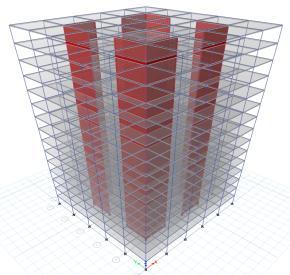
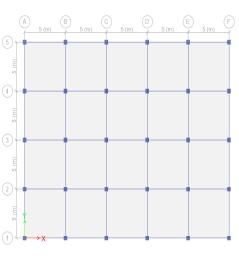
SHEARWALLATCENTRE SHEARWALLATEXTERIOR
Fig2.2.3PlanView Fig2.2.43DModel Fig2.2.5PlanView Fig2.2.63Dmodel SHEARWALLATCORNER Fig2.2.7Planview Fig2.2.83DModel
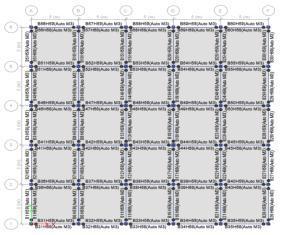
distantof0.1%to0.9%bythisweaklinkscanbedetermined
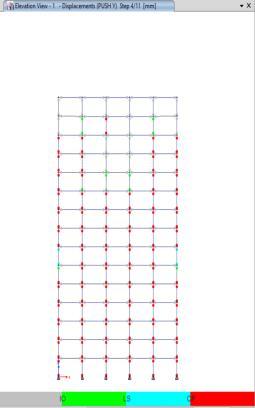
Above figures shows the formation of hinges in both the directionXandYsameasforall3modelswithShearwall
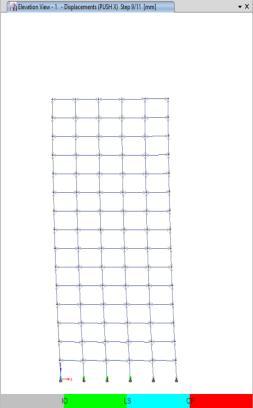
X-Direction Y-Direction
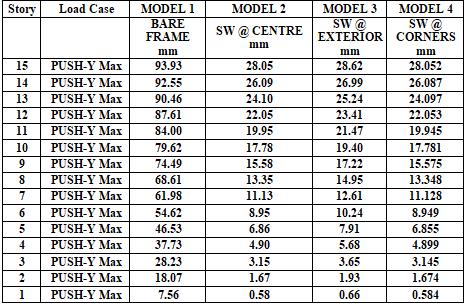
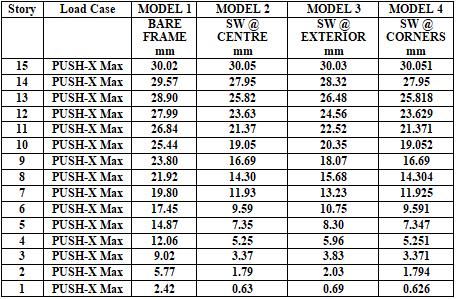
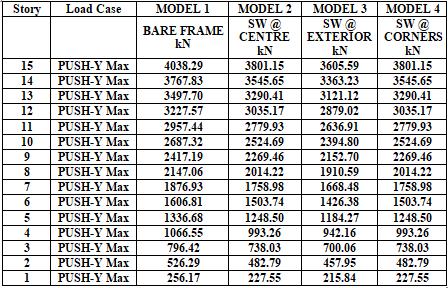
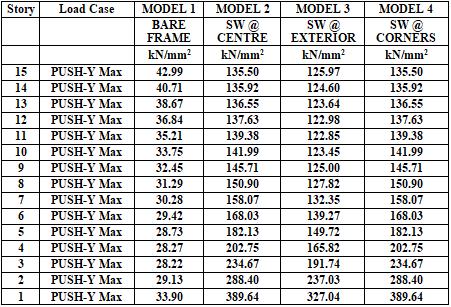
Hingesformartiononeachmemberofthestructurefroma 2.4 RESULTS IN TABLE
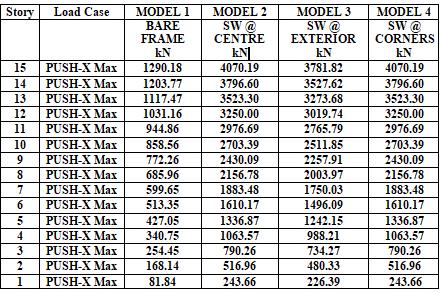
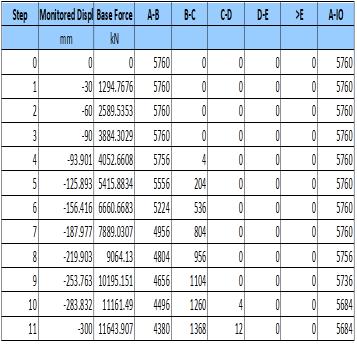
Table1.1StoreyForcesinX-Direction
International Research Journal of Engineering and Technology (IRJET) e-ISSN: 2395-0056
Volume: 09 Issue: 08 | Aug 2022 www.irjet.net p-ISSN: 2395-0072
International Research Journal of Engineering and Technology (IRJET) e-ISSN: 2395-0056
Volume: 09 Issue: 08 | Aug 2022 www.irjet.net p-ISSN: 2395-0072
It is concluded that the Shear wall at Centre is better positioning in the building which reduces the maximum lateralforcesandthestructurewillbehavemorestiffinthe seismiczones.
Aswehaveseenthattheresistanceof horizontalforcesor lateralforcesaremoreonthestructuretoreducesuchforces on the structure the shear wall are used to reduce the upcomingforcesonthestructure.
Asweknowthatmostoftheforcesareresistedbytheshear walltoincreasethestiffnessanddecreasethedisplacement ofthestructure.AsastructuralEngineerneedtodetermine thebetterpositioningoftheshearwallinthestructure.
Beforedoingthepushoveranalysisthestructureisanalyzed by the response spectrum method to applying all the earthquakeloadsonthestructureinboththebaysof Xand Ydirectionofthestructure.
Themodelswhich aremodeledintheEtab’ssoftwareare (Bare Frame ,Shear Wall at Centre SW1,Shear Wall at Exterior SW2,and lastlyShearwall atCornersSW3 where heightoftheshearwallismaintainedaspertheheightofthe structurewhichis45minallstructure.
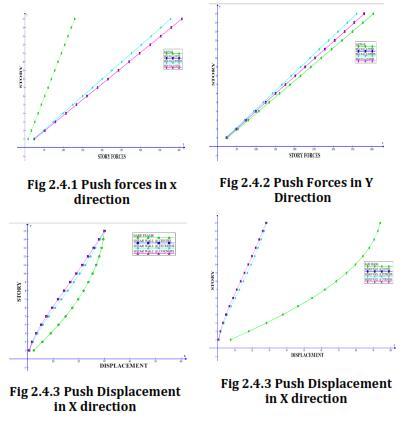
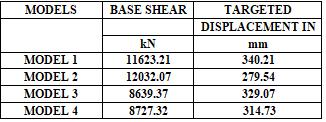
Allthetransitionalvaluesaretakenfrom thesoftwareand preparedaExcelsheetforStoryforces,storydisplacement ,storystiffnessandthenaturaltimeperiodwereobservedby comparingallthemodelsforcesareinincreasinginrest3 modelsbecauseofshearwall bythatcomingtoapointthe stiffnessisincreasinganddisplacementisdecreasingasper our models the base shear is more in the model 2 and displacementisless.
This work shows that the results which are obtained for G+15multistorybuildingunderstandingthebehaviorofthe model which are subjected to the DL+LL and the load combinationareresponsearetakenasoutput
Thepercentagevariationfrommodeltomodelstoryforces aremoreinmodel2 7%ascomparedwithother3models
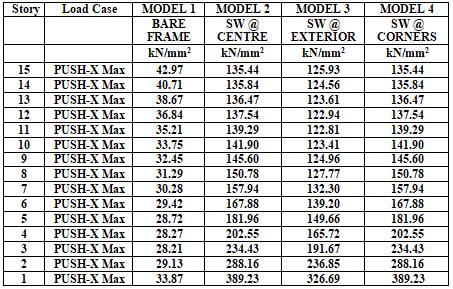
Thepercentageofstiffnessismoreinmodel210%andthe displacementismoreinmodel170%
Theresultsofthemodelsareconcludedthatthebaseshear ismoreinmodel2anddisplacementisalsoless
As the study of the all literature we come to an understandhowthebehavioroccursduetononlinearstatic analysis PushoverAnalysisisanonlinearanalysiswhichis used to calculate the seismic behavior of the structure by applying the hinges to the beams, columns and walls by intersectingdemandcurveandcapacitycurve
Providingtheshearwallisthemostimportantpointinthe building which reduces the maximum lateral forcesinthe building .Models with and without shear walls the comparison with RC Frame with shear wall structure seemedtobetterperforminmajorseismic.Withthisproject weconcludedthatmodel2shearwallatCentreisthebest placetoinstallintheRCstructure.
[1] DhangarLaxmiBalappa.(2018) PushoverAnalysisof HighriseBuildingswithandwithoutBracings”.International JournalofCivilEngineeringandTechnologyVol-09,Issue 09,PP.759–767
[2] RahulLeslie.2009ThePushoverAnalysis,Explainedin its simplicity”. 10th National Conference on Technological trendsVol06,Issue07
[3] Pu Yang and Yayong wang (2015) “A study on improvement of pushover analysis”. Research Gate vol 11 Issue04,
[4] Joheb Ahmed and Syed ahamad Raza (2009).seismic vulnerability of RCC Buildings by considering plan Irregularities using Pushover Analysis. Global Journal of ResearchAnalysisvol3,Issue09
[5] Mohammed Anwaruddin, Md Akberuddin (2013) ,Pushover Analysis of Medium Rise Multistory RCC Frame withandwithoutverticalIrregularityusingEtabsSoftware” journal of engineering research and applications vol. 03 , Issue05
[6] Niveditan.RautandSwatid.Ambadkar(2013)Pushover Analysis of Multistoried Building Global Journal of ResearchesinEngineeringCivilAndStructuralEngineering Vol13Issue4OnlineISSN:2249-4596andPrintISSN:09755861
[7] Mrugesh d. Shah, Atul N. Desai and Sumant B Patel (2020)ConductedastudyonPerformanceBasedAnalysisof RCCFramesResearchGatevol08 Issue09
International Research Journal of Engineering and Technology (IRJET) e-ISSN: 2395-0056
Volume: 09 Issue: 08 | Aug 2022 www.irjet.net p-ISSN: 2395-0072
[8] AntonioS,PinhoR.(2004).Developmentandverification of a displacement-based adaptive pushover procedure. JournalofEarthquakeEngineering,vol 08 Issue05PP643661
[9] Poursha,M.Khoshnoudian,F.,Moghadam,AS(2009).A consecutivemodal pushoverprocedurefor estimatingthe seismic demands of tall buildings, Engineering Structures, vol31 Issue02, PP591-599
[10] IS 875:1987, “Indian Standard Code of Practise for Design Loads (Other than Earthquake) for Buildings and Structures, Part 1: Dead Loads, Part 2: Imposed loads”, BureauofIndianStandards,NewDelhi.
[11]IS1893:2016,.”IndianStandardCriteriaforEarthquake ResistantDesignofStructures”,Part1:GeneralProvisions andBuildings”,BureauofIndianStandards,NewDelhi.
2022, IRJET | Impact Factor value: 7.529 | ISO 9001:2008 Certified Journal | Page1075