International Research Journal of Engineering and Technology (IRJET) e ISSN: 2395 0056

Volume: 09 Issue: 07 | July 2022 www.irjet.net p ISSN: 2395 0072
International Research Journal of Engineering and Technology (IRJET) e ISSN: 2395 0056
Volume: 09 Issue: 07 | July 2022 www.irjet.net p ISSN: 2395 0072
1M.E Student, Dept. of Transportation Engineering, S.G.S Institute of Technology and Science, Indore, India
2Professor and Head, Dept. of Civil Engineering, S.G.S Institute of Technology and Science, Indore, India
3 M.E. Student, Dept. of Transportation Engineering, S.G.S Institute of Technology and Science, Indore, India ***
Abstract India is a growing nation, and as a result, its cities are also going through significant urbanisation and modernization. As a result, the amount of traffic on the roads has increased significantly. One of the largest and fastest growing cities in central India is Indore. The city's metropolitan roadways have experienceda constant growth in vehicle traffic as a result of which they are approaching their intended capacity, which has led to a particularly complicated traffic pattern. In the study four RoadStretches are considered and the data should be collected form all the four stretches. At the end Road level of Service is determined and the values are compared with the values in Highway Capacity Manual and the deductions are drawn.
JabalpurisoneofcentralIndia'smostsignificantandfastest growingcities.InthestateofMadhyaPradesh,itisthesole metropolis.Inrecentyears,thecity'straffichasbeenmore intense due to the emergence of an industrial sector and commercialexpansion,aswellastheincreaseinpopulation. The city's metropolitan highways have experienced an unrelentinggrowthinautomotivetraffic,resultinginaslew of issues such as reduced lane width, traffic congestion, insufficient parking places, signal delays, reduced road capacity, air pollution, and road accidents, to name a few. Becausethecity'sroadwaysareapproachingtheirplanned capacity, the nature of traffic is becoming increasingly complicated. Lack of lane discipline, a broad variety of vehiclesizesandtypes,andawiderangeofvehiclespeeds aresomeoftheotherprimaryessentialelementsimpacting trafficflowontheroadways.Asaresult,itisnecessaryto comprehend the nature of traffic flow while taking into considerationthecurrenttrafficflowontheroads,aswellas to modify the traditional elements that were used to constructtheroadsinordertoenhancethetrafficcondition oftheexistingroadstosomelevel.
There are various research done over the Road level of Service and Capacity, Patel and Joshi (2012) In Surat, Gujarat, India, done Cluster Analysis to determine service level thresholds based on volume to capacity ratio. The
findings of this study are extremely valuable in assessing traffic quality on access controlled urban arterials with mixedtraffic. Janwari et al. (2014) determineRoadLevel OF Service and Roadway Congestion Index for 22 road linkages.ThestudyalsodiscoveredthattheIRC106:1994 andHCMmethodsfordeterminingLOSarenotrelevantin urban road scenarios. According to the study, the speed parameterandpedestrianflowinestablishingLOSonurban roadways need to be revised in the code. Gajjar and Mohandas (2014) In Mumbai, Maharashtra, a rigorous studyofroadcapacityonimportantmetropolitanrouteswas carried out. According to the research, numerous main highways in Mumbai have well exceeded their capacity in termsofthroughputperlane.Interestingly,despitethehigh volume,noseriouscongestiondifficultieswerediscovered on these roadways. Raval et al. (2017) finds that the recommended capacity value given by the Indian Road Congress(IRC)basedondesignservicevolumeislessthan theactualcapacityestablishedinthefield.
The Highway Capacity Manual is a compilation of cutting edgemethodsforassessingcapacityanddefiningthelevelof service for transportation assets. The notion of "Level of Service"wasoriginallyestablishedintheHighwayCapacity Manual(HCM).TheHighwayCapacityManual(HCM)(1965) was the first to offer the notion of LOS and certain accompanyingperformancemeasurementsthataccurately reflectaroadway'soperationalcharacteristics.SixLOSwere proposedbasedonperformanceindicatorssuchasaverage traffic speed, peak hour factor, v/c ratio, load factor at intersections, and flow conditions (stable, unstable or forced). In HCM (1985), density was chosen as the major criterion for evaluating performance, and five LOS were recommended as a result. HCM (2000) proposed using average travel speed (ATS) as the only criterion for determiningtheLOSofacityroadway.SixLOScriteriawere providedbasedontheATSvalueforeachofthefoururban street classes, whereas the free flow speed was used to identifytheurbanstreetclass.SixLOSwereproposedinthe mostcurrenteditionofHCM(2010),alongwiththreshold levelsofpercentagefree flowspeed,whichwaspresentedas the principal performance metric for LOS evaluation of urbanstreetsforautomobilemode.
International Research Journal of Engineering and Technology (IRJET) e ISSN: 2395 0056
Volume: 09 Issue: 07 | July 2022 www.irjet.net p ISSN: 2395 0072
Followingaretheobjectivesofthepresentstudy:
1. To conduct a traffic volume, capacity, and space meanspeedstudyontheselectedsegments.
2. Todeterminevehiclecompositionineachstretch.
3. Toascertainpeakandoff peaktrafficflow.
4. To determine the speed, density, and flow relationshipfortheresearcharea.
5. ToproposeimprovedLevelofServicestandardsfor theentiresection'sobservedtraffic.
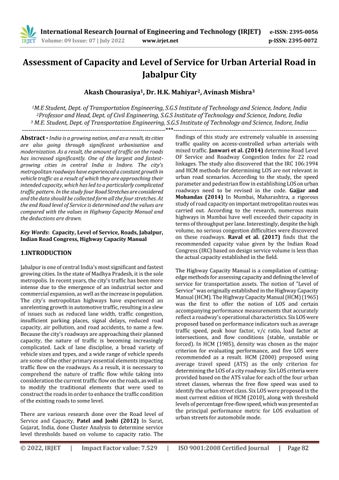
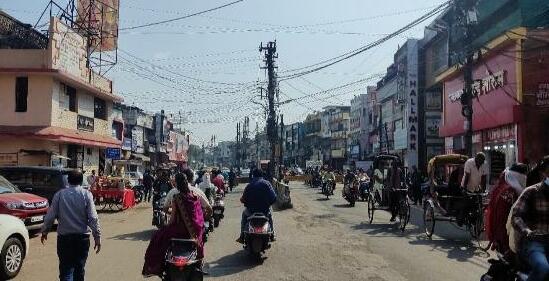
FollowingaretheroutesconsideredinthestudyatJabalpur City in Madhya Pradesh. The Route taken under considerationisinitializesfrom“BadaPhuhara”to“Rampur Chowk”(4.4Km)stretch.“BadaPhuhara”isthemajorflee marketofthecitynearHanumantaal.Duetofleamarketand templesnearBadaPhuharathereismajortrafficcongestion inthisarea.Thenextareatobecoveredis“MalviyaChowk”, thebookmarketofthecityislocatedatthe“MalviyaChowk”, samdariya mall and police control room are also the importantplacesnearthisarea.Afterthatbloomchowkis theimportantspottobecovered,theBloomChowkcovers ShowroomslikeLotus,Reliancedigital,etc,Bloomchowkis alsoconsideredasthemedicalhubofthecity.Furtherwe movetowardschotilinesquareandRampurChowk.These coverssmallfleamarketsandtemplestheseplacesdirectly connecttotheRailwaystationofthecity
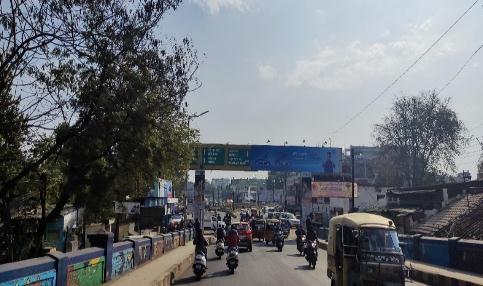
Due to heavy traffic and mixed vehicle composition along thissection'sroute,theroad'straffichandlingcapacitywas reduced, leading vehicle travel times to be delayed, especiallyduringpeakhours.Themajorityofintercityand localbusesutilisethisroad,resultinginfrequenttrafficjams anddelayedtrafficmovement,ultimatelyaffectingtheroad's traffichandlingcapability.
The4.4 kilometerspanisbrokenintofourpieces.Forclarity, theroutefromBadaPhuharatoRampurChowkisregarded down,whereasthedirectionfromRampurChowktoBada Phuharaisconsideredup.
The cameras positioned in the middle of each of the four sections wereused toconductthe trafficvolumeanalysis. Videography of traffic levels was used to obtain flow data throughoutpeakandoff peakweekdayhours.Slowmotion playback of recordings is used to manually count and categorisevariousautomobilesinthetraffic,whichisatime consumingtask.Accordingtothis,thesection'seveningpeak hourisbetween6and7p.m.,whilethemorningpeakhouris between10and11a.m.
All of the data gathered in the field is aggregated and calculatedtobetterunderstandthevariationsintrafficand vehiclecompositionthroughoutpeakandoff peakhoursin
International Research Journal of Engineering and Technology (IRJET) e ISSN: 2395 0056
Volume: 09 Issue: 07 | July 2022 www.irjet.net p ISSN: 2395 0072
bothdirections.ThedataincludesNumberofVehicles,Trip Time,AverageJourneyTimeandAverageFlowSpeedfor5 MinutesIntervalforbothpeakandoff peakhours.Following arethestepsinvolvedinthestudy:
Fig. 3 Methodology Adopted
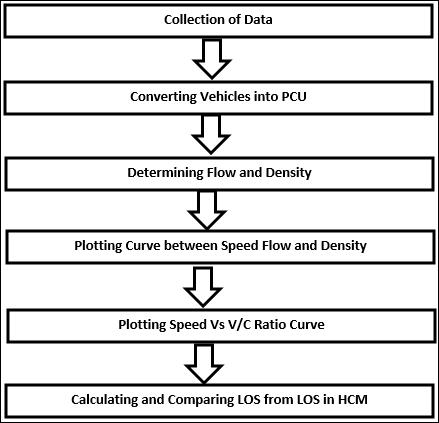
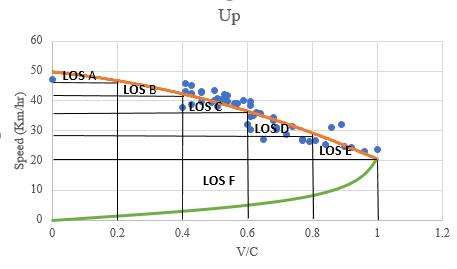
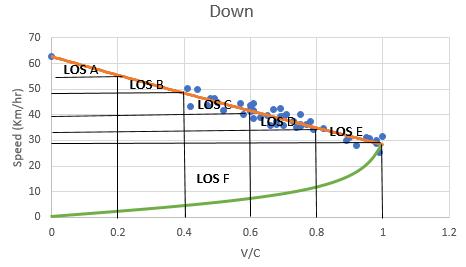
TheGreenshields'Speed Flowrelationshipisintheformofa paraboliccurve.Inthespeedvsflowdomain,thisparabolic curveisemployedasaconceptualrepresentationofLevelof Service.TheHighwayCapacityManualdividestheoperating rangeonthiscurveuptoLOSEintothreelevelsofservice (HCM). The speed flow relationship was used to calculate thelevelofserviceranges,andthethresholdsforeachlevel ofservicewereestablished andcomparedtotheHighway CapacityManual'sstandards(HCM).Foreachsegment,the volumetocapacityratioiscalculated,andgraphsofspeed versus V/C are drawn. For determining level of service ranges,themaximumandlowestseenontheupwardcurve areseparatedintoequalintervals.Thegraphs,whichshow multiple ranges of speed and V/C ratios for defined LOS, were used to define LOS 'A F.' Following are the results obtainedfromthestudyforallthesections:
The capacity of this segment in the up direction is 3654.6 PCU/hr,whilethecapacityinthedowndirectionis3016.2 PCU/hr.
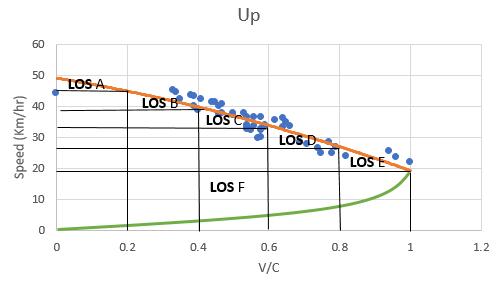
Fig. 4 Revised Los Criteria for Rampur Chowk to Choti Line Square (Up)
Table 1 Speed and V/C Ranges for Rampur Chowk to Choti Line Square (Up)
Level of Service V/C Suggested Speed (Km/hr)
A <0.2 >46 B 0.20 0.40 41 46 C 0.40 0.60 36 41 D 0.60 0.80 29 36 E 0.80 1.00 20 29 F >1 <20
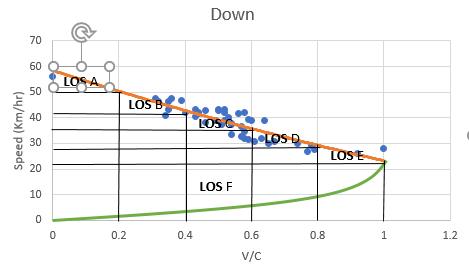
Fig.5 Revised LOS Criteria for Rampur Chowk to Choti Line Square Section (Down)
Factor value: 7.529 | ISO 9001:2008 Certified
International Research Journal of Engineering and Technology (IRJET) e ISSN: 2395 0056
Table 2 Speed and V/C Ranges for Rampur Chowk to Choti Line Square (Down)
Level of Service V/C Suggested Speed (Km/hr)
A <0.2 >55
B 0.20 0.40 49 55 C 0.40 0.60 41 49
D 0.60 0.80 30 41
E 0.80 1.00 23 30 F >1 <23
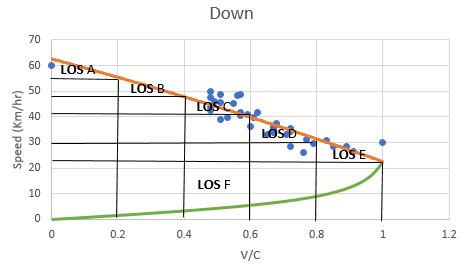
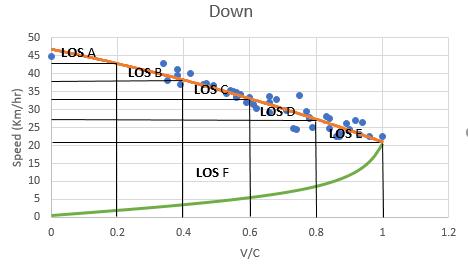
The capacity of this segment in the up direction is 4161 PCU/hr, which is the maximum capacity of this segment during evening peak hours, and the capacity in the down directionis2892PCU/hr.
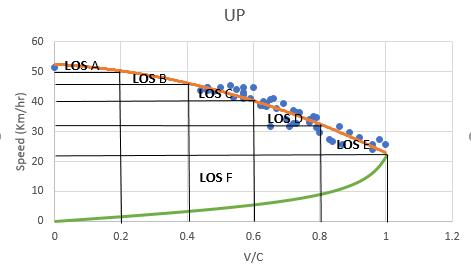
Fig.7 Revised LOS Criteria for Choti line Square to Bloom Chowk Section (Down)
Table 4 Speed and V/C Ranges for Choti line Square to Bloom Chowk (Down)
Level of Service V/C Suggested Speed (Km/hr)
A <0.2 >54
B 0.20 0.40 49 54
C 0.40 0.60 40 49
D 0.60 0.80 32 40
E 0.80 1.00 29 32 F >1 <29
In the evening peak hour, the capacity reached is 3221.4 PCU/hrintheupdirection,and3774.6PCU/hrinthedown direction.
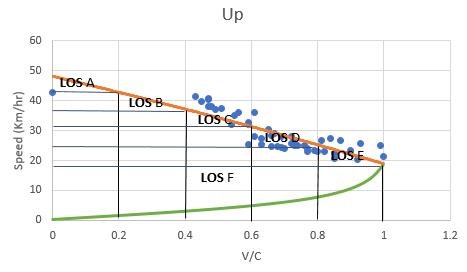
Fig. 6 Revised LOS Criteria for Choti line Square to Bloom Chowk Section (Up)
Table 3- Speed and V/C Ranges for Choti line Square to Bloom Chowk (Up)
Level of Service V/C Suggested Speed (Km/hr)
A <0.2 >46
B 0.20 0.40 38 46
C 0.40 0.60 33 38
D 0.60 0.80 27 33
E 0.80 1.00 19 27
F >1 <19
Fig.8 Revised LOS Criteria for Bloom Chowk to Malviya Chowk Section (Up)
Volume: 09 Issue: 07 | July 2022 www.irjet.net p ISSN: 2395 0072 © 2022, IRJET | Impact Factor value: 7.529 | ISO 9001:2008 Certified Journal | Page85
International Research Journal of Engineering and Technology (IRJET) e ISSN: 2395 0056
Table 5 Speed and V/C Ranges for Choti line Square to Bloom Chowk (Up)
Level of Service V/C Suggested Speed (Km/hr)
A <0.2 >50
B 0.20 0.40 46 50
C 0.40 0.60 40 46
D 0.60 0.80 32 40
E 0.80 1.00 22 32
F >1 <22
Fig. 10 Revised LOS Criteria for Malviya Chowk to Bada Phuhara Section (Up)
Table 7 Speed and V/C Ranges for Malviya Chowk to Bada Phuhara section (Up)
Level of Service V/C Suggested Speed (Km/hr)
A <0.2 >43
B 0.20 0.40 37 43
C 0.40 0.60 31 37
D 0.60 0.80 24 31
Fig.9 Revised LOS Criteria for Bloom Chowk to Malviya Chowk Section (Down)
Table 6 Speed and V/C Ranges for Choti line Square to Bloom Chowk (Down)
Level of Service V/C Suggested Speed (Km/hr)
A <0.2 >50
B 0.20 0.40 41 50
C 0.40 0.60 36 41
D 0.60 0.80 28 36
E 0.80 1.00 22 28
F >1 <22
The capacity obtained in the evening peak hour is 3909 PCU/hr,whichisalsothesecondhighestcapacityobserved inthisfullstretch,whilethecapacityobtainedinthedown directionis3583.2PCU/hr.
E 0.80 1.00 18 24 F >1 <18
Fig. 11 Revised LOS Criteria for Malviya Chowk to Bada Phuhara Section (Down)
Volume: 09 Issue: 07 | July 2022 www.irjet.net p ISSN: 2395 0072 © 2022, IRJET | Impact Factor value: 7.529 | ISO 9001:2008 Certified Journal | Page86
International Research Journal of Engineering and Technology (IRJET) e ISSN: 2395 0056
Volume: 09 Issue: 07 | July 2022 www.irjet.net p ISSN: 2395 0072
Table 8 Speed and V/C Ranges for Malviya Chowk to Bada Phuhara section (Down)
Level of Service V/C Suggested Speed (Km/hr)
A <0.2 >43
B 0.20 0.40 38 43 C 0.40 0.60 33 38 D 0.60 0.80 27 33 E 0.80 1.00 21 27 F >1 <21
6. Conclusion
FollowingaretheConclusionsofthestudy
1. A Speed Flow relationship is constructed for the chosen urban arterial route segment. The curve exhibits a second order polynomial quadratic connection with a very high R square (0.903 0.7203), demonstrating an excellent correlation betweenthemeasuredspeedandflow.
2. The Speed Density Relationship for the chosen sectionisalsodeveloped;ithasalinearshapeanda Rsquarethatfallsbetween(0.8448 0.9384).
3. Two wheelersandautomobiles,whichmakeup68 percent and 24 percent, respectively, of the total volumeofthestream,makeupthemajorityofthe traffic.Thecapacityofthechosencategoryhasbeen significantly impacted by other vehicle classes including3 wheelers,buses,andlightcommercial vehicles.
4. TheChotiLineSquaretoBloomChowksegment(up direction)hasamaximumcapacityof4161PCU/hr atastreamspeedof22.5km/hrduringtheevening peakhourof6to7pm.TheMalviyaChowktoBada Phuharastretchalsooperatesatasimilarcapacity of3909PCU/hrwithastreamspeedof20.2km/hr duringtheeveningpeakhour,givingbothsegments av/cratio>1andplacingthembothunderLOSFin accordancewithIRC106 1990.
5. According to IRC 106 1990, the highest capacity reported at the Malviya Chowk to Bloom Chowk segment (down direction) falls into the LOS F categorywith3774.6PCU/hrandastreamspeedof 23.5km/h.
6. The Choti Line Square to Bloom chowk leg has a densityofaround188.2PCU/km,withtheevening peakhourhavingthemaximumdensity.
7. Thespeedparametersestablishedinthisresearch for LOS A and LOS, which range from 51.5 to 44 kilometres per hour, are lower than those set by HCMforLOSAandLOSB,whichrangefrom59to 46 kilometres per hour. It's also important to remember that the allowed speed range for this urbanarterialrouteisaboutequivalenttotheLOS "CtoF"standards.
1. Patel,C.,Joshi,G.,(2012)“CapacityandLOS for urban arterial road in Indian mixed traffic condition.”TransportResearchArena Europe,48, 527 534.
2. Joseph, E., Nagakumar, M., (2014) “Evaluation of capacity and Level of service of urban road.” InternationalJournalofEmergingTechnologiesand Engineering (IJETE), ISSN: 2348 8050, ICRTIET 2014ConferenceProceeding,85 91.
3. Janwari, M., Tiwari, G., Popil, S., Mir, M., (2014) “Traffic Analysisof Srinagar City.” Transportation ResearchProcedia17(2016),3 15.
4. Gajjar,R.,Mohandas,D.,(2014)“CriticalAssessment ofRoadCapacitiesonUrbanRoads AMumbaiCase Study” Transportation Research Procedia 17 (2016),685 692.
5. Singh,B.,Goyal,T.,(2015)“StudyofTrafficVolume and Level of Service of Panjab University, Chandigarh” Bhavneet Singh Int. Journal of EngineeringResearchandApplications,Volume5, (Issue7),(Part 2),09 14.
6. Biswas,S.,Singh,B.,Saha,A.,(2016)“Assessmentof LevelofServiceonurbanarterials:Acasestudyin Kolkata metropolis.” International Journal for TrafficandTransportEngineering,6(3):303 312.
7. Solanki, M., Umrigar, F., Zala, L., Amin, A., (2016) “Travel time and congestion analysis under heterogeneoustrafficconditionofC.B.D.Areacase study of Surat Rajmarg (Chowk bazar to Delhi Gate).”InternationalJournalofCurrentEngineering andTechnology,volume6,1224 1234.
8. Raval, N., Gundaliya, P., Rajpara, G., (2017) “DevelopmentofModelforEstimatingCapacityof RoadsforHeterogeneousTrafficConditioninUrban Area”InternationalJournalofAdvanceResearchin Engineering,Science&Technology,Volume4(Issue 5),198 206.
9. Koringa,H.,Patel,B.,Solanki,R.,(2017)“Estimation of capacity and level of service for urban arterial
International Research Journal of Engineering and Technology (IRJET) e ISSN: 2395 0056
Volume: 09 Issue: 07 | July 2022 www.irjet.net p ISSN: 2395 0072
road A case study of Rajkot city” International JournalofInnovativeResearchinSciences Volume 6,(issue5),9377 9383.
10. Pravathi, M., Akki, B., (2017) “Classified traffic VolumestudyatGhatkesarjunction”International Journal ofEngineering and Techniques volume 3 (issue6),420 435.
11. Gautam,L.,Jain,J.,(2018)“StudyonMixedTraffic Flow Behaviour on Arterial Road” International Journal of Engineering Research & Technology (IJERT),Volume6(Issue11),1 7.
12. Habib,M.,Mowrin,A.,Ikra,B.,(2018)“International JournalofAdvanceResearchandInnovativeIdeas inEducation”Volume4(Issue3),366 375.
13. Sharma,A.,Raval,N.,(2018)“EstimationofLevelof ServiceforheterogeneoustrafficinUrbanarea A case study for Ahmedabad city.” International Journal of Advance Engineering and Research Development,Volume5,(issue3),1240 1245.
14. IRC(1990).GuidelinesforCapacityofUrbanRoad in Plain Areas. IRC 106(1990), Indian Road Congress.
15. Highway capacity manual (HCM 2000), TransportationResearchBoard,Washington,DC
2022, IRJET | Impact Factor value: 7.529 | ISO 9001:2008 Certified Journal