International Research Journal of Engineering and Technology (IRJET) e-ISSN: 2395-0056

Volume: 09 Issue: 08 | Aug 2022 www.irjet.net p-ISSN: 2395-0072
International Research Journal of Engineering and Technology (IRJET) e-ISSN: 2395-0056
Volume: 09 Issue: 08 | Aug 2022 www.irjet.net p-ISSN: 2395-0072
1 M. Tech Department of Civil Engineering, KLS Gogte Institute of Technology, Belagavi, Karnataka, India.
2 M. Tech Department of Civil Engineering, KLS Gogte Institute of Technology, Belagavi, Karnataka, India.
3 Assistant Professor Department of Civil Engineering, KLS Gogte Institute of Technology, Belagavi, Karnataka, India.
***
Abstract - As more complex earthquake research and design approaches are created it is necessary to accurately predict the cyclic behaviour of RCelements, whichis defined by strength, deformability and energy dissipation capacity. This report describes the experimental results of RC beams under cyclic loading. The main objective of this study is effect of RC beam with same percentageoflongitudinalreinforcement and varying transverse reinforcement. Hysteresiscurve isolatedfor each cycle, relative energy dissipation in successive cycle, variation in relative energy dissipation and variations in secant stiffness of various specimensareplottedandstudied. It is observed that lower stirrup spacing has higher initial stiffness when compared to higher spacing. The relative energy dissipated by the specimens with less stirrup spacing was more.
Key Words: cyclic loading, energy dissipation capacity, hysteresis curves, stiffness degradation, stirrups spacing variation.
The primary purpose of transverse reinforcement in beams is to withstand shear stresses or forces that act perpendicular to the longitudinal direction of reinforced concrete beams. Shear strength is determined by the concrete'sgrade,theamountoftensionsteel,thesizeand spacingofthestirrups,and thecharacteristicsofthesteel usedfortheRCelement.ThequantityofenergylostbyRC elements,oneofthemostimportantvariablestotakeinto account, is a crucial factor in determining earthquake resistance. By enhancing the system's capacity for deformationandcompressivestrength,stirrupsandtiesare two parts that aid in the dissipation of energy. When earthquake loads are applied to a structure, the energy emitted by the loads should be dispersed. The degree of damage to the structure will grow if the capacity of the structuretodisperseenergyisdiminished.Asmorecomplex earthquakeresearchanddesignapproachesarecreated,itis necessary to accurately predict the cyclic behaviour of RC elements,whichisdefinedbystrength,deformability,and energydissipationcapacity.
In the present study, the effect of stirrup spacing of beam on its energy dissipation capacity is studied experimentally. To study this effect the relative energy dissipatedineachsuccessivecycleofloadingisdetermined toestablishthevariationpatterninenergydissipation.Also, the change in secant stiffness in consecutive cycles is obtainedtostudythevariationinstiffnessofbeam.
To study the effect of spacing of transverse reinforcement on the stiffness degradation and energy dissipation capacity of RC beams
Themethodologyemployedinthestudyincludescasting of test specimens to the required specifications and then testingthesespecimensaccordingtoatestingregimeunder adynamicactuator.
RC beam specimens were cast with required specifications using hand-mixed concrete. RC beam specimens were cast with varying spacing of vertical stirrups.Inthesespecimensthepercentageoflongitudinal steeliskeptconstant.(DetailsinTable1)
Table- 1 SpecimenSpecification
International Research Journal of Engineering and Technology (IRJET) e-ISSN: 2395-0056
Effectivespan 800mm 800mm 800mm
Gradeofconcrete M25 M25 M25
Gradeofsteel Fe 500 Fe 500 Fe 500
Transverse reinforcement 6Ø @50mm C/C
Longitudinal reinforcement
3#6Ø= 84.82 mm 2 T&B
6Ø @75mm C/C
3#6Ø= 84.82 mm 2 T&B
6Ø @100mm C/C
3#6Ø= 84.82 mm 2 T&B
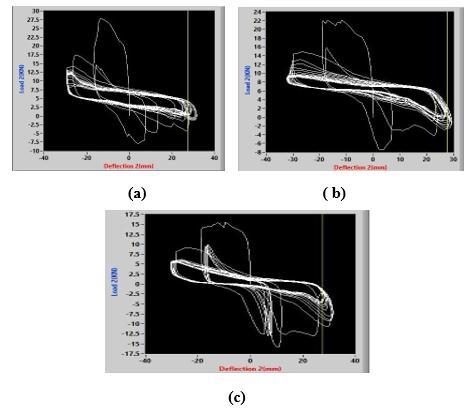
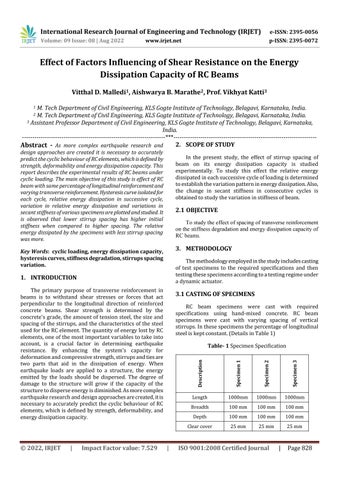
Fig 2. shows the hysteresis curves for the three specimens obtained from thespecimen and theirstiffness degradationinsuccessiveloadingcycles.
Fig. 1.LongitudinalandCrossSectionofSpecimens
Thespecimenswerecuredfor28daysandtestedin adynamicactuator.Eachspecimenwastestedforaspecific levelofmid-pointdisplacement(35mm)undercyclicloading for20cycles.Loadversusdisplacementplotisobtainedfor eachofthespecimenstocomparethehystereticbehavior.
i Dynamic actuator capable of applying horizontal sinusoidalloading.Maximumamplitude100mm;operating frequency range 0-5Hz; max load capacity 100k/N; max velocityofpiston120mm/s.
ii LVDTtomeasuredisplacements.
iii Data acquisition system to record load versus displacementplotsandtoproducethisdatainCSVformat.
Theresultsfromthecyclicloadtestwereobtainedfrom thedataacquisitionsystemintheformofhysteresiscurves (cyclic load versus displacement plot) and the load and displacementdatarecordedatcloselyspacedtimeintervals intabular(CSVformat)form.Thedatainthetabularform was further processed to get insights in the behavior of specimenswithregardstoenergydissipationandstiffness degradation.
Fig. 2. HysteresisCurve:(a)50mmspacing;(b)75mm spacing;(c)100mmspacing
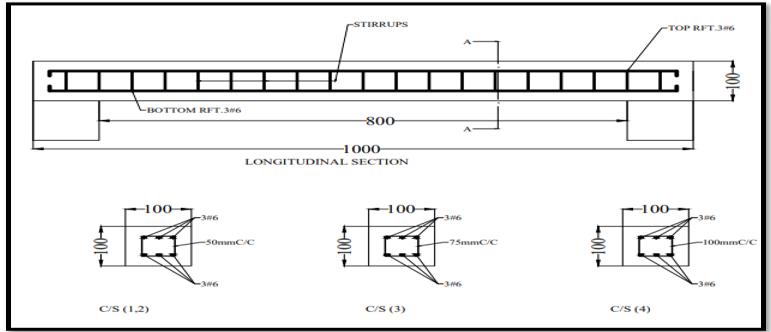
The data in the CSV file is used to develop the hysteresiscurveforonecycleofloadingatatimeusingthe graphtoolinMSExcel.Theseisolatedcycles(cycles1-20) are used to obtain the area enclosed within the loop. This areaisthennormalizedbydividingitbythesmallestareato obtain relative energy dissipated in each cycle of loading. The relative energy dissipation in successive cycles of loading.(Fig.3)
Volume: 09 Issue: 08 | Aug 2022 www.irjet.net p-ISSN: 2395-0072 © 2022, IRJET | Impact Factor value: 7.529 | ISO 9001:2008 Certified Journal | Page829
International Research Journal of Engineering and Technology (IRJET) e-ISSN: 2395-0056
Volume: 09 Issue: 08 | Aug 2022 www.irjet.net p-ISSN: 2395-0072
14 3.75 2.09 2.62
15 3.63 2.07 2.58
16 3.88 2.45 2.94
17 3.78 2.39 2.84 18 2.88 2.05 2.32 19 3.19 2.21 2.45 20 3.55 2.98 2.94
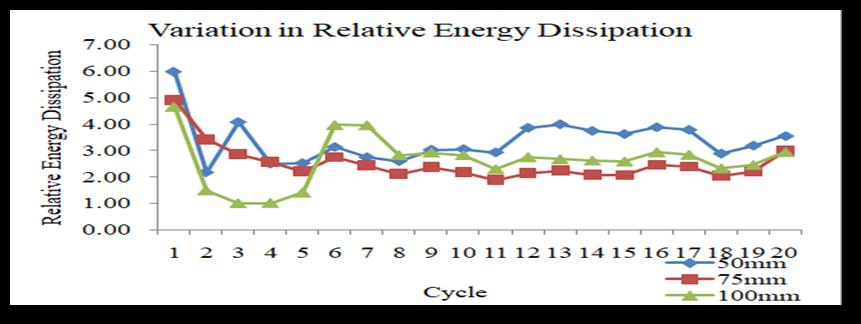
Fig. 4. VariationinRelativeEnergyDissipation
4.3 STIFFNESS DEGRADATION
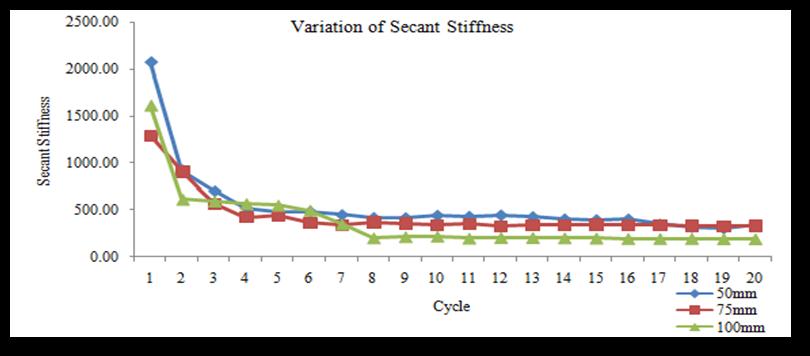
To study the degradation of stiffness of the specimens in every consecutive cycle of loading the peak load in each cycle and the corresponding displacement (Table3)areusedtoobtainsecantstiffnessofthebeamin thatcycleofloading.
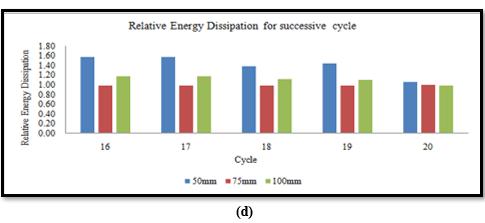
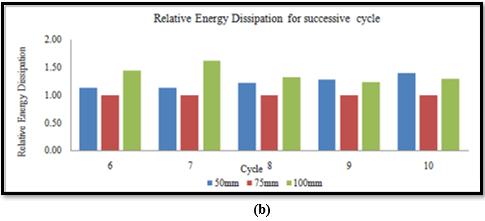
Table- 3 VariationsofSecantStiffness
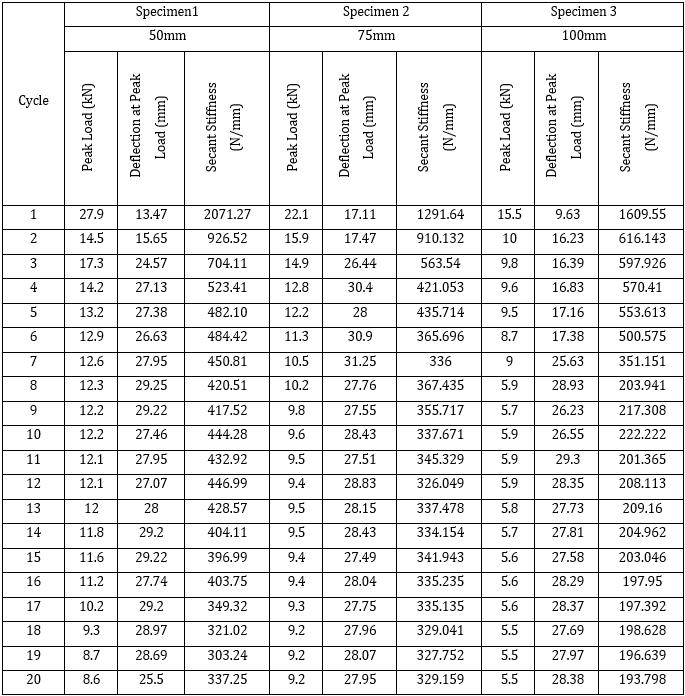
Fig. 3. RelativeEnergyDissipationforCycle:(a)1-5;(b)610;(c)11-15;(d)16-20
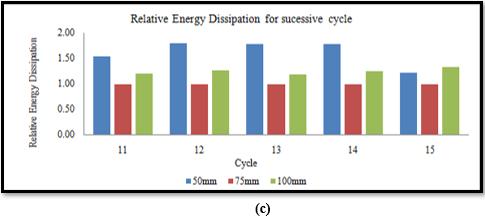
Table-2 VariationinRelativeEnergyDissipation
Cycle Relative Energy Dissipation 50mm 75mm 100mm
1 5.99 4.91 4.66 2 2.17 3.42 1.48 3 4.08 2.86 1.00 4 2.51 2.57 1.01 5 2.52 2.22 1.41 6 3.13 2.75 3.97 7 2.74 2.43 3.96 8 2.60 2.12 2.83 9 3.03 2.37 2.93 10 3.05 2.18 2.83 11 2.93 1.88 2.29 12 3.86 2.15 2.75 13 4.00 2.24 2.67
Cycle
International Research Journal of Engineering and Technology (IRJET) e-ISSN: 2395-0056
Volume: 09 Issue: 08 | Aug 2022 www.irjet.net p-ISSN: 2395-0072
Table- 4 PercentageReductionofSecantStiffness
Specimen1 Specimen2 Specimen3 50mm 75mm 100mm
Secant Stiffness (N/mm)
PercentageReduction Secant Stiffness (N/mm) PercentageReduction Secant Stiffness (N/mm) PercentageReduction
1 2071.27 1291.64 1609.55
2 926.52 55.268 910.132 29.53 616.143 61.71
3 704.11 24.0049 563.54 38.08 597.926 2.95
4 523.41 25.6636 421.053 25.2843 570.41 4.60
5 482.1 7.89247 435.714 -3.482 553.613 2.94
6 484.42 -0.4812 365.696 16.0697 500.575 9.58
7 450.81 6.93819 336 8.12041 351.151 29.85
8 420.51 6.72124 367.435 -9.3557 203.941 41.92
9 417.52 0.71104 355.717 3.18914 217.308 -6.55
10 444.28 -6.4093 337.671 5.07313 222.222 -2.26
11 432.92 2.55695 345.329 -2.2679 201.365 9.38
12 446.99 -3.25 326.049 5.58308 208.113 -3.35
13 428.57 4.1209 337.478 -3.5053 209.16 -0.50
14 404.11 5.70735 334.154 0.98495 204.962 2.00
15 396.99 1.7619 341.943 -2.331 203.046 0.93
16 403.75 -1.7028 335.235 1.96173 197.95 2.50
17 349.32 13.4811 335.135 0.03 197.392 0.28
18 321.02 8.10145 329.041 1.81837 198.628 -0.62
19 303.24 5.5386 327.752 0.39174 196.639 1.00
20 337.25 -11.216 329.159 -0.4293 193.798 1.44
The following conclusion are made from the experimentalworkcarriedouttheextensionofthepresent workthatcanbetakenupinfutureisalsopresented.
i Specimenhavinglowerstirrupspacinghashigherinitial stiffnesswhencomparedtohigherspacing.
ii The relative energy dissipated by the specimens with lessstirrupspacingwasmorecomparedtothespecimen withhigherstirrupspacing.
Specimens having different stirrup spacing with different percentage of longitudinal reinforcement can be castedandtested.
[1] Celebi, Mehmet / Penzein, Joseph, “Behaviour of ReinforcedConcreteBeamsUnderCombinedMomentand ShearReversal”IABSEreportsoftheworkingcommissions BAND13,1973.
[2]Tze-HowHwangandC.F.Scribner,“EffectofVariationin Load History on Cyclic Response of Concrete Flexural Members”TheNationalScienceFoundationResearchgrant NoCME-8006711,September1982.
[3]CharlesK.NmaiDavidDrawin,“CyclicBehaviorofLightly Reinforced Concrete Beams" The National Science FoundationResearchgrantPFR79-24696,June1984.
[4]MagdyS.L.RoufaielandChristianMeyer,Members,ASCE “AnalyticalModelingofHystereticBehaviorofR/CFrames”, JournalofStructuralEngineering,Vol.113,No.3,PaperNo. 21305,March1987.
[5] Andrea Carpinteri, “Energy Dissipation in R.C. Beams underCyclicLoadings”,EngineeringFraerureMechanicsVol. 39,No.2,pp.177-184,1991.
[6] M.N. Fardisand Panagiotakos, “Hysteretic Damping of ReinforcedConcreteElements”11thWorldConferenceon Earthquake Engineering, Elsevier Science Ltd, Paper No.464,1996.
[7]ElMostafaM.HigazyandAmrS.Elnashai,“Energy-based TechniqueforSeismicPerformanceAssessmentofInterior Beam Column Joints.” Journal of Earthquake Engineering, vol.1,no.4,pp.675-692,1997.
Fig. 5. VariationofSecantStiffness
International Research Journal of Engineering and Technology (IRJET) e-ISSN: 2395-0056 Volume: 09 Issue: 08 | Aug 2022 www.irjet.net p-ISSN: 2395-0072
[8] Honggun Park, Taesung Eom, “Energy Dissipation CapacityofReinforcedConcreteMembers”,CouncilonTall BuildingsandUrbanHabitatSeoulConference,2004.
[9] H. Park and T. EOM, “Energy Dissipation Capacity of Flexure-Dominated Reinforced Concrete Members” 13th World Conference on Earthquake Engineering Vancouver, B.C.,Canada,PaperNo.3481,August1-6,2004.
[10] Abdelsamie Elmenshawi, Tom Brown, “Hysteretic Energy and Damping Capacity of Flexural Elements ConstructedwithDifferentConcreteStrengths”,Engineering Structure,pp.297-305,21September2009.
[11]HugoRodrigues,HumbertoVarum,AníbalG.Costa,“A SimplifiedShearModel ForReinforcedConcreteElements Subjected To Reverse Lateral Loadings”, Cent. Eur. J. Eng, pp.136-145,2012.
[12] Feng Wang, Tinghua Yi, “Methodology for Estimating Seismic Hysteretic Energy of Buildings”, Civil Engineering andUrbanPlanning©ASCE,pp.17-21,2012.
[13] Satadru Das Adhikarya; Li, Bing; Fujikake, Kazunori, “Dynamic Behavior of Reinforced Concrete Beams Under Varying Rates of Concentrated Loading”, International journalofimpactEngineering,47,pp.24-38,2012.
[14] Satadru Das Adhikarya, Bing Li, Kazunori Fujikake, “Strength And Behavior In Shear Of Reinforced Concrete DeepBeamsUnderDynamicLoadingConditions”.Nuclear EngineeringandDesign259,pp.14–28,2013.
[15]MohammadaminAzimi,AzlanBinAdnan,MohdHanim Osman,AbdulRahmanBinMohdSam,ImanFaridmehrand Reza Hodjati, “Energy Absorption Capacity of Reinforced ConcreteBeam-columnConnections,withDuctilityClasses Low”, American Journal of Civil Engineering and Architecture,vol.2,no.1,pp.42-52,2014.
[16]AmmarN.Hanoon,M.S.Jaafar,FarzadHejaziandFarah N.A. Abdul Aziz. “Energy Absorption Evaluation of Reinforced Concrete Beams under Various Loading Rates Based on Particle Swarm Optimization Technique”, EngineeringOptimization,vol.49,no.9,pp.1483-1501,2017.
[17] Azad A. Mohammed, Dunyazad K. Assi, and Alan S. Abdulrahman,“BehaviorofConcreteBeamsReinforcedwith Low Ratio of Steel Reinforcement”, Journal of Structural EngineeringVol.45,No.3,pp.240-248,August-September 2018.
[18]AhmedAbdullahMansor,AhlamSaderMohammed,and Wissam D Salman, “Effect of Longitudinal Steel Reinforcement Ratio on Deflection and Ductility in ReinforcedConcreteBeams”IOPConf.Ser.:Mater.Sci.Eng. 888,2020.
[19] Clotilde Chambreuila, Cedric Girya, Frederic RagueneauaandPierreLegerb.“SeismicEnergyDissipation In Reinforced Concrete Beam: Investigating Damping Formulations”EuropeanJournalofEnvironmentalandCivil EngineeringTaylor&FrancisGroup,2021.
[20]YNovitasariandMMAPratama,“EnergyDissipationof GradedConcreteBeamsOnMaximumReinforcementRatio”, IOP Conf. Series: Earth and Environmental Science 847, 2021.
2022, IRJET | Impact Factor value: 7.529 | ISO 9001:2008 Certified Journal |