International Research Journal of Engineering and Technology (IRJET) e ISSN: 2395 0056

Volume: 09 Issue: 08 | Aug 2022 www.irjet.net p ISSN: 2395 0072
International Research Journal of Engineering and Technology (IRJET) e ISSN: 2395 0056
Volume: 09 Issue: 08 | Aug 2022 www.irjet.net p ISSN: 2395 0072
1
Abhishek S. Darwhekar , N.M Mohite21MTech Student, Department of Civil Engineering, College of Engineering Pune, India 411005, 2Assistant Professor, Department of civil engineering, college of engineering Pune, India 411005, ***
Abstract Oneofthe most valuablenatural resources on theplanet,groundwaterisessentialtothecontinuationof human activity. Water shortage has an impact on a region's environmental and developmental activities, however this issue may be partially solved by locating groundwater potential zones and examining the water quality of that region during its useable season, which is frompost monsoontopre monsoon.Thisaidsintheeven distribution of the water demand load to make the best use possible of the local water resources. Due to their abilitytorecognisedifferentgroundfeaturesthatcouldbe utilisedasasignoftheexistenceofgroundwater,GIStools and satellite photos are frequently employed for groundwater investigation. Study and analysis of remote sensing data is a fast and economical way of finding and exploring the ground water resources in study area. Also, thequalitychecksofgroundwaterensureitsusabilityfor variouspurposeduringitsusableperiod.
DEM and Satellite imageries are used for preparing various thematic maps. For getting the groundwater potential zones, each thematic layer was computed statistically. These maps were transformed to raster class data using feature to raster converter tool in ArcGIS. All the raster maps were allocated to a fixed percentage of influenceandweighted.Theprimarygoalofthisstudyisto develop the weightage calculation using the combined theory of FR and Entropy. The generated data were then combined with the various themed maps on the GIS platform. To create a composite groundwater potential zones map, all the thematic maps are combined using the overlay analysis tool in ArcGIS software. This projected groundwater information will be useful for efficiently identifyingsuitable placesfortheprocessofgroundwater extraction.
Keywords: Groundwater, FrequencyRatio,Shannon’s Entropy,Model Formulation,FR Entropy.
One can attempt to make judgments using traditional optimization techniques when the game's rules are clear,
the context in which one operates is predictable, the opposition is known, the actors behave deterministically, costs vary within a small, narrow range, and linear relations are the norm. The idea of optimization for decision makingwillnotbeveryhelpful,though,whenthe rewards of actions are unpredictable and when correlationsbetweenvariablesmaynotonlybenon linear and stochastic but also actually unknown. Exactly this is the circumstance that exists in the modern world.The absolute necessity is strategic, operational, and tactical agility in quickly absorbing a situation and responding withmaximal concentration of effort when needed. In the more organised world of the past, conventional optimization strategies for decision making have somewhat aided at the tactical and operational level in various large scale enterprises. These strategies haven't beenabletohavea biggerimpact,though, atthestrategic level. A decision can be thought of as the selection of one alternative from a group of possibilities based on some premise or criterion. In some situations, it may be essential to basea judgementonmorethan onecriterion. Todeterminetherelative ranking ofthealternativeswith regard to the problem, it is necessary to assess multiple criteria,evaluatealternativesinlightofeachcriterion,and then combine these evaluations. When there are three or more specialists whose perspectives must be considered in the decision making, the issue is exacerbated. Lack of sufficient quantitative data causes a reliance on the expertise, experience, and judgement of qualified people, orexperts.
International Research Journal of Engineering and Technology (IRJET) e ISSN: 2395 0056
Volume: 09 Issue: 08 | Aug 2022 www.irjet.net p ISSN: 2395 0072
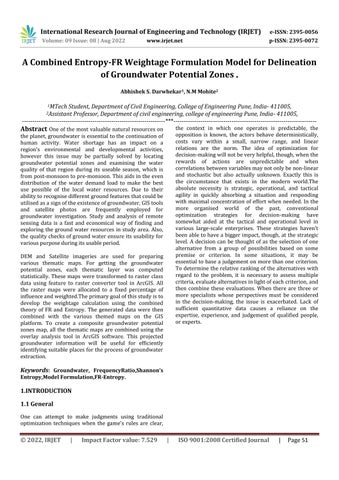
Digital elevation model file is downloaded from Alaska sentimental facility. DEM file is downloaded to create the slope map of study area. According to elevation of study area slope changes as slope changes ground water potentialcontributionalsochangesinPengangaRiversub basin.Digitalelevationmodelfileisshownbelow.
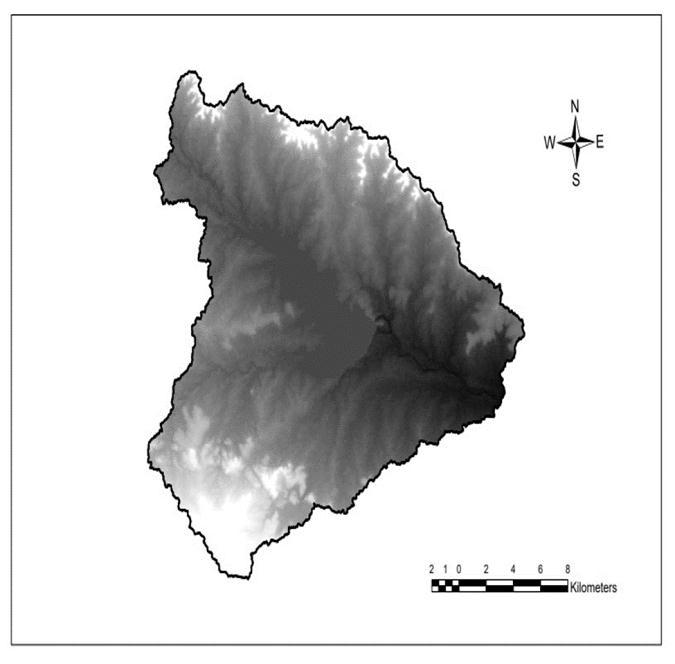
Fig.1 FlowchartforMethodologytobefollowedto IdentifyGroundwaterPotentialZones
The literature on the Entropy and FR technique that researchers have explored is examined in this section. Information theory, which was initially used to evaluate the uncertainty of hydrological models, is the source of information entropy. The results of the studies demonstrate how the entropy information considerably raises the algorithm's robustness and recognition rate. use techniques like the entropy weight approach to analyse the coordinating relationship between economic progress and investment potential. The goal of this study is to choose appropriate suppliers in a green market utilising FR and using entropy weight data to calculate criteriaweights
Theresearchmethodologiesforbuildingmodelsand solving problems were presented based on the aforementionedliteratures.
Table No.1 Datacollectionandsoftwareused
Fig.2 DEMforNumericalExecution.
A well known method for determining the weights for a MADMproblemisShannon’sentropy,particularlywhenit is unable to conduct DM experiments or find an appropriate weight based on preferences. Shannon’ s entropy, a term used to describe a broad measure of uncertainty, plays a significant role in information theory. Entropy is used in transportation modelling to represent thedispersionofjourneysbetweenoriginanddestination. Entropy is a key fundamental concept in physics and refers to how “disorderly” a system is. Also, the entropy associated with an event is”a measure of the degree of randomnessintheevent.Entropyhasalsobeenconcerned as a measure of fuzziness. Entropy in statistical thermodynamics and information theory is comparable. The analogy occurs when the values of the random variable identify the energies of microstates, and as a result, the Gibbs formula for entropy and Shannon’ s formulaareformalequivalents.
German physicist R. Clausius first suggested the idea of entropy in 1865. It is a state parameter of matter and describes the disorder or chaos of a thermodynamic system. Information entropy, a term established by Shannon in 1948, is a measurement of the signal
International Research Journal of Engineering and Technology (IRJET) e ISSN: 2395 0056
Volume: 09 Issue: 08 | Aug 2022 www.irjet.net p ISSN: 2395 0072
uncertainty in information sources.The entropy weight techniqueassessestheabilityofeachevaluationattribute to pass decision information and determines the relative weightamongstattributes.Itprimarilyusesthesizeofthe entropy value in information theory to represent the uncertainty ofthe message. Thejudgement matrixcan be used to derive the entropy weight, which states that "the evaluated information criterion's weight increases with decreasing entropy." This is only accurate if the fundamental presumptions that underlie it are correct. The unique multi criteria decision making approach put outinthisresearchis,ofcourse,noexception.
The entropy weight approach involves calculating the indicator's information entropy and using the indicator's degree of difference to compute the effective informationandindicator weightcontainedintheknown data.Theimportancecoefficientoftheeachindicatorwith in competition under the circumstances of a specific evaluation object and evaluation index when formulating a decision or evaluation plan is indicated by the entropy weight, but it does not indicate the practical importance coefficientoftheindicator.Theseareitsattributes:
a. Themaximumentropyandentropyweightareboth 1, respectively, if all of the elements in a column havethesamevalues.Ifthedataforeachevaluation object for an indicator are the same, the indicator doesnotincludeanyusefulinformation.
b. The entropy value of the elements in a column decreases and the entropy weight increases in proportiontothesizeofthedifferencebetweenthe values of the elements in the column. It suggests that the indicator has important data. On the other hand, if the indicator's entropy value is higher, its entropy weight is lower and it is therefore less significant.
The frequency ratio model is based on the statistical correlation between groundwater occurrence in a region and the sites of productive boreholes, flowing wells, and springs. The ratio of the study area to the area where boreholes were found is known as the FR. Using the followingformula,theFRisdetermined.
b isthepercentageforareawithrespecttoaclassforthe factor
a isthepercentagefortheentiredomain.
Forthepurposeofcalculatingthefrequencyratio,thearea ratiofortheareaoccurrenceandnon occurrenceforeach class or type of factor was computed, as well as the area ratio for each class or type of factor to the total area. Therefore, frequency ratios were derived by dividing the area occurrence ratio by the area ratio to determine the classortypeofeachfactor.Theareaoccurrenceratiowas then divided by the area ratio to determine frequency ratios for each factor type or range. If the ratio is more than1,thereisastrongcorrelationbetweentheareasand the given factor; if it is lower than 1, there is a weak correlation between the flooded areas and each type or range of factors. The ratios were further used for calculatingtheentropy.
Where,
A istheareaofaclassforthegroundwaterfactor;
B isthetotalareaofthefactor;
C isthenumberofpixelsintheclassareaofthefactor;
D isthenumberoftotalpixelsinthestudyarea
3. Numerical Execution Example of Delineation of Groundwater potential zones.
The count values of the study area is calculated with the helpoftabulatedtoolinArcGIS.Thecountvaluesgivesthe area of pixels of the study area which is “b”.The count valuesoftheconditioningfactorviz.Lineament,soilwhich is divided by the pixel sixe of dem which is 12.5m which givesthevalueof“a”.Oncepercentagevaluesoftheareais calculated the FR of the study area is calculated which is furtherusedinthecalculationofweightusingEntropy FR asshowninthefollowingsteps:
Step 1: Two thematic maps viz. slope and rainfall are taken for the calculation.The maps are further divided in equalintervalvaluesinfiveclasses.Thecountvaluesofthe areaarecalculatedinArcGISasshowninthetablebelow
International Research Journal of Engineering and Technology (IRJET) e ISSN: 2395 0056
Ij= ( Hjmax Hj/ Hjmax)
areaof domain(a) areaofclass(b) 1 6347500 689617 40624 2 2780156 534576 17793 3 2036406 737930 13033 4 831719 568627 5323 5 285156 116365 1825
Table No.2 Calculationsforslopemap
Classes Countvalues Percentage areaof domain(a)
Percentage areaofclass(b)
1 2623120 279784 16788 2 2467910 216834 15794 3 2298005 190220 14707 4 2546340 210340 16297 5 2455180 199545 15713
Table No.3 Calculationsforrainfallmap
Step 2: Probablity density is calculated followed by FR calculation.
FR=b/a
Classes Slope Rainfall
1 0.058 0.060 2 0.033 0.072 3 0.017 0.077 4 0.009 0.008 5 0.015 0.078
Table No.3 CalculationsforFR
Step 3:ProbablitydensityiscalculatedfollowedbyFR calculation, Eij = FR / ∑j=1Mj (FR)
Step 4:Entropyiscalculated, Hj = ∑j=1Mj Eij ∗ log(Eij)
Step 5:Maximumentropyiscalculated, Hjmax= − log(Mj)
Step 6:Informationcoefficientiscalculated,
Step 7:Finalachievedweightageiscalculated, Vj= Ij ∗ FR
where Hj and Hjmax are the value of entropy, Ij is the informationcoefficient,Mjisthenumberofclassesineach conditioningfactorandVjistheachievedweightvaluefor thegivenparameter.Therangeisbetween0and1.Values closeto1showgreaterinconsistencyandimbalance.With the help of steps shown above final weightage for each classforeachthematicmapsarecalculatedasshoeninthe tablebelow,
Classes SlopeWeightage RainfallWeightage
1 36.05% 17.53%
2 24.79% 19.52%
3 15.55% 20.86%
4 9.65% 20.94%
5 13.96% 21.15%
Overall Weightage 26.81% 73.19%
Table No.4 Finalweightagecalculated
4. Results and discussion.
Aanalysismustbecarriedoutattheveryendofthemulti criteria evaluation technique to examine how the weights of the alternatives relate to one another. It is possible to derive the entropy FR weight value, which can effectively replace the arbitrary weight value set by decision makers in the conventional technique. Wi = (wi1, wi2,..., wi5) = is theobtainedentropy FRweightforslope(0.3605,0.2479, 0.1555, 0.0965, 0.13.96).This indicates that each criterion has a 36.09 percent, 24.79 percent, 15.55 percent, 9.65 percent, and 13.96 percent individual impact on alternatives. The individual weighting for the slope map and rainfall map for the thematic maps is 26.81 percent and 73.19 percent, respectively. The bias of subjective weights can be reduced and the current situation can be accurately reflected when objective weight (entropy) and subjective weight (FR) are combined. The entropy FR weight is added to the technique, and a model that is weightedaccordingtoentropy FRiscreated.
The aim of this research is to construct an entropy FR weighted model that will evaluate the definition of the groundwater zone from a theoretical and practical perspective.Thisarticleprovidesathoroughandrigorous explanation of how to design an entropy FR weighted strategy. To accomplish the research objectives from the
Volume: 09 Issue: 08 | Aug 2022 www.irjet.net p ISSN: 2395 0072 © 2022, IRJET
Impact Factor value: 7.529 | ISO 9001:2008 Certified Journal
International Research Journal of Engineering and Technology (IRJET) e ISSN: 2395 0056
Volume: 09 Issue: 08 | Aug 2022 www.irjet.net p ISSN: 2395 0072
stated approaches, entropy and FR are applied.The research's findings and particular benefits point to the following:
In place of the weight value chosen arbitrary by decision makers in the other traditional techniques,theentropy FRweightvaluecanbean appropriate replacement. Decision makers can evaluatepotential suppliersmorethoroughlyand scientifically by combining the objective and subjectiveweightsoftheFRandEntropy.
Separate calculations must be made to combine the weights of the various levels of FR and entropy. The total weight value is then calculated by multiplying the weights of all the layers after merging the weights of each layer (entropy fr weight).
Compared to the FR based methodology, this evaluationmodel
's selection output is more consistent, efficient, andreliable.
to create an appropriate MCDM solution by combiningtheFRandentropyweightapproaches. Whendecision makersareconfrontedwithalack of information and a strong subjective consciousness, they should be given useful information.
1) Alcamo, J.; Flörke, M.; Märker, M.: Future long term changes in global water resource driven by soci economicandclimaticchanges.Hydrol.Sci.J. 52(2), 247 275 (2007). doi:10.1623/hysj. 52.2.247
2) Al Abadi, A.M.; AlShammaa, A.: Groundwater potential mapping of the major aquifer in northeasternMissanGovernorate,southofIraqby using analytical hierarchy process and GIS. J. Environ.EarthSci.10,125 149(2014)
3) Al Abadi,A.M.:Groundwaterpotentialmappingat northeasternWasitandMissangovernorates,Iraq usingadata drivenweightsofevidencetechnique in framework of GIS. Environ. Earth Sci. 74(2), 1109 1124 (2015a). doi:10.1007/s12665 015 4097 0
4) Corsini, A.; Cervi, F.; Ronchetti, F.: Weight of evidence and artificial neural networks for potentialgroundwatermapping:anapplicationto
the Mt. Modino area (Northern Apennines, Italy). Geomorphology 111, 79 87 (2009). doi:10.1016/j.geomorph.2008.03.015
5) ConstantinM,BednarikM,JurchescuMC,VlaicuM (2011) Landslide susceptibility assessment using the bivariate statistical analysis and the index of entropy in the Sibiciu Basin (Romania). Environ EarthSci63:397 406
6) Elmahdy SI, Mohamed MM (2014) Probabilistic frequency ratio model for groundwater potential mapping in Al Jaww plain. Arab J Geosci, UAE. doi:10.1007/s12517 014 1327 9
7) https://dsp.imdpune.gov.in/
8) https://nbsslup.icar.gov.in/.
9) Khoshtinat, S., Aminnejad, B., Hassanzadeh, Y., Ahmadi, H., 2019. Groundwater potential assessment of the Sero plain using bivariate models of the frequency ratio, Shannon entropy and evidential belief function. J. Earth Syst. Sci. 128 (6) https:// doi.org/10.1007/s12040 019 1155 0.
10) Patra, S., Mishra, P., Mahapatra, S.C., 2018. Delineation of groundwater potential zone for sustainable development: a case study from Ganga Alluvial Plain covering Hooghly district of India using remote sensing, geographic information system and analytic hierarchy process. J. Cleaner Prod. 172, 2485 2502. https://doi.org/10.1016/j.jclepro.2017.11.161.
11) Rahman, M.A.; Rusteberg, B.; Gogu, R.C.; Lobo Ferreira, J.P.; Sauter, M. A new spatial multi criteriadecisionsupporttoolforsiteselectionfor implementation of managed aquifer recharge. J. Environ.Manag.2012,
12) Shannon, C.E. A mathematical theory of communication. Bell Syst. Tech. J. 1948, 27, 379 423.
13) Yang, Z.; Wan, L.; Dong, Y. Multi Objective Evaluation of Airborne Self Separation Procedure in Flow Corridors Based on TOPSIS and Entropy. Sustainability2020,12,322.
14) Ziadat, F.; Bruggeman, A.; Oweis, T.; Haddad, N.; Mazahreh, S.; Sartawi, W.; Syuof, M. A participatory GIS approach for assessing land suitability for rainwater harvesting in an arid rangeland environment. Arid Land Res. Manag. 2012.