International Research Journal of Engineering and Technology (IRJET) e ISSN: 2395 0056

Volume: 09 Issue: 08 | Aug 2022 www.irjet.net p ISSN: 2395 0072
International Research Journal of Engineering and Technology (IRJET) e ISSN: 2395 0056
Volume: 09 Issue: 08 | Aug 2022 www.irjet.net p ISSN: 2395 0072
Vyomikaa Basani1, Anitha G S2
1Student, Dept. of Electrical and Electronics Engineering, RV College of Engineering, Karnataka, India 2Associate Professor, Dept. of Electrical and Electronics Engineering, RV College of Engineering, Karnataka, India ***
Abstract Popularity of developing an application using microservices architecture is gaining more attention because of smaller and faster deployments, ease of understanding, scalability, Continuous Integration, Continuous Delivery, and improved fault isolation. Though Micro Services bring lots of advantages, it has its own challenges. Teams can easily manage and monitor individual services, but they lose sight of the global system behavior. The objective of this paper is to develop a centralized and continuous health monitoring system for an application built with Micro Services architecture. The proposed system is developed with the help of AWS lambda that is triggered by an API Gateway for every cron schedule. The real time health status of each service of the application is displayed in Kibana in the form of a dashboard. Thisdevelopedsystemkeepsthedevelopersalerted whenever a particular service stops functioning.
Key Words: Microservices, Serverless, AWS lambda, API Gateway, ELK Stack;
Recentdevelopmentsofthecloudlandscapeforapplications suggests there is a shift towards microservisation. The purposeofmicroservicesistouseautonomousunitsthatare isolated from one another and coordinate them into a distributed infrastructure by a lightweight container technology, such as Docker. Though Micro Services/Serverless/Containersbringlotsofadvantages,it has its own challenges. Teams can easily manage and monitorindividualcomponents/services,buttheylosesight of the global system behaviour. Traditional forms of monitoringarenotsuitableformicroservicesbecausethere are multiple services that make up the same functionality that was previously supported by a single application. Consider a scenario when the application fails to function normally,anissuemaybereportedwithatransactionthatis distributed across several microservices, server less functions and teams. It is difficult to differentiate the service/component that is responsible for the issue from those that are affected by it. Monitoring the health of microservicesisanimportantpartofensuringdevelopers are alerted quickly to interruptions in service for mission critical applications. These health checks also provide a meanstokeepAPIwarm,soitisreadytoservicerequestsas quickly as possible. Hence, it is important to establish a different, easy, and effective process of achieving the distributedtracingusinglogcollection,logaggregationand visualization.
The study by C. Pahl and P.Jamshidi wasconducted to discuss the microservices architecture. The details of a microservicearehiddenfromtheothermicroservices.[1]The servicesinteractwitheachotherwithwell definedAPIs.This reducesthenumberofrequestsmadetotheapplication.Each microservicecanbedevelopedwithdifferentprogramming language, and technologies. Microservices embrace the conceptofdecentralizationaseachservicecanbedeployed andmaintainedbydifferentteams.
M.Viggiatoetal.,presentedareviewpaperontheuseof microservicesarchitectureinpractice.Inthemicroservices architecture, the application is composed of many independently deployable and loosely coupled smaller services.[2]Microservicesprovidemanyadvantagessuchas scalability,maintainability,easyandfasterdeployment,and nocommitmenttoasingletechnologystack.Withtheuseof microservices, developers also face challenges such as monitoring of the application, and complex interaction betweentheservices.
According to the survey conducted by J. Ghofrani and D. Lübke,oneofthemainchallengesofbuildinganapplication withmicroservicesarchitectureisthatitsdistributednature makes it difficult to debug the issues. Monitoring of microservices based application requires larger efforts because it requires to go through huge volumes of data. Applicationloggingandtracingallowsoperatorstodebugthe errors.[3]
V. Ivanov and K. Smolander have presented a review paperontheimpactofserverlessonDevOpspractices.From theresearch,theresultsshowthattheserverlessapproach strongly affects various automation practices such as deployment, test execution and monitoring of the application.[4] The use of serverless reduces the infrastructurecostandprovidesautomaticscalability.Italso reduces the time on the maintenance and management of servers.
H. Andi discussed the concept of serverless cloud computing framework, its benefits and usage in IT industry.[5] The analysis suggests serverless cloud computing reduces the execution time, and cost of maintenance,alsoitoffershighsecurity.[6]B.Choudharyet al.,havedevelopedtheserverlesschatapplicationtodiscuss thefunctioningofAmazonWebServices(AWS)lambdaalong
International Research Journal of Engineering and Technology (IRJET) e ISSN: 2395 0056
Volume: 09 Issue: 08 | Aug 2022 www.irjet.net p ISSN: 2395 0072
withotherservices.Thedevelopedmodeldidnotrequireany maintenanceormanagementofserversandthenumberof userscouldbeaugmentedasrequired.
M.Villamizaretal.,inthepaperhavecomparedAmazon WebServiceswithothercloudcomputingservicesbasedon various factors such as cost, performance and response time.[7] The cost per million requests of the architectures implemented with the cloud computing services were comparedanditwasfoundthatAWSlambdacanreducethe cost per scenario up to 77.08% compared to other cloud computingservices.[8] [10]Forthearchitectureoperatedby AWS lambda, the response time was found to be less comparatively. From the research, the results obtained concludesbetterperformancecanbeobtainedatlowercosts withAWSlambda.
The paper by L. Muller et al., focuses on the implementation of a file uploadstreamon AWSlambda to discuss the performance indicators influencing traffic on serverlesscomputing.Fromthestudy,itwasfoundthatthe performance of the lambda function is determined by the overalllatencyintheRound Trip timeandtheirexecution time.Furtheritwasfoundthatthelatencyincreasedwiththe incorporationofothercloudservicesinthelambdafunction such as API gateway. However, a serverless architecture facilitatesquickdeployment,betterscalability,andreduced architecturecosts.[11]
A. V.Zamfiretal.,presentsareviewpaperontheneedfor Elasticsearch system for systems monitoring and big data analysis.[12] The paper focuses on the current state of Elasticsearch, Logstash, and Kibana (ELK) stack and the possibility of extension of the Elasticsearch system with machine learning to automate the elastic technology. The machine learning techniques can help in the root cause analysisandwithfurtheradvancements,itcanalsosuggest thepossiblemitigationstepsbasedonthepastevents.
P. Bavaskar et al., discussed the performance of Elastic stackinloganalysisforbigdataprocessing.Thepurposeof trackingandanalyzingthelogsistofindmalfunctioningofa particularsystem.Fromtheanalysis,itcanbeconcludedthat Elasticsearchisthemostsuitablefordatavisualizationasit provides advanced search capabilities, centralized data processingandaidsinpicturingthelogsintheformofpie charts,graphs,dashboards,etc.[13]
Elasticsearch is based on Lucene search engine that allowsuserstostore,searchandanalyzebigvolumeofdata. ItisbuiltwithRepresentationalStateTransfer(REST)API. AccordingtoA.Neumannetal.,inthepaper,aRESTserviceis a server client model that allows easy API usage.[14] The paperbyO.V.R.NikitaKathareandD.V.Prabhupresentsa comprehensivestudyofElasticsearch.Ithasmanyfeatures suchashighscalability,indexmanagement,fulltextsearch engine,highsecurity,andavailability.Elasticsearchsupports
value:
variousdatatypes,alsooptimizedandaggregationquerying insearchindicesandeventualconsistency.[15]Accordingto D. Kalyani et al., Elasticsearch makes the search process faster because of its use of inverted indices. It also has a failurerecoverymechanismasitsarchitectureisdistributed innature.[16]
M. Mitra and D. Sy documented about the ELK stack. Elasticstack providesa waytoconsolidatestorageoflogs, eventmonitoringandreportgeneration.Basedonthestudy, itisfoundthatelasticstackiswellsuitedfortimeseriesdata asitcanpulleventsusingpluginssuchasElasticsearch,log4j, Kafka,HTTP,JDBC,etc.Kibanaallowsuserstovisualizethe logs, from various sources, in the form of bar graphs, pie chartetc.Italsoallowstheuserstosearchforthekeyword for various requirements such as root cause analysis.[17] Zhao.Jetal.,presentsmanagementofAPIgatewaybasedon Micro Service Architecture. The API gateway provides a means of integrating various microservices and hence simplifies the interaction between client and the application.[18],[19]
Thecentralizedandcontinuoushealthmonitoringsystemis developed using the lambda function provided by the AmazonWebServicesandtheresultsarevisualizedinthe Kibana. Theservicesaremonitoredcontinuouslywiththe helpofcronjobs.
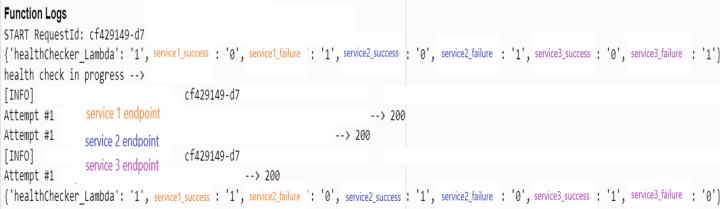
TheimplementationofthesystemisasshowninFig.1.The development of the continuous health monitoring system includesthefollowingsteps:
1. Querying the status of all the components of the applicationbycreatinganAWSlambdafunction.
2. CreationofaCIpipelinetotriggertheAWSlambda functionperiodically.
3. Sendingtheobtainedhealthstatusresultsfromthe lambda function to the ELK stack in the required format.
4. GeneratingareportusingKibanametricsthatgives informationaboutthehealthstatusoftheservices.
International Research Journal of Engineering and Technology (IRJET) e ISSN: 2395 0056
Volume: 09 Issue: 08 | Aug 2022 www.irjet.net p ISSN: 2395 0072
An API Gateway is created that allows the developers to connectnon AWSapplicationstoAWSbackendresources, such as code and servers. REST API is chosen to cache endpoint responses and to gain control over various API managementcapabilitiessuchasper clientratelimitingand APIkeys.TheAPIGatewayisthenaddedasatriggertothe lambda function. A cron job is created in the EventBridge serviceprovidedbyAmazonWebServices.TheAWSlambda istriggeredeveryfiveminutes,sothecronperiodisfivemin. The event bus selected is default and the rule type is schedule.Thelambdafunctionisthenaddedasthetargetto thecreatedcronjob
An AWS lambda function is created to get and query the healthstatus fromtheservicesoftheapplicationwith the help of the microservice endpoints. The required python librariesareimportedtomakeHTTPrequestsandtosend the logs to the ELK stack. An array is initialized with the microservices endpoints. These endpoints are required to make HTTP requests to check the health of a service. For eachservice,theKibanalogsareinitializedintheformofkey valuepairs.Therearetwokeyvaluepairs:onethatlogsthe successcountandtheotherlogsthefailurecount.
The function handler gets executed when the lambda is invoked.ThislambdafunctionisinvokedbytheAPIgateway whichisaddedasatrigger.TheAPIgatewayiscalledbythe CI pipeline and hence the lambda function is triggered periodically. A function check_endpoint is defined that checks the health of a service by taking two arguments, argumentoneistheservicenameandargumenttwoisthe microservice endpoint. If the microservice endpoint is a POST call, it makes a POST HTTP request and returns the response,similarlyifthemicroserviceendpointisaGETcall, itmakesaGETHTTPrequestandreturnstheresponse.
Anotherfunctionsend_logsisdefinedthatsendsthestatus oftheresponseobtainedtoatopicintheELKstackinthe formofkeyvaluepairs.Iftheserviceisfunctioningproperly, the success key is appended with the value 1 and if the serviceisnotfunctioningproperly,thenthefailurekeywill have the value 1. Each time the handler is executed, the Kibana logs are initialized, and the health status of the servicesaresenttotheELKstack.
Fig 1:ProjectDesign Fig 3:SuccessRateofServices
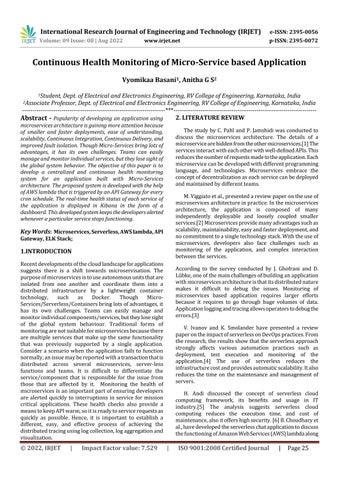
Thelambdafunctionisexecutedeveryfiveminutes.Every timethelambdagetsexecuted;thelogsaresenttotheELK stack.TheoutputobtainedintheAWSconsoleisasshownin Fig. 2. First, the logs in the form of key value pairs are initialized.Thelambdafunctionqueriesthehealthstatusof eachservicebymakingHTTPrequeststothemicroservices endpoints.Thendisplaysthestatusoftheresponseofallthe services. Finally, these key value pairs that contain the informationregardingthehealthstatusoftheservicesofthe applicationaresenttotheKibana.
Fig -2:AWSLambdaFunctionOutput
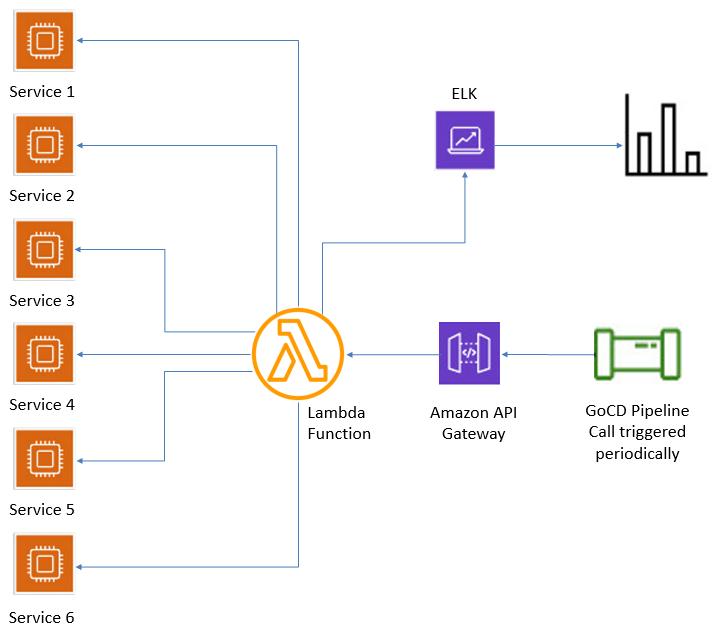
The Kibana Dashboard visualizesthe healthstatus results obtained from the AWS lambda. In the Kibana dashboard, each pie chart shows the success rate of a service of the applicationoveraperiodasshowninFig.3.
International Research Journal of Engineering and Technology (IRJET) e ISSN: 2395 0056
Volume: 09 Issue: 08 | Aug 2022 www.irjet.net p ISSN: 2395 0072
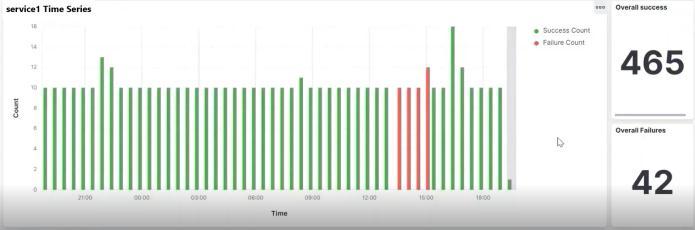
Thekibanadashboardalsohasatimeseriesgraphforeach service.Thetimeseriesgraphforoneoftheservicesisas shown in Fig. 4. The failure count is represented by a red verticalbarandthesuccesscountisrepresentedbyagreen vertical bar. It also displays the overall success rate and overallfailurerate.
[4] V. Ivanov and K. Smolander, “Implementation of a devops pipeline for serverless applications,” in 2018 Lecture notes in Computer Science Book Series, IEEE, Nov.2018.doi:10.1007/978 3 030 03673 7_4.
[5] H.Andi,“Analysisofserverlesscomputingtechniquesin cloudsoftwareframework,”JournalofISMAC,vol.3,pp. 221 234,Aug.2021.doi:10.36548/jismac.2021.3.004.
[6] B. Choudhary, C. Pophale, A. Gutte, A. Dani, and S. Sonawani,“Casestudy:Useofawslambdaforbuildinga serverlesschatapplication,”in.Jan.2020,pp.237 244, isbn: 978 981 15 0789 2. doi: 10.1007/978 981 15 0790 8_24.
Thecontinuoushealthmonitoringsystemdevelopedinthis project provides end to end visibility, faster and easy debuggingofcustomerissuesandautomatedSLAtracking. Withthedevelopedcentralizedhealthmonitoringsystem, the health status of each service of the application can be viewedontheKibanadashboardinrealtime.Italsodisplays theoverallsuccessrateandoverallfailurerate.Thehealth status of each service can also be viewed for a particular time by applying the time filter. The continuous health monitoringsystemkeepsthedevelopersalertedwhenevera particularcomponentstopsfunctioning.
Thedevelopedcentralizedandcontinuoushealthmonitoring system can be applied to other microservices based applications.Thedevelopedcontinuoushealthmonitoring system can be combined with an alerting system so that whenever a particular component stops functioning, notificationscanbesentwiththehelpofAmazonSNS.The health monitoring system can also be combined with distributedtracingtocapturemoregranularmetrics.
[1] M. Viggiato, R. Terra, H. Rocha, M. Valente, and E. Figueiredo,“Microservicesinpractice:Asurveystudy,” Sep.2018
[2] C.Pahl1andP.Jamshidi,“Microservices:ASystematic Mapping Study,” in 2016 International Conference on Cloud Computing and Services Science, vol. 1, pp. 137 146,ISBN:978 989 758 182 3.
[3] J.GhofraniandD.Lübke,“ChallengesofMicroservices Architecture:ASurveyontheStateofthePractice,”in Feb. 2018 10th Central European Workshop on Services and their Composition,vol.2072.
[7] M. Villamizar, O. Garc´es, L. Ochoa, H. Castro, L. Salamanca,M.Verano,R.Casallas,S.Gil,C.Valencia,A. Zambrano,andM.Lang,“Infrastructurecostcomparison of running web applications in the cloud using aws lambdaandmonolithicandmicroservicearchitectures,” in 2016 16th IEEE/ACM International Symposium on Cluster,CloudandGridComputing(CCGrid),2016,pp. 179 182.doi:10.1109/CCGrid.2016.37.
[8] S.Mukherjee, “Benefitsof awsin moderncloud,”Mar. 2019.doi:10.5281/zenodo.2587217.
[9] D.Rajan,“Serverlessarchitecture arevolutionincloud computing,” Dec. 2018, pp. 88 93. doi: 10.1109/ICoAC44903.2018.8939081.
[10] C.Kotas, T.Naughton,and N.Imam,“A comparison of amazon web services and microsoft azure cloud platforms for high performance computing,” in 2018 IEEEInternationalConferenceonConsumerElectronics (ICCE),2018,pp.1 4.doi:10.1109/ICCE.2018.8326349.
[11] L.Muller,C.Chrysoulas,N.Pitropakis,andP.Barclay,“A traffic analysis on serverless computing based on the example of a file upload stream on aws lambda,” Big Data and Cognitive Computing, vol. 4, Dec. 2020. doi: 10.3390/bdcc4040038.
[12] A. V. Zamfir, M. Carabas, C. Carabas, and N. Tapus, “Systems monitoring and big data analysis using the elasticsearch system,” May 2019, pp. 188 193. doi: 10.1109/CSCS.2019.00039.
[13] P.Bavaskar,O.Kemker,A.Sinha,andM.Sabri,“Asurvey on:”loganalysiswithelkstacktool”,”SSRNElectronic Journal,vol.6,pp.965 968,Nov.2019.
[14] A. Neumann, N. Laranjeiro, and J. Bernardino, “An analysis of public rest web service apis,” IEEE TransactionsonServicesComputing,vol.14,pp.957 970,Jul.2021.doi:10.1109/TSC.2018.2847344.
International Research Journal of Engineering and Technology (IRJET) e ISSN: 2395 0056
Volume: 09 Issue: 08 | Aug 2022 www.irjet.net p ISSN: 2395 0072
[15] O. V. R. Nikita Kathare and D. V. Prabhu, “A comprehensive study of elasticsearch,” International Journal of Science and Research (IJSR), vol. 10, Jun. 2021.
[16] D. Kalyani and D. Mehta, “Paper on searching and indexing using elasticsearch,” International Journal of EngineeringandComputerScience,2017.
[17] M.MitraandD.Sy,“Theriseofelasticstack,”Nov.2016. doi:10.13140/RG.2.2.17596.03203.
[18] J.Zhao,S.Jing,andL.Jiang,“Managementofapigateway basedonmicro servicearchitecture,”JournalofPhysics: ConferenceSeries,vol.1087,p.032032,Sep.2018.doi: 10.1088/1742 6596/1087/3/032032.
[19] M. Tomi´c, V. Dimitrieski, M. Vjeˇstica, R. Zupunski, A. Jeremi´c, and H. Kaufmann, “Towards ˇ applying api gateway to support microservice architectures for embeddedsystems,”Mar.2022.
2022, IRJET | Impact Factor value: 7.529 | ISO 9001:2008 Certified Journal