International Research Journal of Engineering and Technology (IRJET) e-ISSN: 2395-0056

Volume: 09 Issue: 07 | July 2022 www.irjet.net p-ISSN: 2395-0072
International Research Journal of Engineering and Technology (IRJET) e-ISSN: 2395-0056
Volume: 09 Issue: 07 | July 2022 www.irjet.net p-ISSN: 2395-0072
Hafeez Ali1, Asha Jose 2
1Student: Department of Civil Engineering Indira Gandhi Institute of Engineering and Technology Kothamangalam, Eranakulam 686691
2Assistant Professor: Department of Civil Engineering Indira Gandhi Institute of Engineering and Technology Kothamangalam, Eranakulam 686691 ***
Infrastructure is an important sector which contributes to the growth of overall development of the nation. Recently, Public Private Partnerships (PPP) has become the key factor to facilitate this development. Due to long concession periods and large investments, the risk management plays a crucial role in these types of projects.
This thesis deals with the risk quantification and risk allocation of PPP projects using a fuzzy based questionnaire survey. Fuzzy logic can express and handle vague or imprecise judgments mathematically and therefore can effectively deal with errors due to human subjectivity. 20 risk factors in PPP projects are summarized from a comprehensive literature review. Interdependencies among the main risk factors affecting PPP projects are assessed using fuzzy Decision Making Trial and Evaluation Laboratory (DEMATEL) approach. Sub risk factors are prioritized using a fuzzy hybrid method involving fuzzy Failure Mode and Effect Analysis (FMEA) and fuzzy Analytic Hierarchy Process (AHP) method. The obtained results have shown that approvals and permits, construction cost overrun, construction time overrun and land acquisition risks are the key risks affecting PPP projects.
Key Words: Public Private Partnership Projects; Risk Management; Fuzzy Logic; Failure Mode and Effect Analysis; Decision Making Trial and Evaluation Laboratory; Analytic Network Process.
PPP is contractual partnership between the public and private sector agencies, specifically targeted towards financing, designing,implementingandoperatinginfrastructurefacilitiesandservices.Moreover,PPPcontributestobetterqualityand performance of infrastructure projects. Though PPP projects provide a good return in investment, risk involved in such projects is verysignificant.The risks need to be thoroughlyanalyzed, researched and managed to minimize disputes and costs and maximize the value for money. Risk management involves riskplanning, risk identification, qualitative risk analysis, quantitative risk analysis, risk response planning, risk monitoring and control. Quantitative analysis of risks in PPPprojectsprovidesaveryclearpictureonthemostprominentriskgroups.Thisstudyusesafuzzybasedriskassessment approachtoquantifyrisksoccurringinPPPprojects.Aquestionnairesurveywasconductedamongprofessionalsworkingin PPPprojectsandresponsesof24expertsareusedfortheanalysis.
When making decisions in a fuzzy environment, the result of decision-making is highly affected by subjective judgments that are vague and imprecise. To solve this kind of imprecision problem, fuzzy set theory was first introduced by L. A. Zadeh (1965) as a mathematical way to represent and handle vagueness in decision-making.The concepts of fuzzy set theory are essential to accounting for the uncertainty and fuzziness of realistic environments. Research subjects are allocatedavaluebetween0and1toindicatetheirfuzzydegree.People’ssubjectivejudgmentsareconvertedintonumbers Inparticular,totackletheambiguitiesinvolvedintheprocessoflinguisticestimation,itisabeneficialwaytoconvertthese linguistictermsintofuzzynumbers.Alinguisticvariableisavariablewhosevalueshavetheformofphrasesorsentences in a natural language. Especially, linguistic variables are used as variables whose values are not numbers but linguistic terms. The linguistic term approach is a convenient way for decision makers to express their assessments. For dealing withtheambiguitiesofhumanassessments,thelinguisticvariable‘‘influence’’isusedwithdifferentlinguistictermslikevery high,high,lowetc.eachofwhichareexpressedinfuzzynumbers.AfuzzyhybridmethodinvolvingfuzzyFailureModeand
International Research Journal of Engineering and Technology (IRJET) e ISSN: 2395 0056
Volume: 09 Issue: 07 | July 2022 www.irjet.net p ISSN: 2395 0072
Effect Analysis (FMEA), fuzzy Decision Making Trial and Evaluation Laboratory (DEMATEL) and fuzzy Analytic Hierarchy Process(AHP)isemployedforthepurpose.
DEMATEL, originally developed by the Science and Human Affairs Program of the Battelle Memorial Institute of Geneva between 1972 and 1976, is used for researching and solving the complicated and intertwined problem group. DEMATEL method allows to explore interrelationships between factors and to develop a cause effect diagram. The main advantage of fuzzyintegratedDEMATEListoconsiderfuzzinessinvolvedinhumandecisionmaking.FuzzyDEMATELisusedinthisstudyto findtheinterdependenciesbetweenthemainriskgroupssuchasfinancialrisks,legalrisks,politicalrisksetc.
AHP is a widely used multi criteria decision making tool originally developed by Prof. Thomas L. Saaty. AHP uses pair wise comparisonswhichallowverbaljudgmentsandenhancestheprecisionoftheresults.Itissuitableto usefuzzyAHPtoassess the risks of PPP projects, which will encounter many uncertainties during the long concession contract period and have multipleobjectivesoriginatingfromprojectstakeholders(LiandZou,2011).
Failure Mode and Effect Analysis (FMEA) is a tool for identifying potential modes of failure in asystem, evaluating the main causes,determining the impactof failuresand formulatingpreventivemeasures(Mohammadiand Tavakolan,2013).In this system, a Risk Priority Number(RPN) for each risk is calculated as the product of the probability of risk occurrence (O), severity(S)anddetection(D).IntraditionalFMEA,therelativeimportanceofO,SandDisnottakenintoaccountandRPNvalue maynottrulyrepresenttheactualscenario.FuzzyFMEAisusedtoovercomethesedrawbacks.ResultsofbothfuzzyFMEAand fuzzyAHPtechniquearetakentoranktheriskfactors.
The research methodology adopted is demonstrated in Fig. 1 and is based on a comprehensive literature review, and comprehensivequestionnairesurveyfordatacollection.
IdentifyriskfactorsinPPPprojectsthrough literaturesurvey
Developariskbreakdownstructure
QuestionnairesurveybasedonfuzzyDEMATEL processtodeterminetheinterdependencies betweenthemainriskfactors
QuestionnairesurveybasedonfuzzyFMEAand fuzzyAHPmethodstorankthesubrisks
Fig.-1: ResearchMethodology
International Research Journal of Engineering and Technology (IRJET) e ISSN: 2395 0056
Volume: 09 Issue: 07 | July 2022 www.irjet.net p ISSN: 2395 0072
Themainrisk factors andsubrisk factors undereach mainrisk inPPPprojects identified werethrough literature survey Thosefactorsthathavebeenrepeatedlyidentifiedintheliteratureascriticalwereonlytakenupforfurtheranalysis.5projects aretakento correlatetheresultsoftheliteraturereviewwiththeactualscenarioinIndia.The projects were taken from Public Private Partnership Projects in India: Compendium of Case Studies. The case studies provided a representation acrossvariouslocationsandvarioustypesofPPPprojects.TheriskbreakdownstructureformedisgiveninFig.2.
Legal Financial
Constru ction Economic Political
Availab ility of finance
Concess ionaire event of default
Revenue risks
Operation
Approvals & permits
Change in marketdemand
Change in law
Govern ment’s reliability Landacquisi tion risks
Contractu al risks
Change in tax regulation
Constru ction time delay
Construction cost overrun
Inflation rate volatility
Interest rate volatility
Operation cost overruns
Natural Mainte nancerisks
Force Majeure
Design Changes
External linkages
Technology risk
Fig. 2:RiskBreakdownStructure
DEMATEL isappliedtodetermine effectandcausecriteria,andto obtainthemodel intermsoflinguistics parameterized with fuzzy numbers. Fuzzy DEMATEL method can be applied to problems that require group decision making in a fuzzy environment.TheprocedureforfuzzyDEMATELanalysistofindthecauseandeffectrelationshipbetweenthemainfactors isgivenbelow(Tzeng et al.,2007andLuthra et al.,2016).
2022, IRJET | Impact Factor value: 7.529 | ISO 9001:2008 Certified Journal | Page341
International Research Journal of Engineering and Technology (IRJET)
e ISSN: 2395 0056
Volume: 09 Issue: 07 | July 2022 www.irjet.net p ISSN: 2395 0072
Step 1: Respondentsareaskedtoindicatethedirectinfluencethattheybelieveeachmainriskfactorexertson eachofthe othersaccordingtoanintegerscaleranging0 4andthentheresponsesareenteredintoamatrixasfuzzynumbers.
Step 2: Defuzzify the TFNs in the matrices into crisp scores (center of area method) to obtain defuzzified DEMATEL responsematrix.
Step 3: Compute the average matrix,X from all 24 responses Each element of this average matrix will be in this case the meanofthesameelementsinthedifferentdefuzzifiedresponsematricesoftherespondents.
Step 4: Calculatetheinitialdirectrelationmatrix.Theinitial directrelationmatrix,Ncanbeobtainedby normalizingthe average matrix X. The initial influence which an element exerts and receives from another canbe read from matrix N. MatrixNportraystheinterrelationshipsamongtheelements.
Step 5: Calculatethedirect/indirectrelationmatrixT,whichisalsocalledthetotalrelationmatrix.Acontinuous decrease oftheindirecteffectsofproblemsalongthepowersofthematrixN(N2,N3,...,N∞)guaranteesconvergentsolutionsto matrixinversion. �� = lim(��+��2 +⋯+����) = (1 ��) 1 (1)
Step 6: Calculatethesumofthevaluesineachcolumnandeachrow.Thisstepentailssummingthevaluesofeach column androwinthetotalrelationmatrix,where Di isthesumofthe ithrowand Rj is the sum of the jthcolumn.
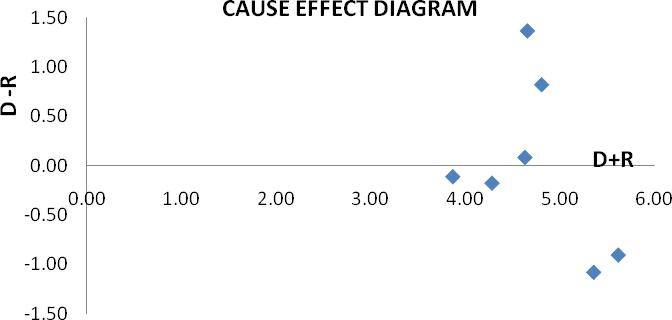
Step 7: Let i=j;Di = D and Ri = R. A causal diagram can be acquired by mapping the datasetof (D + R, D R), where the horizontalaxis(D+R)ismadebyaddingDtoR,andtheverticalaxis(D R)ismadebysubtractingDfromR.Inthisstep,(D +R)isdefinedasprominenceand(D R)isdefinedasrelation.‘‘Prominence’’showshowimportantthecriterionis,whereas ‘‘Relation’’maydividethecriteriaintothecauseandeffectgroups.Whenthevalue(D R)ispositive,thecriterionbelongsto thecausegroup.Ifthevalue(D R)isnegative,thecriterionbelongstotheeffectgroup.ProminenceandRelationvaluesare providedinTable5.7.
Table 1: ProminenceandRelationValues
Factors
FinancialRisks 2.356 3.259 5.615 0.903 LegalRisks 1.879 1.990 3.869 0.111 PoliticalRisks 3.010 1.646 4.656 1.364 EconomicRisks 2.813 1.993 4.806 0.820 Construction Risks 2.139 3.217 5.356 1.078
Operation Risks 2.053 2.229 4.282 0.176 NaturalRisks 2.357 2.273 4.630 0.084
Aswemovealongthehorizontalaxisofthecauseeffectdiagramtheprominenceofthefactorsincreases.From thecausal diagram(Fig5.2),itcanbeinferredthatfinancialrisksarethemostprominentriskgroupcloselyfollowed by construction risks. The horizontal axis separates thecausegrouprisksandeffectgrouprisks.Fig.
5.2 reveals that political risks, economic risks and natural risks are the cause group risks and financial risks, legalrisks, construction risks and operation risks are the effect group risks. The cause group risks trigger the other risks. Political risksarethemajorcausegrouprisksandhencepoliticalrisksshouldbegivendueconsiderationsintheriskmanagement process. Constructionrisksandpoliticalrisksareeasilyaffectedbyotherrisks.
International Research Journal of Engineering and Technology (IRJET) e ISSN: 2395 0056
Volume: 09 Issue: 07 | July 2022 www.irjet.net p ISSN: 2395 0072
PoliticalRisks Chart 1:CauseEffectDiagram
AfuzzyhybridmethodinvolvingFuzzyFMEAandFuzzyAHP(FAHP)methodswasadoptedtoprioritizesubriskfactorsin PPPprojects.FMEAtakesintoconsiderationtheseverity,frequencyofoccurrenceandlikelihoodofdetectionofaparticular riskfactorwhileAHPexplorestherelativeimportanceoftheriskfactors.Theintegrationoffuzzytheorywillhelptoreduce errorsduetohumansubjectivity.Theweightsobtainedbytwomethod,fuzzyFMEAandFAHP,aremultipliedtoarriveata finalweightforeachriskfactor.
In FailureModeand Effect Analysis (FMEA) a Risk Priority Number(RPN) for each risk is calculated as the product of the probabilityofriskoccurrence(O),severity(S)anddetection(D).TheOratingreferstothefrequencyoftheoccurrenceofa particularriskfactor.TheSratingisusedtorepresentthepotentialeffectsassociatedwiththe occurrenceofariskfactor. Dratingconsidersthelikelihoodofdetectionofaparticularriskfactor.TheRPNrepresentsthelevelofaparticularrisk,i.e. ahighervalueofRPNmeanshigherlevelofriskFMEAintegratedwithfuzzytheoryallowsriskprioritizationtobehandled moreefficiently.
Extremely significant effect (4, 5, 6)
Very significant effect (3, 4, 5)
Significant effect (2, 3, 4) Slight effect (1, 2, 3)
No effect (1, 1, 2)
Extremely significant effect (4, 5, 6) Very significant effect (3, 4, 5)
Significant effect (2, 3, 4) Slight effect (1, 2, 3)
No effect (1, 1, 2)
Veryhigh (4, 5, 6)
High (3, 4, 5)
Medium (2, 3, 4)
Low (1, 2, 3)
Very low (1, 1, 2)
International Research Journal of Engineering and Technology (IRJET) e ISSN: 2395 0056
TheFuzzyFMEAprocedureemployedforthepresentstudyisprovidedbelow(NazeriandNaderikia,2017).
Step 1:AfuzzylinguisticscaleisadoptedfromNazeriandNaderikia,2017andprovidedinTable 2isselected,and respondentsareaskedtorateO,SandDaccordingtoit.
Step 2:Themeanresponsesarefoundbytakingtheaverageofthefuzzyratingsfromthe24respondents.
Step 3:ThemeanresponseinTFNformisdefuzzifiedintocrispscorebycenterofareamethod.
Step 4:TheRiskPriorityNumber(RPN)isfoundby,RPN=O⊗S⊗D.TheRPNgivestheFMEAweightsofeachrisk.
Table 3: SampleFRPNCalculationforRiskFactor“RevenueRisks”
Parameter
FRPN
Occurrence (3.13,4.04,5.04) 4.07 FRPN=4.07×4.09×3.25=54.100 Severity (3.09,4.09,5.09) 4.09
Detection (2.40,3.18,4.18) 3.25
Similarly,FRPNvaluesforallsubrisksarecalculatedandlistedinTable4.
Table 4: FuzzyRPNValues
Sub Risk Factors
FRPN
Designchanges 78.001
Sub RiskFactors
FRPN
Changeinlaw 36.452
Landacquisitionrisks 72.560 ForceMajeure 32.541
Availabilityoffinance 71.624 Interestratevolatility 29.108
Constructiontimedelay 69.231 Operationcostoverruns 28.462
Approvalsandpermits 64.142 Technologyrisk 26.144 Revenuerisk 54.112 Maintenancerisks 19.313
Contractualrisks 53.451 Inflationratevolatility 19.142 Changeinmarketdemands 48.674 Government’sreliability 17.251
Concessionaireeventofdefault 48.213 Changeintaxregulation 15.464 Constructioncostoverruns 39.13 Externallinkages 10.254
Volume: 09 Issue: 07 | July 2022 www.irjet.net p ISSN: 2395 0072 © 2022, IRJET | Impact Factor value: 7.529 | ISO 9001:2008 Certified Journal | Page344
International Research Journal of Engineering and Technology (IRJET) e ISSN: 2395 0056
Volume: 09 Issue: 07 | July 2022 www.irjet.net p ISSN: 2395 0072
The risks are listed in Table 4 according to their priority order from the FMEA results. Design changes, Land acquisition risks,availabilityoffinance, construction timedelayandapprovalsandpermits arethemajor risk accordingtothe results obtained fromfuzzy FMEAanalysis.Changeintax regulationand external linkagesare theleastimportantones. TheFRPN valuesaremultipliedbyFAHPweightstoobtainthefinalweightsofeachsubfactor.
Developed by T. L. Saaty in 1970, and refined continuously to date, the AHP breaks down the main problem into more comprehensiblesub problems.TheAHPmodel isa treediagram, whichinitssimplestform,consists ofa goal atthetop,a setofalternatesfor reachingthe goal at the lowestlevel,anda set of criteria connectingthe alternatestothegoal.Forthe presentstudy,projectsuccessisthegoal.Thesetofriskfactorsaretakenasthesetofcriteriaformingthelastlevel.
If uncertainty (fuzziness) of human decision making is not taken into account in an AHP problem, the results can be misleading. FAHP overcomes the inability of AHP to deal with human subjectiveness in the pair wise comparison process. Insteadofasinglevalue,theFAHPgeneratesarangeofvaluestoincorporatethedecision makersuncertainty.
The steps employed to find the FAHP weights of risk factors are found from the procedure described below (Li and Zou, 2011;Ayhan,2013).
Step 1:Theresultsofallthepairwisecomparisonsareenteredintoamatrixasfuzzynumbersaccordingtoalinguisticscale
Step 2: Preferences of each respondent are averaged and is calculated to form a pair wise comparison matrix (which is averageofall24responses)
Step 3:ThelocalweightsofsubriskfactorsarefoundusingEq.2. �������� �� ��= 1
���� ���� �� ��= 1
Step 4:TheweightsofthemainriskfactorsarefoundbyemployingEq.3. �������� �� ��= 1
���� ���� (2) ���� isthe ith rowand jth columnfuzzyelementofupdatedsubriskpairwisecomparisonmatrixand������ isthe ���� �� local fuzzyweightofsubrisk factorinith rowofsubriskcomparisonmatrix
= ∑ �� ⊗ ∑ ∑ �� = ∑ �� ⊗ ∑ ∑ ��
�� ��= 1
���� ���� �� ��= 1
�� ��= 1
���� ���� (3) ���� isthe ith rowandjth columnfuzzyelementofmainriskpair wisecomparisonmatrixand������ isthe fuzzy ���� �� weight of main risk factor in ith row of main risk pair wise comparisonmatrix.Thecalculationsaresimilartothatof calculationstofindtheweightsofsubriskfactors
Step 5:TheglobalweightsofeachsubriskfactorisfoundbythefollowingEq.4 ��SR�� = ������ ⊗ �������� (4) ��SR�� is the global fuzzy weight of sub risk factor in ith row of sub risk pair wise comparisonmatrix
Step 6: �� ������is defuzzified into a crisp score using centreof area method FAHPweightsforthesubrisksareprovided inTable5.
2022, IRJET | Impact Factor value: 7.529 | ISO 9001:2008 Certified Journal | Page345
International Research Journal of Engineering and Technology (IRJET) e ISSN: 2395 0056
Table-5: FAHPWeightsofSubRiskFactors
Main Risk Factors Weights, ��������
Financial Risks (0.10,0.23, 0.58)
LegalRisks (0.05,0.10, 0.27)
Political Risks (0.01,0.02,0.05)
Economic Risks (0.20,0.26,0.55)
Sub Risk Factors Local Weights, �������� Global weights, �������� FAHP Weight Crisp Score
Availabilityof finance (0.36,0.63,1.17) (0.04,0.15,0.67) 0.286
Revenuerisk (0.03,0.05,0.09) (0.00,0.01,0.05) 0.020 Concessionaire eventofdefault (0.12,0.24,0.50) (0.01,0.05,0.29) 0.116
Approvalsand permits (0.33,1.65,1.89) (0.01,0.16,0.51) 0.226
Landacquisition risks (0.68,0.95,1.08) (0.05,0.09,0.18) 0.106
Contractualrisks (0.35,0.36,0.58) (0.03,0.03,0.16) 0.073
Government’s reliability (0.17,0.57,0.79) (0.00,0.01,0.03) 0.013
Changeinlaw (0.06,0.51,0.83) (0.00,0.01,0.04) 0.016
Changein marketdemands (0.09,0.08,0.32) (0.01,0.02,0.17) 0.067
Changeintax regulation (0.24,0.51,0.73) (0.02,0.13,0.40) 0.183
Inflationrate volatility (0.02,0.05,0.09) (0.00,0.01,0.04) 0.016
Interestrate volatility (0.08,0.09,0.20) (0.02,0.02,0.11) 0.050
Constructiontime delay (0.32,1.56,1.89) (0.02,0.29,0.83) 0.380
Construction Risks (0.08,0.19,0.44)
Operation Risks (0.06,0.14,0.31)
Construction costoverruns (1.00,1.82,1.98) (0.08,0.32,0.87) 0.423
Designchanges (0.52,0.75,0.91) (0.04,0.14,0.40) 0.193 External linkages (0.09,0.10,0.14) (0.00,0.01,0.06) 0.030
Technologyrisk (0.08,0.09,1.01) (0.00,0.01,0.44) 0.150
Operationcost overruns (1.04,1.16,1.87) (0.06,0.16,0.57) 0.263
Maintenancerisks (0.34,0.55,0.67) (0.02,0.07,0.20) 0.096 Natura lRisks (0.01,0.02, 0.06) ForceMajeure (0.16,1.29,1.55) (0.00,0.02,0.09) 0.036
Volume: 09 Issue: 07 | July 2022 www.irjet.net p ISSN: 2395 0072 © 2022, IRJET | Impact Factor value: 7.529 | ISO 9001:2008 Certified Journal | Page346
The final weights of the sub risk factors are calculated as the product of FAHP weights andFRPNvalues.Theresults areprovidedinTable 6.International Research Journal of Engineering and Technology (IRJET)
e ISSN: 2395 0056
Volume: 09 Issue: 07 | July 2022 www.irjet.net p ISSN: 2395 0072
Table-6: RankingofSubRiskFactors
Sub Risk Factors
FRPN FAHP Weight Final Weight Rank
Approvalsandpermits 64.142 0.401 25.720 1
Constructiontimedelay 69.231 0.356 24.646 2
Availabilityoffinance 71.624 0.264 18.908 3
Constructioncostoverruns 39.139 0.468 18.317 4
Landacquisitionrisks 72.560 0.173 12.552 5 Designchanges 78.001 0.153 11.934 6
Concessionaireeventofdefault 48.213 0.189 9.112 7
Changeinmarketdemands 48.674 0.096 4.672 8
Operationcostoverruns 28.462 0.164 4.667 9 Technologyrisk 26.144 0.178 4.653 10 Contractualrisks 53.451 0.054 2.886 11 Revenuerisk 54.112 0.042 2.272 12
ForceMajeure 32.541 0.068 2.212 13
Changeintaxregulation 15.464 0.113 1.747 14
Interestratevolatility 29.108 0.058 1.688 15
Maintenancerisks 19.313 0.069 1.332 16 Changeinlaw 36.452 0.014 0.510 17
Government’sreliability 17.251 0.021 0.362 18 Externallinkages 10.254 0.022 0.225 19
From the fuzzy AHP and fuzzy FMEA analysis, the top risk factors obtained are approvals and permits, constructiontime delay,andavailabilityoffinance,constructioncostoverrunsandlandacquisitionrisks.Thesesubrisksshouldbegiventop priority while formulating a risk management strategy. Most of the PPP projects are delayed because of delays in getting timelyapprovalsandpermits.Theconcessionairewillfinditdifficultto executetheworkwithintheplannedscheduleand this may even result in cost overruns. In most cases, it is not within the concessionaire’s powers to avoid such risks. However,riskssuchasconstructiontimedelaysandcostoverruns can be avoided by proper planning for budget and cost.Risksdue tounavailabilityoffinanceoccur whenthereisan absence of a well organizedfinancial framework. Thereshouldbeprovisionsforalternatelenderssothatthereisacontinuousflowoffinanceasandwhenrequired.Delays in obtaining land have created significant problems and even have lead to the discontinuation of many promising PPP project proposals.InsomecasesthegovernmentfreeuplandbeforelaunchingaPPPprojectsorin othercasestheprivate sector is responsible for land acquisition. The land owners should be fairly compensated so there is no further resource consuminglegalproceedings.
2022, IRJET | Impact Factor value: 7.529 | ISO 9001:2008 Certified Journal | Page347
International Research Journal of Engineering and Technology (IRJET) e ISSN: 2395 0056
Volume: 09 Issue: 07 | July 2022 www.irjet.net p ISSN: 2395 0072
Three case study projects in Kerala were considered for the validation of the study. The major risks that occurredin Thiruvananthapuram City Road Improvement Project, Iruttukanam Small Hydro Electric Project and Thavakkara Bus Terminal Project are compared with the top ranked risks. The major risks that occurred in the abovethreeprojects are comparedwiththetoprisksobtainedfromthepresentstudy.Landacquisitionisamajorriskinallthreeoftheprojectswhile approvals and permits is a major issue in two of the projects. The rest of the top risks namely availability of finance, construction time delay and construction cost overrun occurs in at least one of the three projects taken. Thus, the major risksthatoccurredinthecasestudyprojectstakencorrelateswiththeresultsobtainedfromthepresentstudy.
The main objective of this study is to identify the significant risks in PPP projects in Kerala and develop a risk allocation framework. The risk factors in PPP projects are summarized from a comprehensive literature review. A risk break down structure is formulated consisting of main risks and sub risks. The main risks are divided into cause and effect group by usingfuzzyDEMATELanalysis.Politicalrisksarefoundtobethemajorcausegroup whilefinancialrisksandconstruction risks are impacted the most due to other risk factors. In addition, financialrisks arefoundto be themostprominentrisk groupcloselyfollowedbyconstructionrisks.
The key risks which affect the PPP projects are to be given due importance in order to achieve successful completionof such projects. A quantitativeassessment oftherisk willhelptoidentifysuchkey risks.Therisks are assessed based on a fuzzyhybridapproachincludingfuzzyFMEAandfuzzyAHPapproach.Theobtainedresultsrevealedthatthetopfourrisk factors are approvals and permits, construction time delay, availability of finance,construction cost overrun and land acquisitionrisks.TheresultsobtainedcorrelateswithrisksthatoccurredincasestudyprojectsinKerala.
In recent years the concept of PPP is gaining much more momentum across the country justbecause it has been ableto provide ample solution to the much needed projects which government cannot do on its own. The research findings presented in this report can contribute to the development and application of PPP in Kerala and enables better understandingoftheriskallocationinPPPprojects.
[1] PublicPrivatePartnershipProjectsinIndia:CompendiumofCaseStudies,PPPCell,DepartmentofEconomicAffairs NewDelhi.
[2] Ayhan M. B., A Fuzzy AHP Approach for Supplier Selection Problem: A Case Study in a Gearmotor Company, International Journal of Managing Value and Supply Chains, 2013,4(3),11 23.
[3] Li, J. and P. X. W. Zou (2011) Fuzzy AHP Based Risk Assessment Methodology for PPP Projects, Journal of Construction Engineering and Management,137(12),1205 1209.
[4] Luthra, S., K. Govindan, R. K. Kharb and S. K. Mangla (2016) Evaluating the Enablers in Solar Power Developments in the Current Scenario Using Fuzzy DEMATEL: an Indian Perspective, Renewable and Sustainable Energy Reviews,63,379 397.
[5] Mohammadi, A. and M. Tavakolan (2013) Construction Project Risk Assessment Using Combined Fuzzy and FMEA, IEEE,232 237.
[6] Nazeri, A. and R. Naderikia (2017) A New Fuzzy Approach to Identify the Critical Risk Factors in Maintenance Management, Intenational Journal of Advances in Manuf acturing and Technology,92(9 12),3749 3783.
[7] Tzeng, G. H., C. H. Chiang and C. W. Li (2007) Evaluating Intertwined Effects in E Learning Programs: aNovel Hybrid,MCDMModelBasedonFactorAnalysisandDEMATEL, Expert Systems with Applications,32(4),1028 1044.