International Research Journal of Engineering and Technology (IRJET) e ISSN: 2395 0056

Volume: 09 Issue: 07 | July 2022 www.irjet.net p ISSN: 2395 0072
International Research Journal of Engineering and Technology (IRJET) e ISSN: 2395 0056
Volume: 09 Issue: 07 | July 2022 www.irjet.net p ISSN: 2395 0072
1PG Scholar, Manufacturing systems management, Dept. of Production engineering, Govt. Engineering College Thrissur
2Associate Professor, Dept. of Production engineering, Govt. Engineering College Thrissur ***
Abstract - The purpose of this study is to find a suitable forecast aggregation strategy for forecasting temporally aggregated hierarchical data series when the base level data exhibits a seasonal pattern. The study employs 10 year monthlydataofforeigntouristsvisitedinKerala.Forecasting is essential for the four levels of hierarchy; the monthly, quarterly,halfyearlyandannualforeigntouristvisitdata.The forecasting strategies deliberated in the project are; bottom up approach, top down approach, and the optimal combination approach with Ordinary least square (OLS) for reconciliation. The performance of different strategies is comparedusingtheMeanAbsolutePercentageError(MAPE). The exponential smoothing techniques; single exponential smoothing, double exponential smoothing and triple exponential smoothing are used for forecasting individual series. The study concludes that the suitable forecast aggregation strategy for forecasting temporally aggregated hierarchical data series when the base level data exhibits a seasonalpatternisbottom upapproach.Bottom upapproach outperformalltop downapproachesandoptimalcombination approaches on average and across all levels.
Key Words: TemporalHierarchy,Forecastreconciliation, Single exponential smoothing, Double exponential smoothing,Tripleexponentialsmoothing,Bottom up,Top down,Optimalcombination.
Demandforecastingplaysacrucialroleintheoperationsof modern organizations. It supports a variety of business decisions, from operational, to tactical, to strategic level, such as capacity planning, resource planning, advertising and promotional planning, demand planning, analyzing competition effects, tactical production planning, among others.Forecastingisvaluabletobusinessesbecauseitgives theabilitytomakeinformedbusinessdecisionsanddevelop data drivenstrategies.Financialandoperationaldecisions are made based on current market conditions and predictionsonhowthefuturelooks.Pastdataisaggregated andanalyzedtofindpatterns,usedtopredictfuturetrends and changes. Forecasting allows your company to be proactiveinsteadofreactive.Accordingly,practitionersneed todefinetheforecastobjectiveintermsofforecasthorizon andtimebucket(e.g.,daily,weekly,monthly,quarterly,half yearly, etc.), so as to support the appropriate decisions.
Forecasting is the process of making predictions of the futurebasedonpastandpresentdataandanalysisoftrends. A commonplace example might be estimation of some variableofinterestatsomespecifiedfuturedate.Prediction isasimilar,butmoregeneralterm.Forecastingisaproblem thatarisesinmanyeconomicandmanagerialcontexts,and hundreds of forecasting procedures have been developed over the years, for many different purposes, both in and outsideofbusinessenterprises.Accuratedemandforecasts lead to efficient operations and high levels of customer service, while inaccurate forecasts will inevitably lead to inefficient, high cost operations and/or poor levels of customer service. Risk and uncertainty are central to forecastingandprediction;itisgenerallyconsideredgood practice to indicate the degree of uncertainty attaching to forecasts.Inanycase,thedatamustbeuptodateinorder fortheforecasttobeasaccurateaspossible.Therecognition of the best forecasting techniques is very crucial in the forecasting field, since the forecasts are used to drive the budget,distribution,andproductionplanningprocesses.
Themainobjectivesofthecurrentstudyareasfollows:
Todevelopasetofaggregationstrategiestoforecastthe demand of product hierarchies based on temporal (time)aggregationcorrespondingtoaspecificclassof data.
1. Identify different forecasting techniques throughliteraturesurvey.
2. Find the appropriate hierarchical forecast reconciliationfortheavailabledataset.
3. PerformBottomupandTop downapproaches offorecasting.
4. Comparetheforecastapproachesanddevelopa setofaggregationstrategies.
Theremainderofthepaperisorganizedasfollows.chapter 2 describes the most popular HF methods found in the literature,whileSection3presentstheproposedforecasting techniqueand reconciliationapproach.Section4 presents theresultsandfindings.Section5concludesthework.
International Research Journal of Engineering and Technology (IRJET) e ISSN: 2395 0056
Volume: 09 Issue: 07 | July 2022 www.irjet.net p ISSN: 2395 0072
The journals and publications related to hierarchical forecastingarereferredandthefindingsfromeachjournal aretabulatedinTable.1.
Table. 1: ListofJournals
1
AndreaSilvestrini & David Veredas (2008),Temporal aggregation of univariate and multivariatetime series models: A survey,Journalof EconomicSurveys
Emperica ldata
Forecasting with multivariate temporal aggregation: The case of promotional modelling, Int. J. Production Economics
up approa ch, & Optima l combin ation
Tempo ral aggreg ation
AR,ARIMA, ARIMA with seasonality, ARIMAX andGARCH models.
MAE, RMSE, & MAPE
6
George Athanasopoulos, Rob J. Hyndman, Nikolaos Kourentzes, & Fotios Petropoulos(2017 ),Forecastingwith Temporal Hierarchies
Simulate d data(ARI MA) & Emperica ldata
Bottom up approa ch & Top down approa ch
Aggregatio n Prediction Algorithm)
Scaled Mean Absolu te Error (sMAE )
2
Rob J Hyndman, RomanAAhmed, George Athanasopoulos,& Han Lin Shang (2010), Optimal combination forecasts for hierarchical time series
Simulate d data (ARIMA) &Emperi caldata
Top down approa ch, Bottom up approa ch, & Optima l combin ation
ARIMA method, ANOVA model
MAE, RMSE, & MAPE
7
BahmanRostami Tabar, M. Zied Babai,Mohammad Ali, & John E. Boylan (2019), The impact of temporal aggregation on supplychainswith ARMA(1,1) demand processes, EuropeanJournal of Operational Research
Emperica ldata
ARIMA RMAE, MASE
3
Alysha M. DE LIVERA, Rob J. HYNDMAN, and RalphD.SNYDER (2012), Forecasting Time Series With ComplexSeasonal Patterns Using Exponential Smoothing, Journal of the American Statistical Association
Emperica ldata
Top down approa ch, Bottom up approa ch
Exponentia l smoothing, ARMA, BoxCox transforma tion
RMSE
8
Sushil Punia, SuryaP.Singh,& Jitendra K. Madaan(2020),A crosstemporal hierarchical framework and deeplearningfor supply chain forecasting, Computers & Industrial Engineering
Emperica ldata
Bottom up approa ch & Top down approa ch
Single exponential smoothing, ARMA
Minim um mean square d error( MMSE) , Bullwh ip effect
Top down approa ch & Bottom up approa ch
Deep learning technique (Longshort term memory [LSTM] networks)
MAE, RMSE, & MAPE
4
BahmanRostami Tabar, M. Zied Babai, Aris Syntetos, & Yves Ducq (2013), Demand Forecasting by Temporal Aggregation
Emperica ldata
Top down approa ch, Bottom up approa ch
5
Nikolaos Kourentzes, & Fotios Petropoulos (2016),
Single exponential smoothig, AR, MA, ARMA, ARIMA
Emperica ldata
Top down approa ch, Bottom
Exponentia l smoothing, MAPA( Multiple
MSE(M ean square d error)
9
Peter Nystrupa, Erik Lindströmb, PierrePinsonc,& Henrik Madsen (2020),Temporal hierarchies with autocorrelation for load forecasting, EuropeanJournal of Operational Research
Simulate ddata& Emperica ldata
Scaled Mean Error (sME) and
Bottom up approa ch
Autocovari ancematrix withineach aggregatio n level, Markov structure, GLASSO(gr aphical least absolute shrinkage and selection operator), & Shrinkage estimator of the cross
RMSE, RMSSE , RMSPE , RRMSE
International Research Journal of Engineering and Technology (IRJET) e ISSN: 2395 0056
Volume: 09 Issue: 07 | July 2022 www.irjet.net p ISSN: 2395 0072
correlation matrix. 1 0
Filotas Theodosiou, &Nikolaos Kourentzes (2021), Deep Learning Temporal Hierarchies for IntervalForecasts, International ConferenceonAI inFinance
Emperica ldata
Bottom up approa ch
Deep Temporal hierarchica l forecasting (LSTM [Longshort term memory networks])
MAE, RMSE, & MAPE
consists of12 months data (M1,M2,M3,M4,M5,M6, M7, M8,M9,M10,M11,M12).Level2consistsof4quartersdata (Q1,Q2,Q3,Q4).Level1consistsof2halfyearsdata (H1, H2).Thetoplevel(level0)consistsofyearlydata.Theseare representedinahierarchy.
Test data are used for identifying and comparing the forecasting techniques. Generally, error measures such as RMSE, MAPE, and MAE are used in the papers related to temporalaggregation.Theforecastingtechniquesgenerally usedareExponentialsmoothing,AR,MA,ARMA,andARIMA models. Few studies are included the reconciliation techniquesontemporal forecasting.Thecharacteristicsof demand can be significant in selecting appropriate forecastingstrategies.Top downandBottom upapproaches are common strategies used for temporal hierarchical forecasting. An optimal combination method outperforms the bottom up and top down approach. In hierarchical forecastingthebaseforecastsareaggregatedtotoplevelby usingBottom upapproach,andallocateddownwardsusing Top downapproach.
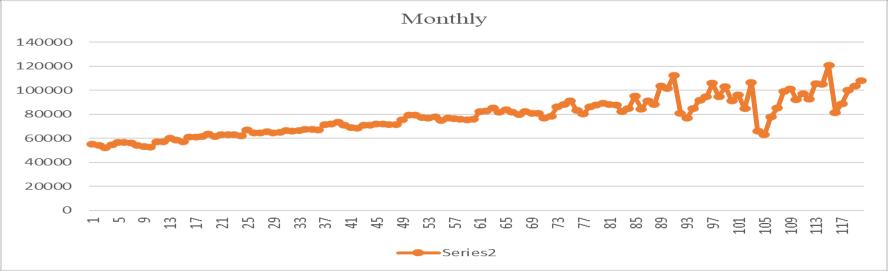
Thedatacollectionisanimportantstepforthisstudy.Data selectedshouldbeanalyzedtoknowthenatureofthedata. Trend,seasonality,cyclic,irregularity,etc.ofthedatashould becheckbeforeforecasting.Thenatureofthedatagivesthe ideaofwhatkindoftechniquesshouldfollowforforecasting. Forthestudytheseasonalityindexiscalculatedandplotted thegraphofthedata.
FromKeralatourismstatistics,thedataofnumberofforeign touristsvisitedinKeralaareavailable.Themonthlydataup to 2019 is available. For this study, over 10 year data of numberofforeigntouristsvisitedinKeralaareselected.The datadividedintotrainingdataandtestdataforcalculations. Thefirst6 yeardata(2010 2015)aretakenastrainingset and the next 4 year data (2016 2019) are taken as test data. The test data are used for validation. Comparison of different forecasting approaches are performed using the error variationin the forecastedvalue and actual valueof testdataset.
Thedataanalysisiscarriedoutbyplottingthegraphofthe data set and by ACF and PACF plots. For temporal aggregation the data is hierarchically represented as Monthly, Quarterly,Halfyearly,and Yearly. The hierarchy usedinthisstudyisshowninfig.1.Thebaselevel(level3)
Fig 1: Temporalhierarchyforthisstudy
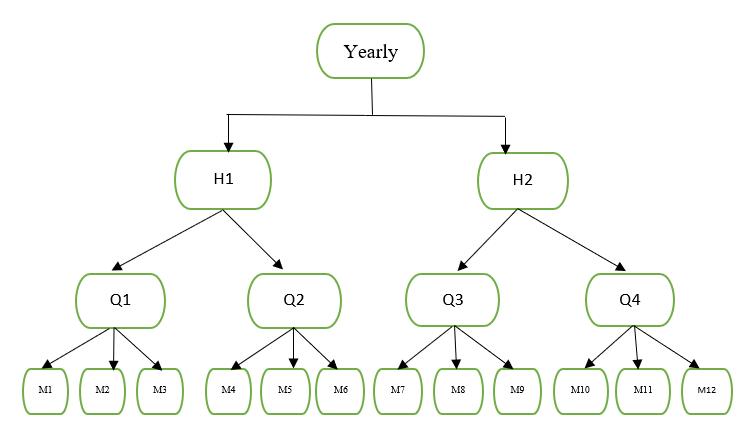
Mrepresentsthemonths,QforquartersandHforhalfyears. From the hierarchy M1, M2, and M3 add up to get Q1. Similarly, all levels of data were generated using the base level.
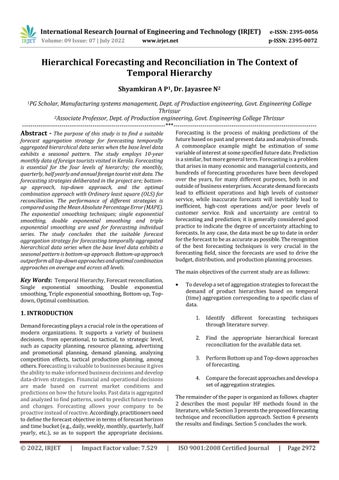
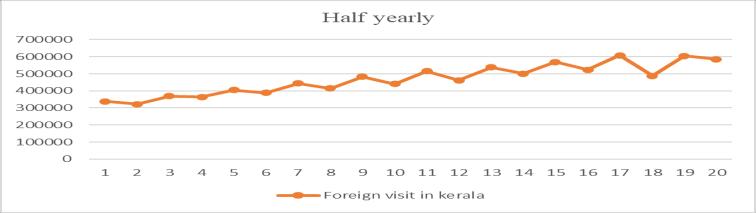
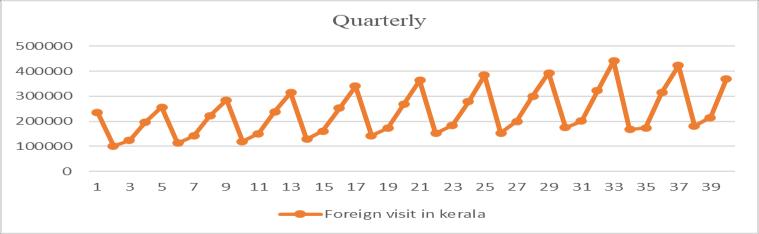
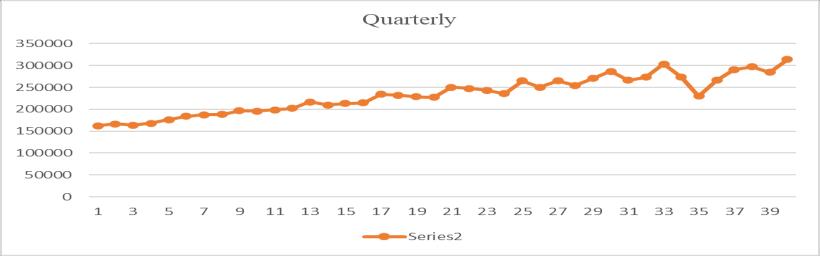
The nature of the data set can be understood from the correspondingplots. Formonthly,quarterly,andhalfyearly data,thegraphshowsaseasonality.Theseasonaldatacan’t useforsingleanddoubleexponentialsmoothingtechniques. So, the data are deseasonalized by dividing the data with corresponding seasonality index. For calculating the seasonalityindexthetrainingdatasetareused.Theplotsfor monthly,quarterly,andhalfyearlydataareshowninfig.2
Fig -2: Plotofmonthly,quarterly,andhalfyearlydata (Numberofforeigntouristsvisitedvstime)
International Research Journal of Engineering and Technology (IRJET) e ISSN: 2395 0056
Volume: 09 Issue: 07 | July 2022 www.irjet.net p ISSN: 2395 0072
Thedeseasonalizeddataplotformonthly,quarterly,andhalf yearlyareshowninfig.3.
accurate forecast. Single, double, and triple exponential smoothingaredoneusingtheforecastequations.α,ß,andΓ valuesaresetforchoosingbestforecast.
SES assumes a fairly steady time series data with no significanttrend,seasonalorcyclicalcomponent.Here,the weightsassignedtopastdatadeclineexponentiallywiththe mostrecentobservationsassignedhigherweights.
In single ES, the forecast at time (t + 1) is given by (Winters,1960)
Ft+1 =αYt +(1 α)Ft
Parameterαiscalledthesmoothingconstantanditsvalue liesbetween0and1.Sincethemodel usesonesmoothing constant,itiscalledsingleexponentialsmoothing.
Using the equation, the forecasts for test data are calculated. For each node in each level, the forecasts are calculated. The forecast error measured using MAPE and RMSEcalculations.
Fig -3: Plotofdeseasonaliseddataofmonthly,quarterly, andhalfyearly(Numberofforeigntouristsvisitedvs time)
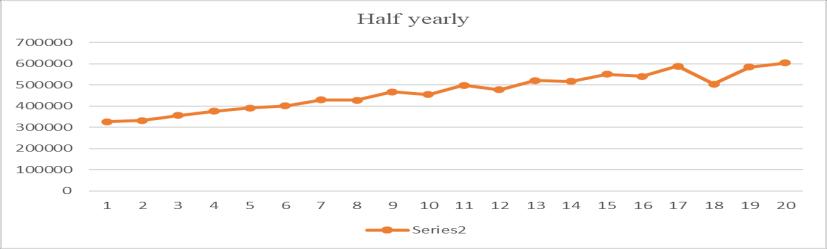
Theyearlydataisseemingtobenon seasonal.Theplotof yearlydatashowsatrendline.Tripleexponentialsmoothing technique is only applicable for seasonal data. Here triple exponential smoothingcan’t beapplicable foryearlydata. Theplotofyearlydataisshowninfig.4.
Holt’smethodofdoubleexponentialsmoothingisusedin this study. One of the drawbacks of single exponential smoothingisthatthemodeldoesnotdowellinthepresence oftrend.Thiscanbeimprovedbyintroducinganadditional equation for capturing the trend in the time series data. Double exponential smoothing uses two equations to forecast the future values of the time series, one for forecastingthelevel(shorttermaveragevalue)andanother forcapturingthetrend.
Level(orIntercept)equation(Lt):
Lt =αYt +(1 α)Ft
hetrendequationisgivenby(Tt): Tt =ß(Lt Lt 1)+(1 ß)Tt 1
αandßarethesmoothingconstantsforlevelandtrend, respectively,and0<α<1and0<ß<1.
Fig 4: Plotofyearlydata(Numberofforeigntourists visitedvstime)
Single exponential smoothing, double exponential smoothing,andtripleexponentialsmoothingtechniquesare used for forecasting. The forecasts of individual nodes in each level were forecasted using the three methods. The individual forecasts then reconciled to generate more
In this study, Holt Winter model of triple exponential smoothing are used for calculations. Single and double exponential smoothing techniques discussed so far can handle data as long as the data do not have any seasonal component associated with it. However, when there is seasonality in the time series data, techniques such as moving average, exponential smoothing, and double exponentialsmoothingarenolongerappropriate.Inmost cases,thefittederrorvalues(actualdemandminusforecast) associated with simple exponential smoothing and Holt’s methodwillindicatesystematicerrorpatternsthatreflect the existence of seasonality. For example, presence of seasonality may result in all positive errors, except for negativevaluesthatoccuratfixedintervals.Suchpatternin errorwouldimplyexistenceofseasonality.Suchtimeseries
2022, IRJET | Impact Factor value: 7.529 | ISO 9001:2008 Certified Journal |
International Research Journal of Engineering and Technology (IRJET) e ISSN: 2395 0056
Volume: 09 Issue: 07 | July 2022 www.irjet.net p ISSN: 2395 0072
datarequiretheuseofaseasonalmethodtoeliminatethe systematicpatternsinerror.
Tripleexponentialsmoothingisusedwhenthedatahas trendaswellasseasonality.Thefollowingthreeequations whichaccountforlevel,trend,andseasonalityareusedfor forecasting(foramultiplicativemodel,Winters1960):
Level(orIntercept)equation:
Lt =α(Yt/St c)+(1 α)[Lt 1 +Tt 1]
Trendequation: Tt =ß(Lt Lt 1)+(1 ß)Tt 1
Seasonalequation: St =Γ(Yt/Lt)+(1 Γ)St c
The forecast Ft+1 using triple exponential smoothing is givenby: Ft+1 =[Lt +Tt]*St c
Where c is the number of seasons (if it is monthly seasonality,thenc=12;incaseofquarterlyseasonalityc= 4;andincaseofdailydatac=7).
ThisstudymainlyfocusedonBottom up,Top downand Optimalcombinationapproaches.TheOptimalcombination approachusedinthisstudyarediscussedinsection3.1and section3.3.
Bottom up (BU) approach first generates the base forecasts in the bottom level of the forecasting structure, usingaforecastingmodel.Allotherforecastsinthestructure aregeneratedthroughaggregatingofthebaseforecasttothe higher levels, in a manner which is consistent with the observeddatastructure.Inthisstudy,thecalculationsused forbottom upapproachesare;
ŷ
Q1,h =ŷM1,h +ŷM2,h +ŷM3,h
ŷ
Q2,h =ŷM4,h +ŷM5,h +ŷM6,h
ŷ
Q3,h =ŷM7,h +ŷM8,h +ŷM9,h
ŷ
Q4,h =ŷM10,h +ŷM11,h +ŷM12,h
ŷH1,h =ŷM1,h +ŷM2,h +ŷM3,h +ŷM4,h +ŷM5,h +ŷM6,h
ŷ
H2,h =ŷM7,h +ŷM8,h +ŷM9,h +ŷM10,h +ŷM11,h +ŷM12,h
ŷA,h =ŷM1,h +ŷM2,h +ŷM3,h +ŷM4,h +ŷM5,h +ŷM6,h +ŷM7,h +ŷM8,h + ŷM9,h +ŷM10,h +ŷM11,h +ŷM12,h
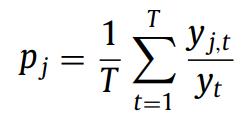
Thetop downapproachaimstoperformaforecastforthe toplevelofthehierarchy(ŷh),andthendisaggregateittothe differentnodesbyusingapredefinedproportion.Themost commonapproachistheuseoftheaverageforeachnode,j, relativetoits“parent”nodeasaproportion.Theequation forselectingtheproportion(pj)isgivenby;
ForthehierarchyshowninFig.3,thepredictionsforthe differentnodesbasedonŷh aregivenby:
ŷH1,h =pH1·ŷA,h
ŷH2,h =pH2·ŷA,h
ŷQ1,h =pQ1 ·ŷA,h
ŷQ2,h =pQ2 ·ŷA,h
ŷQ3,h =pQ3 ·ŷA,h
ŷQ4,h =pQ4 ·ŷA,h
ŷM1,h =pM1 ·ŷA,h
ŷM2,h =pM2 ·ŷA,h
ŷM3,h =pM3 ·ŷA,h
ŷM4,h =pM4 ·ŷA,h
ŷM5,h =pM5 ·ŷA,h
ŷM6,h =pM6 ·ŷA,h
ŷM7,h =pM7 ·ŷA,h ŷM8,h =pM8 ·ŷA,h
ŷM9,h =pM9 ·ŷA,h
ŷM10,h =pM10 ·ŷA,h
ŷM11,h =pM11 ·ŷA,h
ŷM12,h =pM12 ·ŷA,h
Using these equations, corresponding forecasts are calculated.
Reconciliation is the process of making the forecasts coherent. In this study, the reconciliation on hierarchical forecastisdoneusingOLS(Ordinaryleastsquare)method. Reconciliation to hierarchical forecasting gives optimal combinationapproach.TheOLSreconciliationtechniqueis introducedbyusingprogramminglanguageofpython.
2022, IRJET | Impact Factor value: 7.529 | ISO 9001:2008 Certified
International Research Journal of Engineering and Technology (IRJET) e ISSN: 2395 0056
Volume: 09 Issue: 07 | July 2022 www.irjet.net p ISSN: 2395 0072
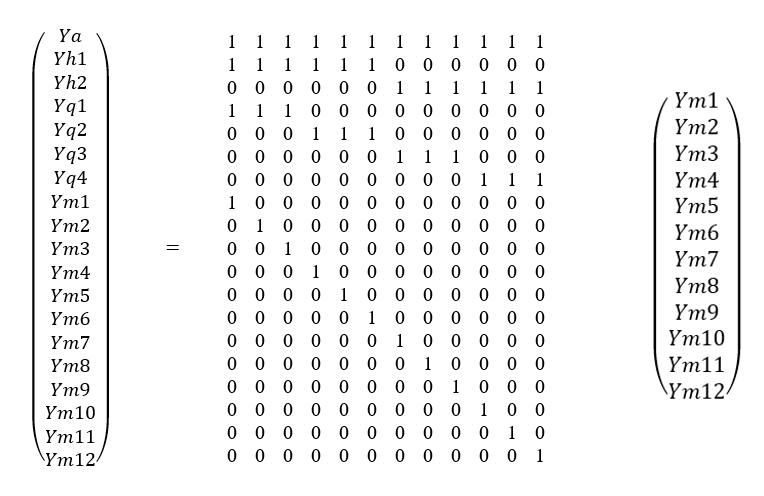
Theconvenientgeneralmatrixrepresentationis; Yt =Sbt
where S is a “summing matrix” of order m × n which aggregates the bottom level series to the series at aggregation levels above. For this study, the matrix representationis;
MAPE= *100
The equation is used for measuring the accuracy of the forecast.TheforecastwithminimumMAPEvalueistakenas bestforecastingmethod.TheMAPEvalueofeachlevelare used for comparing the forecasting techniques and to develop a set of aggregation strategy. The calculations of MAPE of each level in each forecasting methods and approachesaretabulatedinappendices.
Over 10 year data of foreign tourists visited in Kerala are takenforthisstudy.Thedatadividedintotrainingdataset of 6 year and a test data set of 4 year. The test data set is used for validation. Corresponding MAPE values for each approachforthetestdatasetwerecalculated.Theapproach withminimumMAPEvalueistakenasoptimumapproach.
Herethesummingmatrixinintheorderof19x12.The reconciliationisconductedbyintroducingamappingmatrix (P)intotheequation.
Thehierarchicalforecastingwithreconciliationcanthen bewrittenas,
ForsomeappropriatelychosenmatrixP.Thatis,existing methodsinvolvelinearcombinationsofthebaseforecasts. Theselinearcombinationsare“reconciled”inthesensethat lower levelforecastssumtogivehigherlevelforecasts.The effectofthePmatrixistoextractandcombinetherelevant elements of the base forecasts , which are then summedbyStogivethefinalrevisedhierarchicalforecasts, .
ForOLSreconciliation;
These equations are programmed in python. The hierarchical forecasts of each level are reconciled using python software. The reconciled forecasts then used for comparisontofindoptimumstrategy.
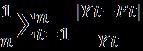
Meanabsolutepercentageerror(MAPE)istheaverageof absolutepercentageerror.Assumethatthevalidationdata has n observations and the forecasting is carried out on thesenobservations.Themeanabsolutepercentageerroris givenby;
Individualforecastofeachnodeineachlevelarecalculated andthecorrespondingMAPEaremeasured.Thecomparison ofeachforecastingtechniquesusingMAPEvalueisdiscussed inTable2.
LEVELS
SES DES TES
Level 3 7.82628 7.2704 6.10305 Level 2 6.87958 6.15453 6.12763 Level 1 6.4065 6.0496 3.787 Level 0 5.7073 5.236
Where,SES Single exponential smoothing,DES Double exponential smoothing, and TES Triple exponential smoothing.
Fromthestudy,thebestforecastingtechniqueforeachlevel isidentifiedanditislistedbelow:
For base forecast of level 3, Triple exponential smoothingisthebestforecastingtechnique.
For base forecast of level 2, Triple exponential smoothingisthebestforecastingtechnique.
For base forecast of level 1, Triple exponential smoothingisthebestforecastingtechnique
For base forecast of level 0, Double exponential smoothingisthebestforecastingtechnique.
Single exponential smoothing, Double exponential smoothing,andTripleexponentialsmoothingtechniquesof forecastingareusedinBottom up,Top down,andOptimal
International Research Journal of Engineering and Technology (IRJET)
e ISSN: 2395 0056
Volume: 09 Issue: 07 | July 2022 www.irjet.net p ISSN: 2395 0072
combinationapproaches.TheminimumMAPEvalueamong threetechniquesareusedforcomparison.
Thecomparisonofeachforecastingapproachesforalllevels ofhierarchyusingMAPEvalueisdiscussedinTable3.
BU 5.63623 4.8478 5.3737 3.5254
TD 9.04322 5.4986 5.4414 5.2360
OC 8.03957 5.58133 5.3777 3.4781
Where;BU Bottom up,TD Top down,andOC Optimal combination.
Fromthestudy,thebestforecastingtechniqueforeachlevel isidentifiedanditislistedbelow:
For level 3, Bottom up approach is the best forecastingstrategy.
combination. The forecasting techniques used are single exponentialsmoothing,doubleexponentialsmoothing,and tripleexponentialsmoothing.MAPE(errormeasure)isused for finding the best forecasting approach and best forecastingtechnique.
From the study, for the tourist visit data set the suitable forecastingtechniqueistripleexponentialsmoothing.Triple exponentialsmoothingtechniqueissuitedforseasonaldata set. The yearly tourists visit data shows only a trend. So, doubleexponentialsmoothingismoreappropriateforyearly tourists visit data. The study concludes that the suitable forecast aggregation strategy for forecasting temporally aggregatedhierarchicaldataserieswhenthebaseleveldata exhibitsaseasonalpatternisbottom upapproach.Bottom up approach outperform all top down approaches and optimalcombinationapproachesonaverageandacrossall levels.
For level 2, Bottom up approach is the best forecastingstrategy.
For level 1, Bottom up approach is the best forecastingstrategy.
For level 0, Optimal combination approach is the bestforecastingstrategy.
Foridentifyingthebeststrategy,theMAPEvalueisused.
Thestudyhelpstodevelopasetofaggregationstrategyto forecastthenumberofforeigntouristsvisitedinKeralafor theperiodof2016to2019inhierarchiesbasedontemporal (time)aggregationcorrespondingtoaspecificclassofdata. Monthly, Quarterly, Half yearly, and Yearly forecasts are calculatedusingthedevelopedmodelforthetestperiodand itisvalidatedusingactualdata.
The main objective of the study was to develop a set of aggregation strategy to forecast the number of foreign touristsvisitedinKeralainhierarchiesbasedontemporal (time)aggregationcorrespondingtoaspecificclassofdata. Inthisstudy,thetestdatasetisfrom2016to2019.Forthe developed hierarchy, the best forecasting methods are identifiedineachnodeofeachlevelandthebestforecasting strategy are identified in each level. That is, the optimum forecast and strategy for all months, all quarters, all half years, and all years of test data set are developed. The approaches used are Bottom up, Top down and Optimal
value:
There are different forecasting techniques like AR, MA, ARMA, ARIMA, Single exponential smoothing, double exponential smoothing, triple exponential smoothing, etc. Thisstudyfocusedontheexponentialsmoothingmethods accordingtotheliterature.Itisoneofthelimitationsofthe study.Similarly,therearedifferentreconciliationtechniques likeOLS,WLS,MinTrace,etc.Forthisstudy,theOLSmethod of reconciliation is used. It can also be a limitation of the study.InadditiontoBottom upandTop downapproaches therearemiddle outandoptimalcombinationapproachare there.Inthisstudy,themiddle outandoptimalcombination approachesarenotused.Itisalsoalimitationtothestudy. Forecastingintemporalhierarchyneedslongperiodofdata. Thedatatakenforthestudyisonlyover10 years.
The future work of the study relies on different areas. Forecastingforintermittentdemanddataandforecastingfor seasonaldatausingSARIMAmodelscanbeincludedinthis work in future. Covid pandemic period plays badly on tourism sector. So, the forecasting will be effective in 3 differenttimeperiods.Thatis,pre covidperiod(upto2019), Pandemicperiod(from2020),andapost covidperiod.The forecastingonanyproductdemandwillhaveaneffectdueto thecovidpandemicperiod.Forfutureworks,thetimeperiod ofdatacollectionisveryimportant.
[1] Andrea Silvestrini & David Veredas (2008), Temporal aggregationofunivariateandmultivariatetimeseries models:Asurvey,JournalofEconomicSurveys
[2] Rob J Hyndman, Roman A Ahmed, George Athanasopoulos, & Han Lin Shang (2010), Optimal combinationforecastsforhierarchicaltimeseries
[3] Alysha M.DELIVERA,RobJ. HYNDMAN,andRalphD. SNYDER(2012),ForecastingTimeSeriesWithComplex
International Research Journal of Engineering and Technology (IRJET) e ISSN: 2395 0056
SeasonalPatternsUsingExponentialSmoothing,Journal oftheAmericanStatisticalAssociation
[4] BahmanRostami Tabar,M.ZiedBabai,ArisSyntetos,& Yves Ducq (2013), Demand Forecasting by Temporal Aggregation
[5] Nikolaos Kourentzes, & Fotios Petropoulos (2016), Forecastingwithmultivariatetemporalaggregation:The case of promotional modelling, Int. J. Production Economics
[6] George Athanasopoulos, Rob J. Hyndman, Nikolaos Kourentzes, & Fotios Petropoulos (2017), Forecasting withTemporalHierarchies
[7] BahmanRostami Tabar,M.ZiedBabai,MohammadAli, & John E. Boylan (2019), The impact of temporal aggregationonsupplychainswithARMA(1,1)demand processes,EuropeanJournalofOperationalResearch
[8] Sushil Punia, Surya P. Singh, & Jitendra K. Madaan (2020), A cross temporal hierarchical framework and deeplearningforsupplychainforecasting,Computers& IndustrialEngineering
[9] Peter Nystrupa, Erik Lindströmb, Pierre Pinsonc, & Henrik Madsen (2020), Temporal hierarchies with autocorrelationforloadforecasting,EuropeanJournalof OperationalResearch
[10] FilotasTheodosiou,&NikolaosKourentzes(2021),Deep LearningTemporalHierarchiesforIntervalForecasts, InternationalConferenceonAIinFinance
[11] DazhiYang,HaoQuan,VahidR.Disfani,&LichengLiu (2017), Reconciling solar forecasts: Geographical hierarchy,Solarenergy
[12] Juan Pablo Karmy & Sebastián Maldonado (2019), HierarchicaltimeseriesforecastingviaSupportVector Regression in the European Travel Retail Industry, ExpertSystemswithApplications
[13] Dazhi Yang (2020), Reconciling solar forecasts: Probabilisticforecastreconciliationinanonparametric framework,SolarEnergy
[14] Gokhan Mert Yaglia, Dazhi Yangb, & Dipti Srinivasan (2020), Reconciling solar forecasts: Probabilistic forecasting with homoscedastic Gaussian errors on a geographicalhierarchy,Solarenergy
Volume: 09 Issue: 07 | July 2022 www.irjet.net p ISSN: 2395 0072 © 2022, IRJET | Impact Factor value: 7.529 | ISO 9001:2008 Certified Journal