International Research Journal of Engineering and Technology (IRJET) e ISSN: 2395 0056

Volume: 09 Issue: 07 | July 2022 www.irjet.net p ISSN: 2395 0072
International Research Journal of Engineering and Technology (IRJET) e ISSN: 2395 0056
Volume: 09 Issue: 07 | July 2022 www.irjet.net p ISSN: 2395 0072
Puneeth Kumar S1 , Shivaling I Mukanavar2 Prashanth Kumar J3
1 Lecturer, GPT Mirle, Dist. Mysuru, Karnataka, India 2 Lecturer, GPT Belagavi, Karnataka, India 3 Lecturer, GPT Arkere, Srirangapatna, Mandya, Karnataka, India ***
Abstract An experimental setup was developed to examine the performance of rolling contact bearings using vibration measurement and signal analysis. The defects are induced into defect free bearings using the Laser Engraving Technique. During the test, vibration signals are acquired and the kurtosis value is evaluated using LabVIEW software and supporting hardware components. In the time domain analysis of vibration signatures, the kurtosis value specifies defects in bearings. In the time frequency domain, a vibration signature is obtained by analyzing the bearing signal using Continuous Wavelet Transforms. Vibration signatures seem to be unique for a particular type of bearing defect and are useful for the detection of bearing defects and monitoring the condition of them.
Key Words: Rolling Contact Bearings, Laser Engraving Technique, LabVIEW, kurtosis, vibration signature, Continuous Wavelet Transforms.
RollingContactBearings(RCB)arethemostsignificant components of a machine, playing a key role in all the manufacturingindustries.RCBsarewidelyusedduetotheir relativelylowercostandoperationalease.Approximately40 50%ofthesuddenbreakdownofanymachineryoccursdue tofailureofbearings.Theabruptstoppageofamachinecan beavoidedbytheregularmaintenanceofmajorcomponents suchasbearingsandgearsetc.Recognizinganddiagnosing hiddenorinvisiblebearingfaultstoavoidcatastrophicfailure ofthemachineisamajorchallengefacedbyresearcherseven today.
Researchers have invented different approaches to resolving issues related to bearing fault detection and condition monitoring. Emphasis is given to condition monitoringofRCBbyusingdifferentdiagnostictechniques withenhancedaccuracylevels.Theexistenceofbearingfaults likegalling,spalling,peeling,andsubsurfacefatiguearesome oftheprimarysourcesofearlybearingfailureputforwardby theauthors.Misalignment,surfaceroughness,ahighamount of waviness, and inclusions can all cause bearings to fail. Based on customized requirements and the accuracy level desired, different bearing fault detection and condition monitoringpracticesarefollowed.
Asbearingsareoneofthevitalcomponentsofamachine, suddenfailuremayleadtoadriftinproductionactivityand even human casualties. Failure also results in production downtime,causingahugefinanciallosstotheorganization. Therefore, demands for development and execution of an efficientmaintenancestrategytolessentheimpactofsystem failureduetodefectiveRCB.
Avarietyoftechniqueshavealreadybeenimplementedto identify and diagnose bearing faults, such as vibration measurement, acoustic measurement, spectrographic oil analysis, and infrared thermography and ultrasound techniques. Among them, vibration and acoustic measurement techniques have emerged as two major practices, according to N. Tandon and A. Choudhury [1], mainly to discover faults in RCB. Vibration analysis of bearingshasemergedwiththeinnovationindigitalsensors, computers, and enhanced signal processing algorithms, which has made the job easy. The data acquisition system playsamajorroleinbearingfaultdiagnosis.
Evenagoodbearing(defect free)workingunderstandard conditions induces vibration under the action of radial or axialload.Therewillbeasignificantchangeinthevibration, ifitisadefectivebearing.InthecaseofRCB,whentherolling elementcontactsadefectonthecontactpath,animpulseis generated. If the bearing element is running at constant speed,theimpulsesgeneratedwillbeperiodicinnaturewith a definite frequency. Therefore, measurement of bearing vibrationisusefulinbearingfaultdiagnosis.
Whilesupervisingtheconditionofrotatingmachinery,it mayberequiredtofollowdifferentmaintenancetechniques toaugmentproductioncompetence.Threemajorstrategies areusedinanymanufacturingsector.Theyarebreakdown maintenance,preventivemaintenance,andcondition based maintenance (CBM). A recent development in the field of digital sensors with a more precise level of accuracy and compatiblewithcomputershasaddedmorevaluetoCBM.It isemergingasaprominenttechniqueindealingwithbearing faults.
CBMisoneofthebeststrategiesimplementedinmostof the leading industries, as early detection can put off catastrophic failure. It is a decision making strategy that strives to avoid unpredicted catastrophic failures. Thus, it
International Research Journal of Engineering and Technology (IRJET) e ISSN: 2395 0056
Volume: 09 Issue: 07 | July 2022 www.irjet.net p ISSN: 2395 0072
enablesthereestablishmentoftheconditionofamachineby theearlydetectionoffaultsandimplementingthenecessary maintenanceactionsfortheirisolation.
InthecaseofRCBfaultinvestigation,vibration baseddefect detectionandconditionmonitoringhavehelpedresearchers discoverabetterstrategyforfurtherimprovement.Recent developmentsinTime FrequencyDomainTechnique(TFDT) couldbeabletodetecttheseverityofadefectandhelptofind itsapproximatelocation.TFDThasagreatadvantageover other techniques since it can manage stationaryas well as non stationaryvibrationsignals.Inrecentdevelopmentsin thefieldofbearingconditionmonitoring,anewmathematical toolknownasWaveletTransform(WT)iswidelyusedasone oftheleadingnon stationarysignalprocessingtechniques. Tremendous investigations have been conducted by many researchersintheWTdomainwithrespecttobearingfault detectionandmonitoringitscondition.Themainreasonfor using WT is that it provides an easily interpretable visual representation of a signal induced by a bearing with or without fault. This is an essential requirement in the applicationofthevibrationsignatureofabearing[2].
Manyresearchershavecontributedvalue addedeffortsin thefieldofbearingfaultdiagnosis.Fewpeopleareconstantly workingonimportantresearchinthefieldofacousticsand vibration.Basedonprogressindigitaltechnologyandsignal processinginextractingrequiredinformationfromthesignal, vibrationanalysisofthebearingisthepriorone.Tandonand Choudhury [1] analyzed both vibration and acoustic techniquesinrevealingflawsinRCB.Itiswell understood that there is more scope for vibration measurement techniquesthanacousticmeasurementmethods.
PankajGupta etal.[3]have workedhardtosummarise current research on vibration analysis of RCB faults and techniquesforfaultrecognitionintime,frequency,andtime frequencydomain.Thetime frequencydomainapproachis aneffectivesignalprocessingtechniqueforbothstationary and non stationary vibration signals. The WT is an extensively used technique in the time frequency domain because it is capable of extracting weak signals for which FastFourierTransforms(FFT)areineffective.
TheyareTimeDomainTechnique(TDT),FrequencyDomain Technique(FDT),andTime FrequencyDomainTechnique (TFDT).
Intheyear1978,avaluableparametercalledkurtosiswas proposedasapriorindicationofdamagewhichoccursinthe lowerfrequencyband(3to5kHz).Eventhoughitwasclear by a value of 3, indicating that it was in the direction of failure.
MathewandR.J.Alfredson[4]bothcarriedoutadditional experimentstoinvestigateavarietyoftimeandfrequency domain parameters that are very useful in monitoring the conditionofbearings.Alltheparametersyieldsomevalues dependingonthetypeofbearingfailureencountered.Ifthere isapresenceofconsiderableimpulsivenessinthevibration data, the statistical parameter like kurtosis gives a better indicationofbearingdamage.Inthemeantime,theyhaveall reportedthatthecrestfactorappearstobeapoorpredictor ofRCBfaultdetection.
Wheneverarollingelementofabearinginteractswitha defect,itproducespulsesofveryshortdurationduetothe rotation of the bearing. These pluses stimulate the natural frequenciesofthebearinghouseandsupportingstructure. This in turn increases the vibration energy at high frequencies. There will be an increase in vibration energy levelattheelementrotationalfrequencyifthereisadefectin anyofthebearingelements.Thedefectfrequenciescanbe evaluated from kinematic considerations like bearing geometryanditsrotatingspeed.
The dynamic behaviour and/or the external excitation, mainlyundertime varyingconditionsinarotatingsystem, leadtonon stationarysignals.Thereisaneedforanefficient analysis method which can take care of both frequency informationandtime invariantfeaturesfromnon stationary signalssimultaneously.
Non stationary signals are well analyzed using time frequency analysis in controlling the stable state of the machinery.Time frequencyanalysiscanidentifyfrequency componentspresentinthevibrationsignalandalsoreveal theirtime dependentfeatures.Ithasbecomeaneffectivetool toextractthebearingfaultshiddeninnon stationarysignals.
According to R. J. Alfredson [4], the tests carried out provedtobeveryusefulinexaminingawiderangeoftime andfrequencydomainparametersthatarepotentiallyuseful inconditionmonitoringofbearings.
he early investigation reveals three major approaches followedintheidentificationofseveredefectsinbearings.

Manyanalyticalmethodsthataddressthenon stationary natureofthesignalbydecomposingitovertwodimensions, proposed by many experts. The typical method includes lineartime frequencyrepresentationlikeShortTimeFourier Transforms (STFT), WT, and bilinear time frequency representationsuchasWingervilladistributionandHilbert Hungtransforms.
Themajoradvantageoverprevioustechniquesisthatits decomposition permits projections of the time history of vibration data onto a space that allows separation of components of the signal. It facilitates improvement,
International Research Journal of Engineering and Technology (IRJET) e ISSN: 2395 0056
Volume: 09 Issue: 07 | July 2022 www.irjet.net p ISSN: 2395 0072
recognition, filtering, classification, and resynthesis of the signal.
TheSTFTimplementedbyresearchersmightonlymake provisions for slicing the signal with a fixed tiny window along the time axis. The segmented signal under the short windowdoesnotchangetoomuch,henceitcanbeassumed asstationary.ThemajordisadvantageofSTFTisthatonce the window function and its length are chosen, the time frequencyresolutionisfixed.
In a specific application, it is desired to resolve time instant of a higher frequency component. A shorter time window should be employed. If we are interested only in lower frequency components, a longer time window is chosen. Therefore, it is not appropriate to use it in the analysis of signals having highly transient behavior. To overcometheproblemofmulti resolution,researchershave switchedtoWT.
WTutilizeswaveletsinplaceofsinusoidalfunctions,asin thecaseofSTFT.Inadditiontothetimevariable,italsohasa scale variable in the inner product transform. Thus, it is a successful method suitable for time frequency localization andismoreusefulintransientsignalanalysis.
A detailed study on the application of WT in the fault diagnosisofRCB‘srevealsthatitplaysamajorroletodayas an effective TFDT in dealing with condition monitoring of bearing faults using vibration data. WT can be efficiently implementedforde noisingtherawbearingvibrationdata, whichincludesunwantednoiseetc.Further,WTdecomposes thenon stationarybearingvibrationsignalintocomponents withsimplefrequencycontent.
MadhavendraSaxena[2],hasstatedthatContinuousWavelet Transform(CWT)analysisisaneffectivetoolforanalyzing bearing faultdata becausein this wemay getall the three details, that is time detail, frequency detail, and amplitude detail, and also the CWT signature, which is the unique feature.
Based ontheaboveliterature review, the problem forthis workisdefinedas"Faultdetectionandconditionmonitoring ofrollingcontactbearingsusingvibrationsignature".
Thekeyobjectivesofthepresentworkareasstatedbelow.
Todevelopanexperimentalsetupforthepurposeof measuringbearingvibrations.
Toestablishadataacquisitionsystemaspartofan experimentalsetupusingNationalInstruments(NI) hardware devices and Laboratory Virtual
Instruments Engineering Workbench (LabVIEW) software.
To make use of Matrix Laboratory (MAT lab) softwareandtheavailableWTfunctiontoanalyze bearingvibrationsignals.
To generate a bearing vibration signature for assumedcasesusingCWT.
To attain the objectives stated above, subsequent methodologyisimplemented.
1) UsingtheLaserEngravingTechnique(LET),defects areartificiallyseededontheinner race,outer race, ball,andcageofageometricallyperfectbearing.
2) Vibrationsaremeasuredintermsofaccelerationfor geometrically perfect and defected bearings using theexperimentalsetupdeveloped.
3) Vibrationsignalsarerecordedforallbearingsusing thedataacquisitionsystem.
4) TheMatlabenvironmentandavailablealgorithms areusedtovisualiseandanalysebearingvibration signals.
5) Vibration signatures are generated using CWT analysis.
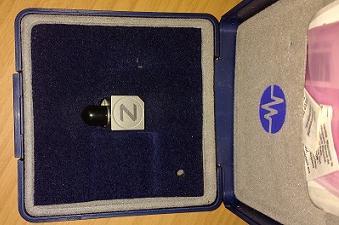
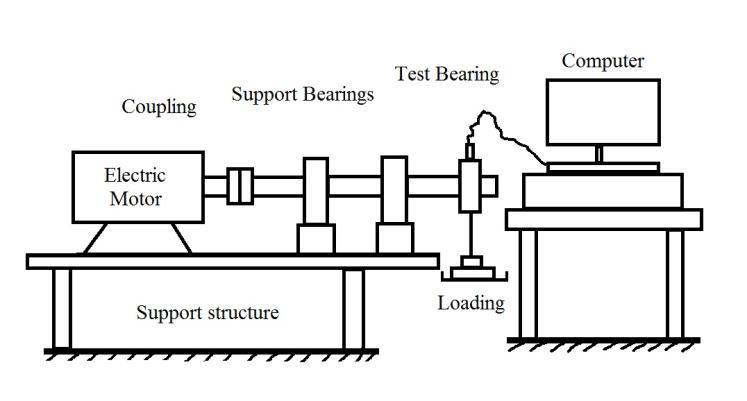
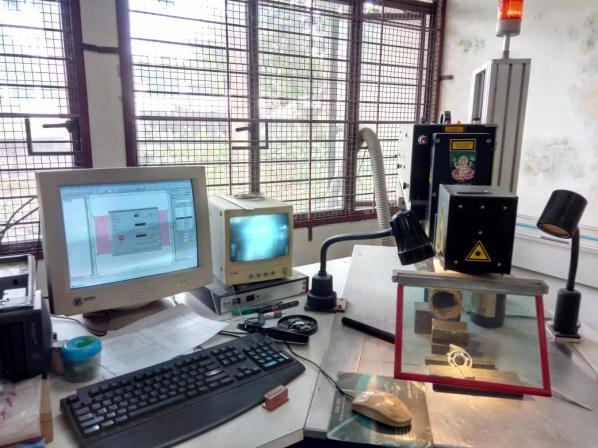
Asuitableexperimentalsetupisrequiredtoexaminethe performance of RCB. An experimental test setup was developed to acquire vibration response for geometrically perfect bearings and bearings with faults. Faults are artificiallyinducedintobearingsusingLET.Adataacquisition system is established by employing NI hardware devices, computer,andLabVIEWsoftware.Itisconnectedtothetest setuptoacquirevibrationsignalsasperrequirements.The vibration data is stored in the system with the help of the Virtual Instrument (VI) program developed in LabVIEV software. The line diagram of the test setup necessary to conductexperimentsisillustratedinFigure1.
2021, IRJET | Impact Factor value: 7.529 | ISO 9001:2008 Certified
International Research Journal of Engineering and Technology (IRJET) e ISSN: 2395 0056
Volume: 09 Issue: 07 | July 2022 www.irjet.net p ISSN: 2395 0072
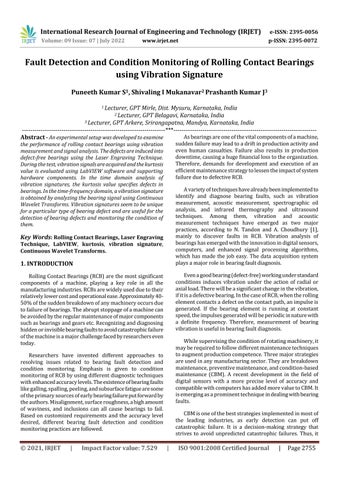
1) 0.5Hp3Phaseinductionmotor
2) Tri axialPiezoelectricAccelerometer
3) C DAQHardware
4) Flexiblecoupling
5) Testbearing
6) Supportbearings(Plummerblock)
7) Solidshaftof250mmlength
Itcomprisesa0.37kWinductionmotor,ashaftof490mm inlengthandadiameterof20mm.Theshaftiscoupledtothe electricmotorwithflexiblecouplinginordertoreducethe effectofhighfrequencyvibrationinducedbythemotor.
Thetestsetupaccommodatesonetestbearingatthefree end of the shaft and two support bearings mounted at an equaldistancefromthetestbearingsonacommonshaft.The support bearings are mounted in housings. They are ball bearingsofthesameboresizeasthetestbearing.Thetest bearingisexaminedwiththeloadingarmkeptontheouter race so as to restrict the rotation of the outer race of the bearing.Theloadingarmishingedtothebasestructureso thatitwillhavelinecontactwiththetestbearing.Theradial loadisappliedtothetestbearingthroughtheloadingarm.
Inordertomeasurethetestbearingvibrations,atri axial piezoelectricaccelerometerismountedontotheloadingarm exactlyabovethetestbearing.Inordertorecordvibration data,itiscoupledtotheCompactDAQchassis,whichworksas an interface between the accelerometer and LabVIEW software. Vibration data is stored on a computer with the help of the LabVIEW program. Loading is used in order to enhancethespectrumamplitudeofthesystem.
8) Loadingarmof2.5mmthickand300mmlength 9) WoodenTable
10) Computer
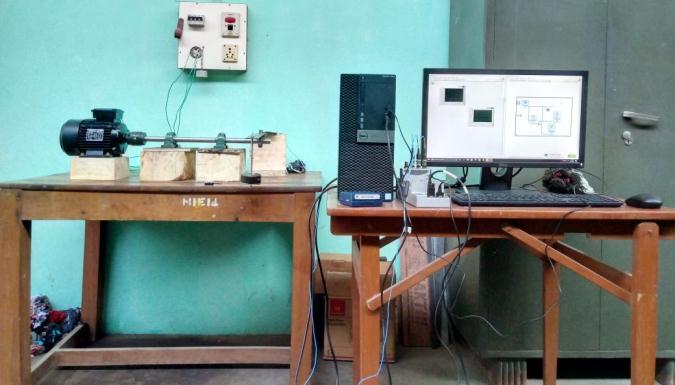
5.2 356A15
Ithas fixedvoltagesensitivity,irrespectiveofthecable typeorlength.Itpossessesalowimpedanceoutputsignal, which can be transmitted over lengthy cables in harsh environmentswithvirtuallynolossinsignalquality.Italso includes features like low noise, voltage output signal compatiblewithstandardreadout,signalanalysis,recording anddataacquisitionequipment.
Table -1: 356A15accelerometerdetails
Make PCBPiezotronics Type ICP
MountingMethods AdhesiveorStud Sensitivity
102.8mV/gor10.48mV/ m/s2
Measurementrange ±50gor±490m/s2
Frequencyrange 2to5000Hz Operatingtemperature range 54°to+121°C
Figure 2 shows the various components connected to developthetestsetupforthebearingconditionmonitoring.It consistsofthebelow mentionedcomponents.
International Research Journal of Engineering and Technology (IRJET)
e ISSN: 2395 0056
Volume: 09 Issue: 07 | July 2022 www.irjet.net p ISSN: 2395 0072
The test bearings utilised in the experiments are SKF 6304 deep groove ball bearings with a 20mm bore. Three bearingswithzerodefectswerealsotestedtoestablishthe vibration levels of geometrically perfect bearings. The detailedspecificationanddimensionsofthetestbearingare listedinTable2.
Bearingnumber 6304
Make SKF
Limitingspeed 19000rpm
Ballbearingtype DeepGroove
InsideDiameter 20mm
Racewidth 15mm
OutsideDiameter 52mm
StaticloadRating 7.8kN
BoreType parallel Numberofrows 1
DynamicloadRating 16.8kN
Maxspeedgrease 11000rpm Maxspeedoil 14000rpm
RaceType plain Cagematerial steel
Endtype open
Techniques such as spark erosion, acid etching, scratching,mechanicalindentation,andlaserengravingare usedtointroducedefectsontonormalbearings.Hence,itis essential to create faults artificially on bearing elements withoutdisturbingtheirbasicgeometry.LETisusedtoseed defectsinthework,asitisasimplemethod.
A CO2 laser is used to create a defect in the bearing. A bearingisorientedinadirectionsoastocreateadefectin theformofalineorpocket.Itisatedioustasktocreatefaults exactly onthecontact pathof the rollingelement withthe inner race and outer race. Care should be taken while the orientationofthebearingisunderthelaserprobe.
SI No. Bearing Type
Location of defect Nature of defect
1 Geometrically perfect Defect free Nodefect
2 Geometrically Imperfect
Inner race(on thecontact surface) Rectangularpocket
3
4
Outer race(on thecontact surface) Linecrack
Ballandcage (Combined) Material degradation
Forthepurposeofmeasuringbearingvibration,signals inducedatthetestbearingneedtobeacquiredandrecorded by integrating NI hardware and the LabVIEW software environment.NIhardwaredevicesarecompatiblewiththe LabVIEWenvironment,itisrequiredtousethiscombination as a data acquisition system. Hence, the data acquisition system includes certain hardware devices and computer installedwiththerequiredsoftware.
The CompactDAQ 9178 chassis incorporates a data acquisitioncard9234,whichisextensivelyusedforacquiring sound and vibration signals. The hardware system is interfacedwithLabVIEWsoftwareinstalledonthecomputer withtheminimumconfigurationdesired.Thedrivesoftware corresponding to C DAQ 9178 is installed. The data acquisitioncardhasfoursimultaneouschannelstoacquire vibrationdata,namelyai0,ai1,ai2,ai3.Thevibrationsignal
International Research Journal of Engineering and Technology (IRJET) e ISSN: 2395 0056
Volume: 09 Issue: 07 | July 2022 www.irjet.net p ISSN: 2395 0072
can be measured at a default rate of 25.6 kHz with 25.6k samplespersecond.
Table 4: C DAQHardwarespecification
NumberofChannels 4 Voltagerange ±5V Accelerationrange ±5m/s^2 Temperaturerange 40º to+70ºC
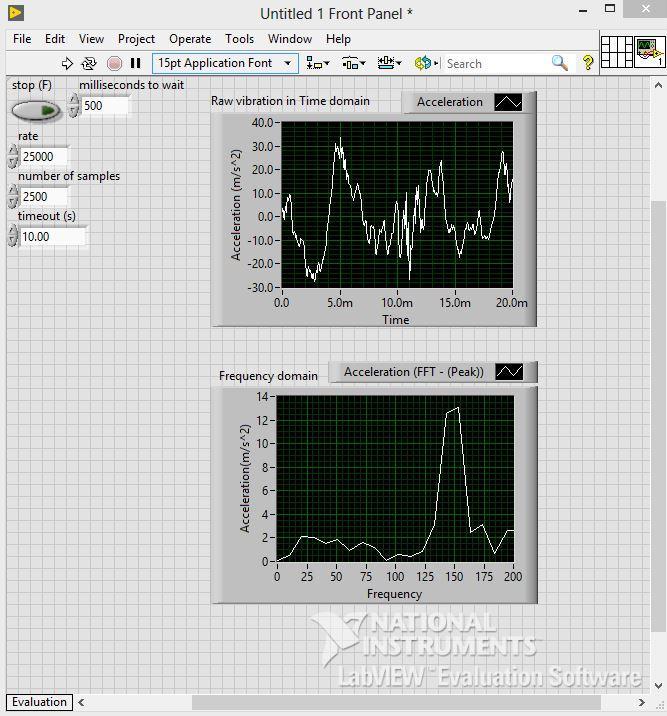
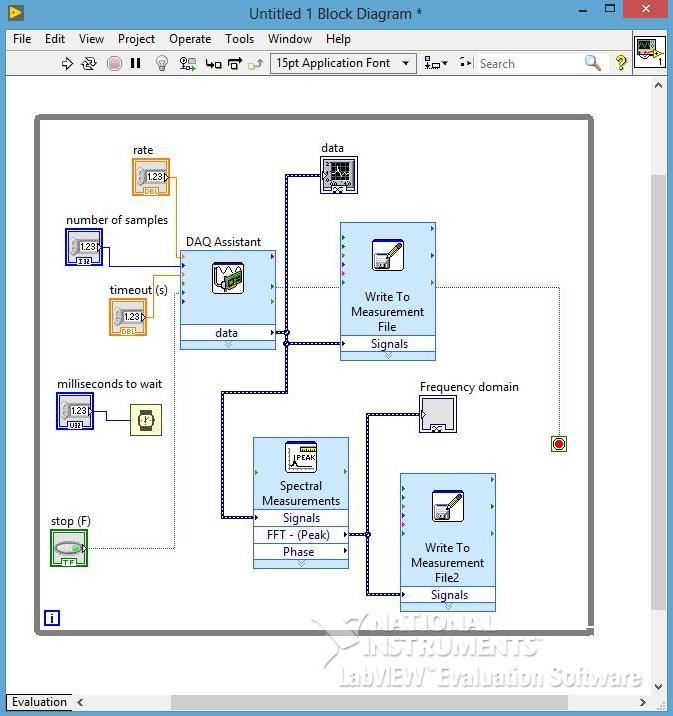
AVIprogramiscreatedtoacquiresignalsfrombearings.
Fig 5B
We can make use of the final VI generated in LabVIEW to conductallexperimentaltrails.
5.8.
Normally,foralltests,thenewbearingsaretakenfirst,based on the nature of the faults to be induced using the laser engravetechnique.Thetestconditionsareasfollows:
Case 1: A geometrically perfect (defect free) bearing is examinedtoobtainbaselinedata.
Case 2: Fault was induced by creatinga small rectangular pocketintheinnerrace.Theinner racewasfinallydamaged, particularlyovertheloadedsectionoftherace.Theouter raceandtherollingelements werenotobviouslydamaged butwereclearlypolished
Fig -5A:VibrationSignalAcquisitionVI
Case 3: Faultwasproducedbycreatingasmalllinecrackon theouter race.Severedamagesubsequentlyoccurredonthat outerraceontheloadedside.Theinner raceandtherolling elementsappearednottobedamaged.
Case 4: Inthisbearing,somesmallflatsweregroundonthe rolling elements and cage. The rolling elements were also clearlyspalledandtheoriginalflatswerebarelyidentifiable. Theinner raceandouter raceappearednottobedamaged.
Vibrationdataatthetestbearingwasacquiredataconstant speedof1490rpm.Theloadonthetestbearingwasvariedin threestepsforageometricallyperfectbearing.Itisobserved thatwiththevariationofloadonthebearing,theamplitude ofvibrationhaschanged.
2021, IRJET | Impact Factor value: 7.529 | ISO 9001:2008 Certified Journal | Page2760
International Research Journal of Engineering and Technology (IRJET) e ISSN: 2395 0056
Volume: 09 Issue: 07 | July 2022 www.irjet.net p ISSN: 2395 0072
To facilitate the bearing and increase the spectrum amplitude of vibration, a static load is applied by placing standard weights in the loading arm. The vibration of the testbearingintheverticaldirection(alongthezaxisofthe accelerometer)ismeasuredbyatri axialaccelerometerwith asensitivityof100mv/g.
The first set of experiments are conducted on defect free bearingssoastoestablishthebaselinevibrationdata.Then thedataiscollectedfordifferentfaultcases.
Samplingrate=25.6kHz
Numberofsamples/datapoints=25600
Thetestsarecarriedoutfordifferentcaseswiththesame parameters. The recorded vibration data is stored on the computerinanLVMfileextension.Thestoreddatacanbe retrievedeitherintoLabVIEWsoftwareorintotheMATlab environment.
The wavelet transforms (WT) is a rapid emergent mathematicalandsignalprocessingtool,whichconvertsraw vibration data into a sequence of wavelet coefficients in a time scalegridusingthewaveletbasicfunction.Thewavelet transformprovidesthetime frequencyrepresentation.
In various situations, a particular spectral component occurringatanyinstantoftimeisofmoreinterest.Insucha situation,itisimportanttoknowthetimeintervalswhere particularspectralcomponentsoccur.WTisabletoprovide thetimeandfrequencyinformationsimultaneously.
Investigationwithwaveletsproceedswithbreakingupa signal into shifted and scaled versions of its mother (or original)wavelet,thatis,obtainingonehighfrequencyterm fromeachlevelandonelowfrequencyresidualfromthelast levelofdecomposition.
Inotherwords,decompositionofsignalsisaprocessof breaking signals into lower resolution components with respect to levels. In particular, the Continuous Wavelet Transform (CWT) provides a multi resolution in time frequency analysis for characterization of the transitory features of non stationary signals. The effect was an accumulation of higher frequency sine waves spread throughoutthefrequencyaxis.CWTiswidelyusedtodividea continuous timefunctionintowavelets.
The frequency and time information of a signal at some certainpointinthetimeversusfrequencyplanecannotbe known. In other words, we cannot know what spectral componentexistsatanygiveninstant.Thebestwecandois toinvestigatewhatspectralcomponentsexistatanygiven intervaloftime.Thisisaproblemofresolution,anditisthe main reason why researchers have switched to WT from
STFT.STFTgivesafixedresolutionatalltimes,whereasWT givesavariableresolution.
TheCWTwasdevelopedasanalternativeapproachtothe STFT to overcome the resolution problem. This is used to analyzethesignalinthetime frequencydomain.Thisenables time frequencyselectivity,asitispossibletolocalizeevents bothintimeandfrequency.
TheCWTcanbemathematicallyrepresentedas CWT(a,b)=1/√a∫_( ∞)^(+∞)▒〖X(t)〗 ψ^*((t b)/a)dt 4.3
Thetransformedsignalisafunctionoftwovariablesa,b wherea representsscaleparameter b representstranslationparameter ψ representsmotherwavelet ψ^* complexconjugateofψ
The results of the CWT are many wavelets’ coefficients C, whicharefunctionsofscaleandposition.Whenmultipliedby asinusoidofappropriatefrequency,ityieldstheconstituent sinusoidalcomponentsoftheoriginalsignal.
5.12. Steps followed in CWT analysis
1) Takeawaveletandcompareittoasectionatthestartof theoriginalsignal
2) Calculate the wavelet coefficient (C), which represents howcloselycorrelatedthewaveletiswiththissectionofthe signal.ThehigherthevalueofC,whichindicatesthemore similarity. The results depend much on the shape of the waveletwechooseforaparticularapplication.
3) Shift the wavelet to the right and repeat steps 1 and 2 untilwe’vecoveredthewholelengthofthesignal.
4)Scale(stretch)thewaveletandrepeatsteps1through3.
5)Repeatsteps1through4forallscales
The bearing vibration signals recorded during the experimentscontainunwantednoiseandotherdisturbances inadditiontotherequiredinformation.Inordertoextract thedesiredfeaturefromit,anappropriatesignalprocessing technique with suitable software should be employed to representthesignalinaneasilyrecognisableformat.
Thevibrationdata recordedinthetimedomaincanbe retrievedintheLabVIEWenvironmentforfurtherprocessing
International Research Journal of Engineering and Technology (IRJET) e ISSN: 2395 0056
Volume: 09 Issue: 07 | July 2022 www.irjet.net p ISSN: 2395 0072
andevaluationofafewkeyparametersrequiredforbearing faultdiagnosis.
SI No Load (kg) Amplitude (m/s^2) Avg Value 1 5 45.97 49.58 2 55.26 3 47.52 4 7.5 70.36 79.58 5 82.99 6 85.39 7 10 94.45 106.24 8 107 9 117.28
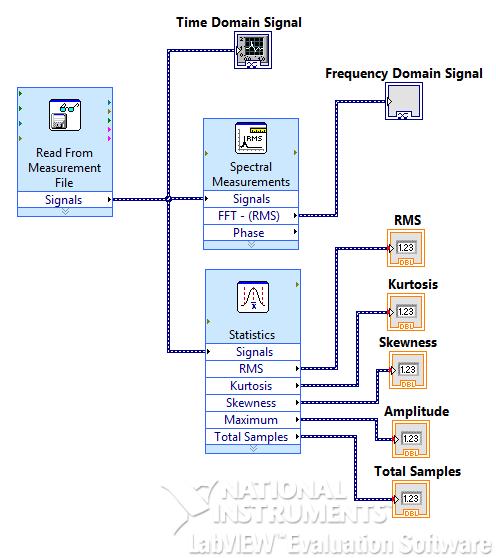
AVIprogramistobegeneratedinLabVIEWasillustratedin Figure6soastoreadthevibrationsignalsstoredduringthe experiments.Thestatisticspalletcanalsobeincorporated into the same VI to evaluate some statistical features like Kurtosis, RMS value, skewness etc. In addition, it is also possibletocalculatetheamplitudeofvibrationandsample sizeofvibrationdataacquired.
Thegeometricallyperfect(defect free)bearingistestedat three different levels of loading in the radial direction. At eachloadstep,threetrialswereconducted.UsingLabVIEW foralltrials,theinterestingfeaturesarerecordedfromthe bearingvibrationsignals.ItisclearlyunderstoodfromTable 4 that as the load is increased, the vibration level also increasesinthepresentexperimentalsetup.
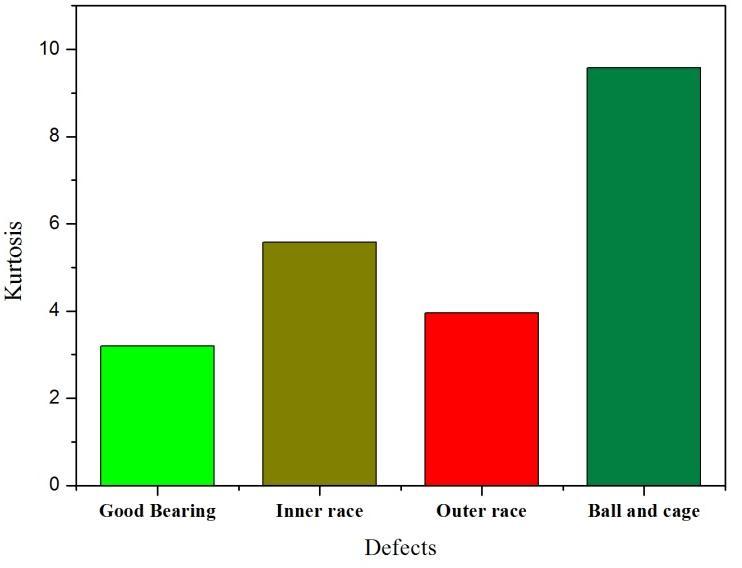
Thekurtosisvaluesforallfourtestcasesareevaluatedusing theLabVIEWVIshowninFigure6,withkurtosisvaluesof 3.2, 5.58, 3.96, and 9.58 for the defect free bearing and bearings with defects at the inner race, outer race defect, ball,andcage,respectively.Thevaluesaretabulatedforthe respectivecasesinTable5.andevenabarchartgivesmore clarityofkurtosisvaluesfordifferentcases.
Table 5 Kurtosisvalueevaluatedforfourtestcases
SI No. Bearing Condition Kurtosis 1 Defect free 3.2 2 Inner race(onthecontactsurface) 5.58 3 Outer race(onthecontactsurface) 3.96 4 Ballandcage(Combined) 9.58
Chart 1:Variationofkurtosisvaluewithbearingdefect
International Research Journal of Engineering and Technology (IRJET) e ISSN: 2395 0056
Volume: 09 Issue: 07 | July 2022 www.irjet.net p ISSN: 2395 0072
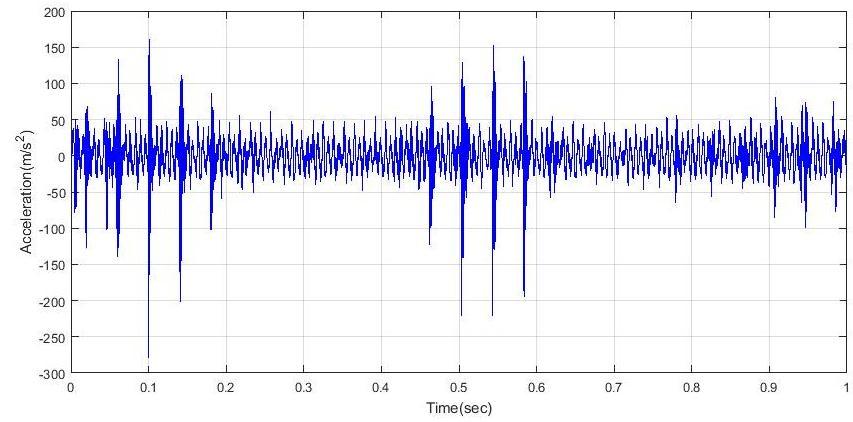
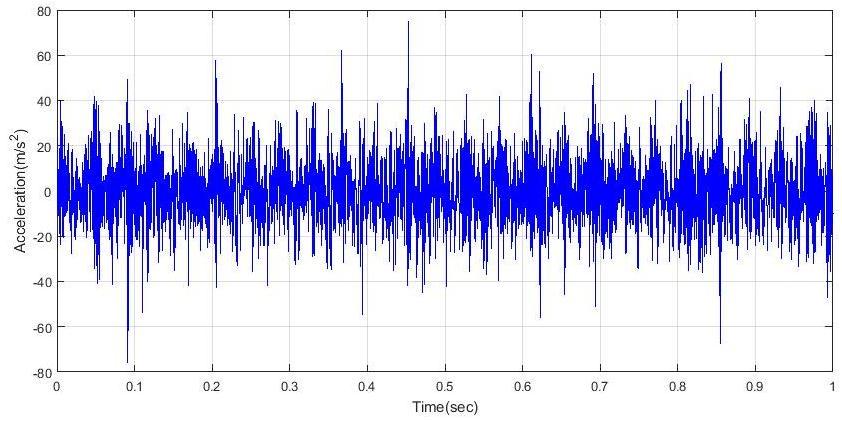
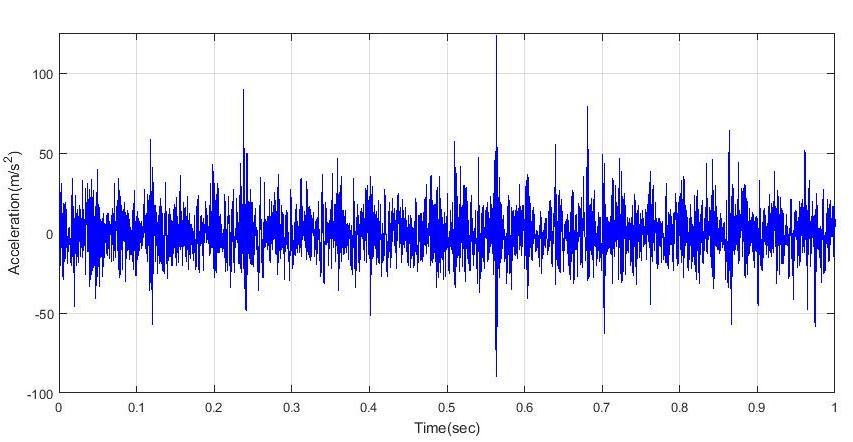
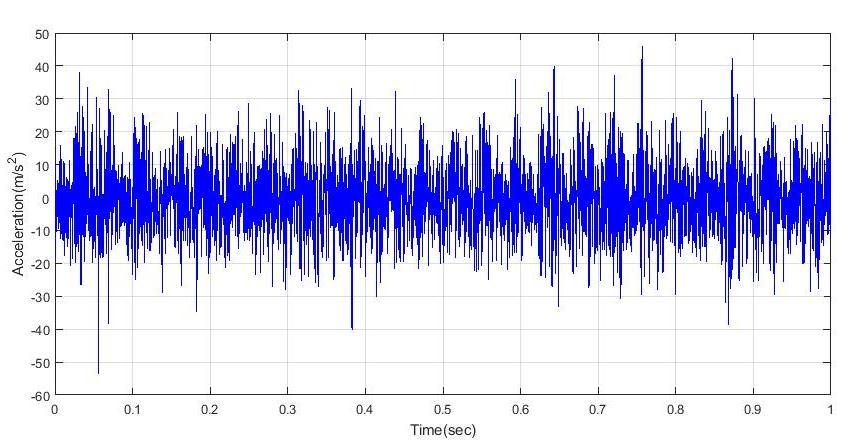
To generate vibration signatures in the time domain, vibration signals acquired from defect free and bearings withdefectsattheinner race,outer racedefect,andballand cageareplottedinatimeamplitudegridusingtheMATlab program.Thevibrationsignaturegeneratedforallfourcases isshowninFigures7to9intermsoftimeandacceleration.
Case 1: Perfectbearing
Figure.7 Timehistoryofdefect freebearing
Case 2: - abearingwithaninner raceflaw
Case 4: bearingwithaproblemontheballandcage
Figure.8 Timehistoryofbearingwithinner racedefect
Case 3: abearingwithanouter racefault
Itisevidentfromallfourtestcasesthateachrepresentsa unique vibration pattern. We can also observe periodic impulsespresentinbearingswithdifferenttypesofdefects. Time domain information is insufficient to recognise the bearingdefectseffectively.Therefore,thevibrationsignals need to be analysed in the time frequency domain to get moreclarity.
6.3.
Asdescribedearlier,CWTcanbeeffectivelyusedtomonitor bearing faults. CWT based analysis is used to identify bearingfaults.Thistechniquedoesnotinvolvelengthysignal processing like other methods. It is a simple visual inspectionmethodanddoesnotrequiretheanalysttohavea lot of experience in signal processing or bearing fault diagnosis.
6.4.
TheprocessingofthevibrationsignalintheMATlabcanbe dividedintothefollowingsteps.
1)Loadorimportandvisualizethevibrationsignal
2)ProcessingvibrationsignalsusingtheCWTalgorithm.
3)plottingthesignal'stime scalerepresentation
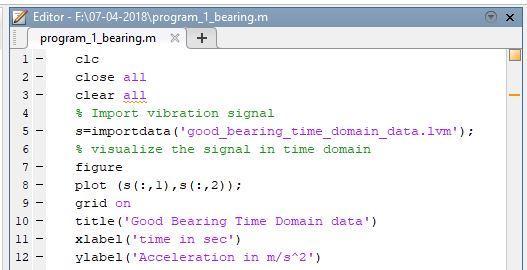
1) Importing and visualizing the vibration signal
Thefollowingprogramcanbeusedtoloadandvisualizing thevibrationsignal.
Figure.8 Timehistoryofbearingwithouter racedefect
International Research Journal of Engineering and Technology (IRJET) e ISSN: 2395 0056
Volume: 09 Issue: 07 | July 2022 www.irjet.net p ISSN: 2395 0072
from CWT analysis for defect free bearings and bearings with outer race defect, inner race defect, and combined defectofballandcage.
The above program enables us to import the vibration signalsrecordedinlvmfileformat.Wecanalsovisualizethe signalintherawformat.Thesameprogramcanbefurther continued to process bearing vibration signals using the CWTalgorithmasdescribedinthesubsequentstep.
TheMATlabisextensivelyusedtoprocessvibrationsignals usingtheCWTalgorithmreadilyavailableinthesoftware. We can make use of the CWT concept in analyzing the bearingvibrationsignalsobtainedfromfourtestcasesfora bearingrotatingat1490rpm(24.83Hz).TheCWTanalysis plotsresultsintermsoftimeandscale.TheMATlabcode developedtoobtaintheCWTanalysisofvibrationsignalsis shown below. The same program is employed for all four testcasesbyimportingtherespectivefilesrecordedduring theexperiments.
clc clearall closeall
%importingrawvibrationdata
Time_domain_signal=importdata('test_1.lvm');
%continuouswavelettransforms c=cwt(Time_domain_signal,1:128,'db4','plot');
The last statement in the above program indicates parameters such as the signal to be analysed using CWT analysis,scalesselected,andwavelettypeemployed.Inthis case,wehaveselected128asthescaleanddb4represents theDaubechieswavelethavinglevel4.
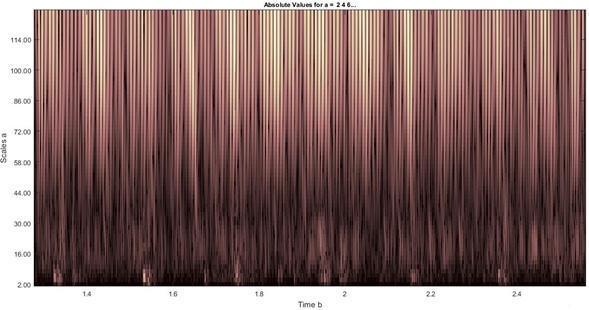
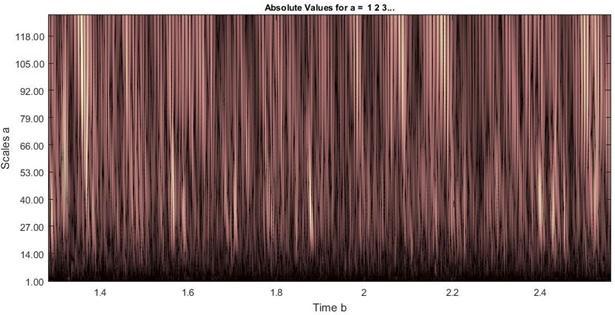
Thefunctioncwtproducesaplotoftheabsolutevaluesof the CWT coefficients. In this case, the coefficient matrix produced by the program will have a matrix size of 18 by 25600,witheachindividualrowcorrespondingtoasingle scale.Figures11to14showthetime scaleplotsobtained
TheplotsshowninFigure11to14aretheCWTcoefficient plotsonatimeversusscale.Thebrightnessofcolourinthe plotindicatestheamplitudeatthecorrespondingpointon thetimescalegrid.Theparameterscale,asexplainedearlier, maybeconsideredtheinverseoffrequency.Thelowscales represent high frequency regions, and the high scales correspondtolowfrequencies.
When the defect free bearing is operating, the energy is accumulatedinthelowfrequencyrange,wheremostofthe macrostructuralvibrationsarelocated,shouldbelow.Itcan be observed from Figure 11 where dark color in the low frequency range (scales 92 to 118) indicates low energy contentandspecifiesthatbearingisinnormalcondition.
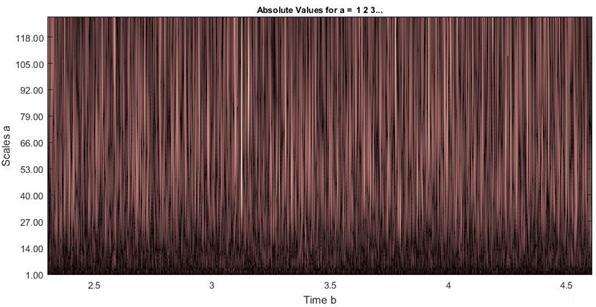
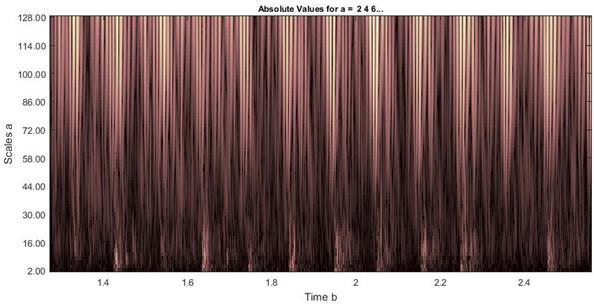
On the other hand, the energy level is high if high energy content is recognized in low frequency range where the bearing characteristic frequency lies, it indicates towards defective bearing. In Figure 12, where an outer race fault existsinthebearing,theenergylevelsofvibrationsinthe low frequency range are high as highlighted by bright coloredcontoursinthelowfrequencyrange.
2021, IRJET | Impact Factor value: 7.529 | ISO 9001:2008 Certified
International Research Journal of Engineering and Technology (IRJET) e ISSN: 2395 0056
Volume: 09 Issue: 07 | July 2022 www.irjet.net p ISSN: 2395 0072
The CWT analysis carried out for defect free indicates accumulation of its energy in lower frequency bands as showninFigure11.Forabearingwithdefectatouter race as illustrated in Figure 12 signifies the existence of high energy content at lower frequency band, because bearing characteristicfrequencyliesinthisregion.Similarlybearing havingdefectatitsinner raceanddefecton ball andcage alsoexhibitsamebehavioratitslowerfrequencyband.In additiontothisitalsoindicatesthepresenceofenergylevel athighfrequencyband,wherethebearingexcitationrangeis located.
Thebelowmentionedconclusionaredrawfromthepresent investigation.
1) The amplitude of vibration increases with increase in radialload.Itindicatesthatloadenhancethevibrationlevel inthepresentexperimentalsetup.
Another method of fault existence could be achieved by inspecting the energy level at the high frequency range, wherethebearingexcitationrangeislocatedi.e.scales16 to2.Theimpactscausedbypassageofrollingelementover the defect causes an impact which excites the bearing resonantfrequency.
The high energy impacts generated by the defects in the inner raceandtheballsandcagecanbenoticedinFigure13 and14.TheImpactsareindicatedbyappearanceofstripsof bright color (high energy) occurring at regular interval. Therefore,CWTanalysisyieldsclearindicationofdifferent defectsintermsofcolorvariation.
The following section gives results obtained from the experimentsandtheoretical.
Theamplitudeofvibrationfordifferentloadingconditionfor adefect freeisaslistedinTable4.Amplitudeofvibration increasesastheradialloadonthebearingincreases.
Thekurtosisvaluesareevaluatedforthefourtestcasesand arelistedintheTable5.Foradefect freebearingkurtosis valueis3andthevaluesincreasesabove 3. The barchart clearlyindicatesthevariationofkurtosisvaluesfordifferent cases.
2) Kurtosis values used because it is a powerful tool for quantitativeevaluationofthebearingcondition.Themain advantagesofkurtosisareinsensitivetochangesinspeed andloadingbearingandanabilitytoindicatedamageextent.
3) Wavelet transform based time frequency analysis has great advantages for handling non stationary vibration signalsgeneratedinconditionmonitoringofRCB.
4) Vibration signatures generated using CWT analysis are unique and clearly differentiate the defect free, bearings withinner racedefect,outer racedefectandcombinedball and cage defect. Therefore, CWT is an effective time frequencytechniqueforRCBfaultdiagnosis.
To fine tune the experimental setup to improve defectdelectability.
To improve feature extraction and to shorten processing time of signal analysis using Discrete WaveletTransform.
Thesameexperimentcanbeconductedatdifferent speeds by including a variable frequency drive to carryoutsameworkatdifferentspeeds.
[1] N. Tandon, A Choudhury: “A review of vibration and acoustic measurement methods for the detection of defects in rolling element bearings”, Tribology International,32.8,1999,469 480.
International Research Journal of Engineering and Technology (IRJET) e ISSN: 2395 0056
Volume: 09 Issue: 07 | July 2022 www.irjet.net p ISSN: 2395 0072
[2] MadhavendraSaxena,OlvinOliverBannet,ManojGupta andR.P.Rajoria:“BearingFaultMonitoringUsingCWT BasedVibrationSignature”,ProcediaEngineering,144, 2016,234 241.
[3] PankajGupta,M.K.Pradhan:“Faultdetectionanalysis inrollingelementbearing:Areview”,MaterialsToday, proceedings4,2017,2085 2094.
[4] J.Mathew,R.J.Alfredson:“TheConditionMonitoringof Rolling Element Bearings Using Vibration Analysis”, Journal vibration acoustics, Stress and Reliability in Design,106/447,1984.
[5] N.Tandon:“Acomparisonofsomevibrationparameters for the condition monitoring of rolling element bearings”,Measurement,12,1994,285 289.
Puneeth Kumar S M.Tech(MachineDesign) LecturerinMechanicalDept. GovernmentPolytechnicMirle, Dist:Mysore,Karnataka,India

Shivaling I Mukanavar M.Sc(Engg)ByResearch LecturerinMechanicalEnggDept, GovernmentPolytechnicBelagavi. Karnataka,India.
Prashanth Kumar J. M.Tech(MachineDesign) LecturerinMechanicalDept. GovernmentPolytechnicArkere, Dist:Mandya,Karnataka,India

2021, IRJET | Impact Factor value: 7.529 | ISO 9001:2008 Certified Journal