International Research Journal of Engineering and Technology (IRJET) e ISSN: 2395 0056

International Research Journal of Engineering and Technology (IRJET) e ISSN: 2395 0056
Ms.
PritiB. Phalke.1, Prof. S. M. Bhosale.2
1 PG Student, Dept. of Civil Engineering (Environmental Science & Technology), Department of Technology ,Shivaji University , Vidyanagar, Kolhapur 416004. Maharashtra, India.
2 Assistant Professor, Dept. of Civil Engineering , Department of Technology ,Shivaji University , Vidyanagar, Kolhapur 416004. Maharashtra, India ***
Abstract - Drinking water quality is the most important to the human life. In this research paper assessment of various parameters of water from various resources inkodolivillage is carried out. Samples are collected from various water resources in the pre monsoon & post monsoon season . Collected samples are tasted and results are find out. The test results of various water quality parameters are comparedwith Indian Standard Coad for water quality( IS 10500 ). After result discussion & analysis further low cost water treatment method is suggested for upgradation of water quality .
Key Words: Drinking Water tests, Physico chemical properties, IS 10500.2012, Pre monsoon, Post monsoon, Sample Stations, Result comparison, Remedial measures.
Water plays vital role in human life. It is necessary for industry,agricultureandhumanexistenceandmanyother purposes.Thehealthywaterecosystemisdependsuponthe physico chemical and biological characteristics. Due to presence ofvarious human activities, urbanization and industrialization, the groundwater sources are degraded gradually; therefore pure, safe, healthy and odorlessdrinkingwaterisamatter of deep concern. There are various pollutants in groundwater due to seepages viz. organic and inorganic pollutants, heavy metals, pesticides, fluorides etc.Duetothesepollutantsproblemof pollutionofwaterarises.
Wateraccountsforabout70%oftheweightofahuman bodyandabout80%oftheearth’ssurfaceiscoveredbytotal water.Outofthetotal quantityofwaterpresentontheall over earth, about 97% of the earth’s water resources are locked up in the oceans and seas, this water too saline to drink and for the direct use for agriculture and industrial purposeandabout2.4%istrappedingiantglaciersandpolar icecaps.Hencenoteven1%quantityofwaterisavailablefor drinking,agriculture,domesticandindustrialconsumption. Due to increasing industrialization on one hand and exploding population on the other, the demand of water
supplyhasbeenincreasinginlargeamount.Butconsiderable partofthislimitedquantityofwater is polluted by sewage, industrial wastes and wide verities of synthetic chemicals.Thus,thequantityaswellasqualityofcleanwater supply is of vital significance for the welfare of mankind. Access to safe drinking water is key to sustainable development of country and essential to food production, qualityhumanhealth and povertyreduction.Safedrinking waterisessentialtolivinglifeandasatisfactorysafesupply must be made available to consumers. Water is therefore becomingacrucialfactorfordevelopmentandthequalityof lifeinmanycountries.Gooddrinkingwaterisnotaluxury but one of the most essential requirements of human life itself. The WHO revealed that 75% of all diseases in developing countries arise from polluted drinking water. Thus,waterqualityconcernsareoftenthemostimportant componentformeasuringaccesstoimprovedwatersources. SafeDrinkingwateristhemostimportantforlivinglife.
Waterqualityshouldbeidentifiedbythevariousphysico chemical, biological parameters. Physical parameters are Colour, Odour, pH value, Turbidity, Total Dissolved Solids (TDS). General parameters concerning substances undesirableinexcessiveAmountareAluminium,Calcium, Chloride,FreeResidualChlorine,Iron,Magnesium,Nitrate, Sulphate, Total alkalinity, Total Hardness , & other Bacteriological parameters like E coli or thermotolerant coliform bacteria & Total coliform bacteria tested by referring the standard test procedures by the IS 3025 guidelines parameters can be identified. For analyzing quality test results are compared with IS 10500.2012 guidelines.
To assess the quantity and quality of drinking waterfromvarioussourcesinKodolivillage.
To examine the levels of physico chemical and microbialparameterspresentindrinkingwater.
To compare the various result parameters with Indian Standard (IS 10500 2012) Drinking Water guidelinevalues.
Volume: 09 Issue: 07 | July 2022 www.irjet.net p ISSN: 2395 0072 © 2022, IRJET | Impact Factor value: 7.529 | ISO 9001:2008 Certified Journal | Page2736
International Research Journal of Engineering and Technology (IRJET) e ISSN: 2395 0056
Volume: 09 Issue: 07 | July 2022 www.irjet.net p ISSN: 2395 0072
To suggest low cost remedial measures for the identifiedparametersforkodolivillage.
Drinking Water quality parameters of water sample from sampling station collection, including physico chemical and microbial parametersaretakenintoconsideration.
Studyofvarioussourcesofwaterusedfordrinking intheKodolivillage.
Improving quality of existing water sources & systemusedfordrinking.
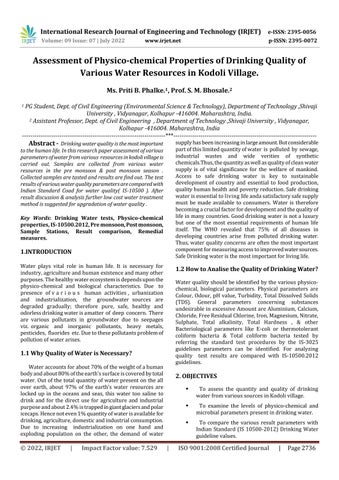
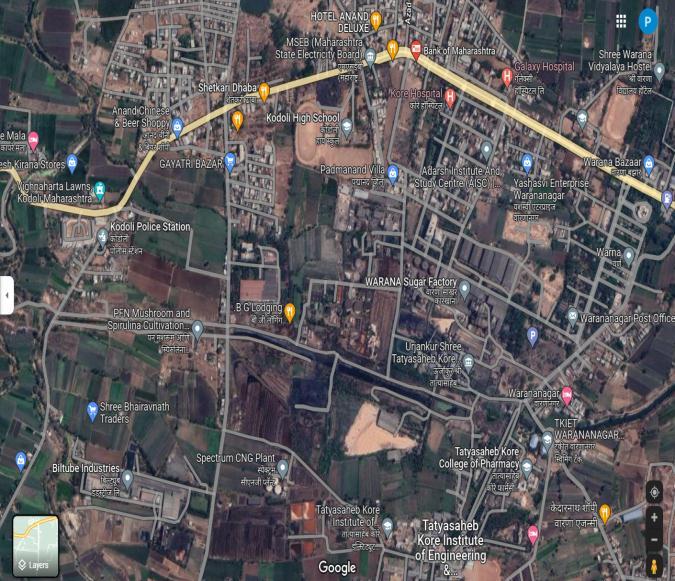
Kodoliis a census town inKolhapur districtin theIndianstateofMaharashtra.It is situated between the foothillsofPanhalafort(Ranges)andWaranaRiver.Kodoli is well developed town as per all point of view.Kodoli is located at16.88°N 74.2°E. It has an average elevation of 548metres(1797feet).
1.2
It included the important data collected through oral interview with people in Grampanchayat and different sectionsofthevillage.
TheKodolivillagewaspartitionedintotwosectionswith thehelpofmainroadnetworkasshowninFigure1.1&1.2, asSection 1§ion2.Thesesectionsoftheexamination areahadbeenvisitedforon spotevaluationofwatersupply sources and also oral interview had been conducted with occupantstofindoutthedifferentresourcesofwatersupply accessibletothem,recurrenceofsupply,availabilityandthe natureofwatersupply.
Samplesarecollectedfromvariousresourcesinsection1& Section2. Inthepresentinvestigation,total7watersamples aretaken.twosamplesfromthreewell,threefromborewell andonefrompipedriverwaterwerecollected.Selectionof sevendifferentstationswereidentifiedbasedonimportance ofthesource,wheremostofthepeoplewereutilizingthem for consuming reason. All the water samples were taken fromtherespectivesiteduringpre monsoon(April2021)as well aspost monsoonseason(August2021)fortesting in cleanedplasticpolyethylenebottlesof1literbetween10.00 a.m. 11:30 a.m. For bacteriological examination, samples were taken in sterilized bottles. The water sampling collection, methods as well as strategy were done as per standardssetdownintheIS3025guidelines
International Research Journal of Engineering and Technology (IRJET) e ISSN: 2395 0056
Table 1.1: Details of the Sources from which Samples Collected
Sr. No Sources Sample Code Location
1 PipedWater S1 KodoliWaterSupply 2 OpenWell SO1 GanapatiGalli 3 OpenWell SO2 KoteshwarMandir 4 OpenWell SO3 KapareMala
5 BoreHole SB1 Warananagar 6 BoreHole SB2 GangadharColony 7 BoreHole SB3 HousingSociety
Aftercollectingwatersamples,theywerebroughtintothe laboratories for evaluation of physical (Colour, Odour, pH value, Turbidity, Total Dissolved Solids (TDS)), Other Chemical parameters(Aluminium, Calcium,Chloride,Free ResidualChlorine,Iron,Magnesium,Nitrate,Sulphate,Total alkalinity, Total Hardness) as well as microbiological properties (E coli or thermotolerant coliform bacteria). Water temperature was determined during sample collectionatsamplingstation.Thewaterqualityparameters wereanalyzedbyusingstandardproceduresrecommended by Standard methods for the examination of water and wastewaterasperIS3025guidelines
ThedifferentsourcesofconsumingwaterinKodolivillage shown in Table 1.2 Different Drinking Water Resources UsedinKodoliVillage
One
Water Supply
Gangadh arColony Househol d Piped Water
Two Nivrutti Colony Househol d Piped Water
Manugra phroad Househol d Piped Water
Waranan agar Househol d Piped Water
Bore Hole, OpenWell Intermitt entWater Supply
BoreHole Intermitt entWater Supply
BoreHole Intermitt entWater Supply
BoreHole Intermitt entWater Supply
Thetotalwateravailabilityperdayfordifferentsourcesis representedinTable1.3asbelow
1.3
Season Resource (Open Well)
Discharge rate of water (litres/min)
Average hours of pumping inaday
Total water availability (litres/ day)
Pre Monsoon (April2021) SO1 400 6 144000 SO2 300 2 36000 SO3 600 10 360000
Total Availability 540000 PostMonsoon (August2021) SO1 400 8 192000 SO2 300 4 72000 SO3 600 10 360000
Total Availability 624000
The experimental results of various physico chemical parametersforwatersamplesarepresentedinTable1.4and Table1.5
Table 1.4 : Physico Chemical Analysis of Different Samples during Pre Monsoon Season
Paramete rs Sample Code
S1 SO1 SO2 SO3 SB1 SB2 SB3
Temperat ure 22 23 22 22 21 22 22
pHValue 7.1 7.7 8 7.2 6.8 7 7.5
Volume: 09 Issue: 07 | July 2022 www.irjet.net p ISSN: 2395 0072 © 2022, IRJET | Impact Factor value: 7.529 | ISO 9001:2008 Certified Journal
International Research Journal of Engineering and Technology (IRJET) e ISSN: 2395 0056
Turbidity 30.6 60 42.5 41 15 17 23 TDS 110 215 300 427 284 412 356 Aluminiu m 0 0 0 0 0 0 0 Chloride 15 40 60 67 80 62 70 Iron 0 0.01 0 0 0.01 5 0 0 Magnesiu m 2 3 4 4.5 5.5 4.2 5
Nitrate 0 1.25 1.4 1.1 1.2 1.5 1.1 Sulphate 34 67 75.2 55 56 53 61 TA 22 106 81 65 75 57 45 TH 90 114 200 250 300 225 286
Table 1.5 : Physico Chemical Analysis of Different Samples during Post Monsoon Season
Param eters Sample Code S1 SO1 SO2 SO3 SB1 SB2 SB3
Temper ature 20 19 19.5 21 20.5 20 19 pH Value 7 7.2 7.9 6.8 6.7 7.2 7
Turbidi ty 41.8 72 51 45 16 23 30
TDS 127 324 430 400 314 247 412 Alumini um 0 0.01 0 0 0 0 0 Chlorid e 12.5 46 78 78 50 80 79 Iron 0 0 0 0 0 0 0 Magnes ium 1.18 3.5 4 5 3 4.2 6
Nitrate 0.05 1.25 1.1 0.9 1.3 1.5 1.0 Sulphat e 32 66.6 69.8 50 56 62 60 TA 40 112 95 79 80 69 62 TH 84 126 199 268 180 220 309
Theexperimentalresultsformicrobialparameterofwater samplesarerepresentedinTable1.6andTable1.7
Table 1.6 Microbial Analysis of Different Samples During Pre Monsoon Season
Parameter Sample Code
S1 SO1 SO2 SO3 SB1 SB2 SB3
TotalColiform 18 12 17 9 17 12 11
Parameter Sample Code
S1 SO1 SO2 SO3 SB1 SB2 SB3
Total Coliform 19 9 16 11 15 13.5 15
Therangeofphysico chemicalandmicrobialparametersof differentsamplesfor thepre monsoonandpost monsoon season are given in Table 1.8 and compared with Indian standardsguidelinesIS 10500.
Sr No. Paramet ers Unit Results IS 10500 (Range) Pre Monsoon Post Monsoon
1 Tempera ture ℃ 20 23 19 21
2 pH 6.8 8 6.7 7.9 6.5 8.5
3 Turbidit y NTU 15 60 16 72 1
4 TDS mg/l 110 427 127 430 500
5 Aluminu m mg/l 0 0.01 0.03
6 Chloride mg/l 15 80 12.5 90 250
7 Iron mg/l 0 0.015 0 0.3 8 Magnesi um mg/l 2 5.5 1.18 6 30
9 Nitrate mg/l 0 1.5 0.05 1.5 45
10 Sulphate mg/l 34 76 32 70 200 11 TA mg/l 22 106 40 112 200 12 TH mg/l 90 300 84 309 200
13 Total Coliform MPN / 100 ml
9 18 9 19 Shallnot detectabl einany 100ml sample
Aspertestscarriedoutandaccordingtoresultsmentioned abovesuggestionsaregiven
Thereisnorequirementofupgradationthesystemasthere istreatmentunitisinstalledalready.
Volume: 09 Issue: 07 | July 2022 www.irjet.net p ISSN: 2395 0072 © 2022, IRJET | Impact Factor value: 7.529 | ISO 9001:2008 Certified Journal | Page2739
International Research Journal of Engineering and Technology (IRJET) e ISSN: 2395 0056
Only Turbidity parameter is concern but it can also be treatedusingAlumDosageatindividualhouses.Resultfor turbidity parameter is showing turbidity present in post monsoonwatersamples
For less turbid water & medium turbid water 10 20mg/l alumdosescanbeappliedtosettledownthesolidparticles inthewater&toreducetheturbidity.
Another Low cost treatment can be applied that is use of Moringa oleifera seed powder decreases in turbidity of groundwaterwithincreaseddoseat50,100and150mg/l respectively.
Accordingtotheresultsofphysico chemicalpropertiesafter comparison with IS 10500 guidelines Hardness Is the concerning factor. Hardness should have to remove or reducedbyapplyingwatersofteningprocess.
Following are the methods that can be used for Reducing Waterhardnessathome
1. Resinbasedwatersoftener
2. WaterEnhancer 3. WaterConditioner
4. Antiscalantsystems
5. MagneticWaterSoftner
PrimaryWaterSupplySysteminthestudyarea is developedwell.Butfortheturbityparameter
Environmental & Analytical Toxicology, Volume 6, Issue 2, 1000356
[2] Abdulrasoul Al Omran, Fahad Al Barakah, Abdullah Altuquq, Anwar Aly and MahmoudNadeem, “Drinking water quality assessment and water quality index of Riyadh,SaudiArabia”, Water Quality Research Journal of Canada · August 2015, vol 46 No.1 2011
[3] Aryal J,1 Gautam B,2 Sapkota N1, “Drinking Water Quality Assessment”, J Nepal Health Res Counc, 2012 Sep;10(22):192 6
[4] Rajkamal R.1, Muthu Kumar2, Madhan Raj1, Muthu Rajesh3, Jaya Kiruthiga4, JoyBazroy5,“Assessmentof waterqualitystandardsinthevillagesofKanchipuram district,Tamil Nadu, India”, International Journal of Community Medicine and Public Health, pISSN 2394 6032 | eISSN 2394 6040
[5] TaheraAkter1,FatemaTuzJhohura1,FahmidaAkter1, TridibRoyChowdhury1,SabujKantiMistry1,Digbijoy Dey3,MilanKantiBarua3,MdAkramulIslam2,3and Mahfuzar Rahman1, “Water Quality Index for measuringdrinkingwaterqualityinruralBangladesh: acrosssectionalstudy”, Journal of Health, Population and Nutrition (2016) 35:4
[6] MangaleSapanaM.,ChondeSonalG.andRautP. D.(2012), “UseofMoringaOleifera(Drumstick)seed asNaturalAbsorbentandanAntimicrobialagentfor Ground water Treatment”,Journal of Recent Science, Vol.1(3), March(2012),ISSN 2277 2502
Useof Moringaoleiferaseedpowderdecreasesthe turbidity.
Secondary Water Resources Open wells and Bore Wells;drinkingqualityoftheseresourceschecked bytestprocedureasperIS3025guidelines.
For Secondary Resources as per results find out Hardness of the water is not in the range of acceptablelimitasperIs10500guidelines.
Hardnessofthewatercanbereducedathomebe applyingvariouswatersofteningmethodssuchas resin based water softening method, water enhancingmethod,waterconditioning,antiscalant system,magneticwatersofteningmethods.
[1] Amanial Haile Reda*, “Physico Chemical Analysis of DrinkingWaterQualityofArbaminchTown”, Journal of
Volume: 09 Issue: 07 | July 2022 www.irjet.net p ISSN: 2395 0072 © 2022, IRJET | Impact Factor value: 7.529 | ISO 9001:2008 Certified