International Research Journal of Engineering and Technology (IRJET) e-ISSN: 2395-0056

Volume: 09 Issue: 07 | July 2022 www.irjet.net p-ISSN: 2395-0072
International Research Journal of Engineering and Technology (IRJET) e-ISSN: 2395-0056
Volume: 09 Issue: 07 | July 2022 www.irjet.net p-ISSN: 2395-0072
Computer Science Department, Govt. Home Science College, Jabalpur (M.P.), India ***
Abstract Support Vector Machine or SVM is one of the most popular supervised learning algorithms, which is used for classification as well as regression problems. Support vector machines (SVM) have a limited performanceincreditscoringissuesduetotheimbalanced datasetsinwhichthenumberofunpaidislowerthanpaid loans.Inthiswork,wedevelopedanSVMmodelwithmore kernelsonasetofimbalanceddataandsuggestedtwodata re sampling alternatives random over sampling (ROS) and synthetic minority oversampling technique (SMOTE). The aim of this work is to explore the relevance of re sampling data with the SVM technique for an accurate credit risk prediction rate to the class imbalance constraint. The performance criteria chosen to evaluate the suggested technique were accuracy, sensitivity specificity, errortypeI, errortypeII,G meanandthearea underthereceiveroperatingcharacteristiccurve.
Keywords support vector machines, credit risk assessment, random over sampling, imbalanced data sets,SMOTE,performancecriteria.
Credit scoring plays an important role for banking institutionstoimprovetheirriskassessmentmeasurement. It has been one of the main fields of application of classification issues and attracted growing attention in recent years (Crook et al., 2007). The construction of a powerful credit scoring model is always an exciting challenge because the possibilities for further improvements are almost endless, especially due to the continuous increase in the complexity of parameters that determinesolvency.
The literature has shown that credit scoring is an accurate technique for evaluating and measuring credit risk.Manydefinitionsofcreditscoringhavebeenproposed by researchers and fully converge to the same principle, which is the detection of the risk of non repayment of a loan through the prediction of client default probability (Crook et al., 2007; Hand and Henley, 1997; Thomas et al., 2005). Many modeling alternatives, such as traditional statisticalmethodsandnon parametricmethodshavebeen developed to manage credit scoring tasks. Then, more powerful models based on artificial intelligence have become popular among researchers. In fact, in practical credit risk assessment applications, most forecasting models often make wrong decisions because of a lack of defaultdata.
Thecontextofimbalanceddatasetclassificationposesa serious challenge for researchers in credit scoring. The main problem is that the number of insolvent clients is usually much smaller than the number of those who are creditworthy. Therefore, the classifier tends to promote healthyclientsinthemajorityclass.Inotherwords,healthy clients could be over represented in the model and can be identified with high accuracy, but insolvent clients, the minority class, are not properly identified. However, to minimize credit risk, it is more important to identify insolventclients.
Thispaperpresentsarangeof experimentsona credit datasetthathasbeenartificiallymodifiedbyusingtwore sampling techniques [random over sampling (ROS) and synthetic minority oversampling technique (SMOTE)] and aforecastingmethod.Themethodweimplementedhereis the support vector machines (SVM) with multiple kernels. Results were evaluated according to their matrix of confusion and the area under the receiver operating characteristic (ROC) curve (AUC). Performance measures widelyusedincreditriskpredictionsystemsare:accuracy, typeIerror,typeIIerrorandAUC(Verikasetal.,2010).
Credit scoring is a system aimed at ranking credit applications: Those that have a high probability to meet the financial obligations are classified as ‘good’ and those withalowprobabilityareclassifiedas‘bad’(Akkoç,2012; Leeetal.,2002;West,2000).Thescoreisdefinedasatool for early detection of financial difficulties of borrowers. It drawsonastatisticalapproachandleadstoaprobabilistic risk analysis. A score is a risk rating, or a default probability.Creditscoringisatechniquefordetermininga linearcombinationofthefollowingform: Z α1 R1 α 2 R2 αn Rn
With Z: borrower score, Ri: Ratio i of the borrower, α: the weightingcoefficientoftheratio Ri.
Thomas et al. (2002) defined credit scoring as a set of decision models and techniques that help lenders in the decisiontograntcredit.Theobjectiveofthesemodelsisto assign a score to a potential borrower to estimate the futureperformanceoftheirloan.Itismainlyusedbybanks to predict the probability of default on individual
consumer credits and classify borrowers into default and non default classes. In addition, Abdou et al. (2008) definedcreditscoringasanestimationtechniquebasedon quantitative data used by financial institutions to assess thecreditworthinessofcompaniesandindividualsseeking loans.Inotherwords,thismethodisessentiallyadecision support tool that enables the bank to minimize the risk of insolvencyasitprovidescontinuousandrapidmonitoring ofcreditapplications.Harris(2013)reportedthatthemain idea of credit scoring involves discriminating between good and bad loan potential borrowers. This is done throughquantitativemeasuresofperformanceandofpast loan features to predict the performance of future loans (Thomasetal.,2005).
SVM are widely used for classification and regression problems because of their promising empirical performance.Recently,manystudieshaveusedtheSVMin thecreditscoringwithpromisingresults.
Huang et al. (2007) used three strategies to build a hybridcreditscoringmodeltoassesstheapplicant’scredit score from its input characteristics. They proposed a GA SVM hybrid strategy combining genetic algorithms (GA) with SVM. This strategy can simultaneously perform the tasks of feature selection and model parameter optimization. Harris (2013) used the SVM algorithm to develop credit scoring models of the Barbados Credit Union. This quantitative approach to credit risk assessment in financial institutions in Barbados is currently an underutilized practice (or non existent). The credit union conducted this study using the traditional assessment approach when making credit authorization decisions. An analysis of the institution’s annual reports indicates that this is a serious situation with regard to doubtfulreceivables.Tosettlethissituation,Harris(2013) developed a number of scoring models. The results presented in his study suggest that the use of appropriate scoringmodelsisdevelopedandimprovestheinstitution’s decision makinginloangranting.
Liet al.(2006) developed a credit scoring model using SVM to identify potential applicants for loans. The results showed that the SVM model exceeded the artificial neural networks model in terms of generalization. Huang et al. (2004) studied the performance of the SVM approach in predicting credit scoring. They compared the results generated by SVM with the back propagation neural networks. However, a slight improvement of SVM was observedcomparedtoneuralnetworks.
We opted in this research for studying the management of loans to Tunisian companies in different sectors. The experimental data used for this research are collected from a Tunisian commercial bank.Thesamplecontained408companiesindifferent sectors of activity, of which 300 were classified as creditworthy and 108 as non creditworthy. The dependent variable is a binary variable with two values: 1 to creditworthy borrowers and 0 for non creditworthy borrowers. The tendency to work with twovalueswasthesubjectofnumerousstudies(Leeet al., 2002; Akkoç, 2012; Abdou et al., 2008; Bekhet and Eletter, 2014). The dependent variable 1/0 was used for modelling purposes. Companies that correctly repaid their loans and were never late in payment for 90 days or more were classified as solvent. Those who defaultedfor 90 days or more atany time in the lifeof theloanwereclassifiedasinsolvent.
Table 1 Variablesofthestudy
Variables
Measurement of variables
Financialprofitability Netincome/netequity
Operatingprofitability Grossoperating surplus/turnover
Economicprofitability
Operating income/economic assets
Netprofitability Netincome/sales
V5
V6
Financialautonomy
WC
coverage
Solvency Netcapital/totalassets
Assetcoverage Netcapital/fixedassets
Long/mediumterm debt/fixedassets
Debt ratios
International Research Journal of Engineering and Technology (IRJET) e ISSN: 2395 0056
V11 Financialdependence Longandmediumterm debt/permanentequity
V12 Repaymentcapacity
V13 Debtratio Financial charges/turnover
V14 Financialburden
Longandmedium term/cashflownet debt
Financial expenses/gross operatingsurplus
V15 Workingcapitalratio Turnover/totalfixed assets
V16 Inventoryturnoverratio Turnover/netstocks Other variables
V17 Devotedturnover Movement/sales
V18 Shareoffunding
V19 Studydurationofacredit report Log(studyperiod)
V20 Corporatebanking relationship 1iftherelationship length≥15months;0 duration otherwise
V21 Guarantees Log(guarantees)
V22 Sizeofthecompany Log(turnover)
V23 Score:creditlinenumber Log(score)
V24 Ownershipstructure
Bank commitment/banking systemcommitment
Givenatrainingsampleintheformofpairs{yi, xi} with i = 1, …, n xi R2 and yi {+1, 1}. The xi are vectors of attributes that may belong to two possible classes: a positiveclass,denoted+1andanegativeclassdenoted 1. The yi therefore represents labels or targets associated with xi.Then,thevariable y takesthevalue 1todesignate a creditworthy borrower and 1 to designate a non creditworthyborrower.
The main objective of SVM is to find an optimal hyper plane separator capable of separating data and maximizingthemarginbetweenthesetwoclasses{+1, 1}, inaclassificationtask.
1iftheofficerholds morethan50%ofthe capital; otherwise
V25 Legalform 1=SARL;0otherwise
Thefirststepinthedevelopmentofcreditscoring model is to decide upon the input variables. To obtain an accurate credit scoring of quantitative financial data and qualitative data are needed. The following 25 variables (Table 1) are expected to affect the loan repayment capacity of which 03 are binary variables and 22 are quantitativevariables:
We present the SVM essential concepts in the simplest case, to obtain a separating hyperplane. In the case of a linear SVM, the score can be represented as a linear combination of the credit applicant characteristics, (e.g., employmentstatus,maritalstatus,etc.)multipliedbysome weight.Theequationiswrittenasfollows:
Z w1 x1 w2 x2 ………… wn xn b
where x is the vector representing the characteristics of the individual, n is the dimension of the input vectors, w and b aremodelparameters.
Volume: 09 Issue: 07 | July 2022 www.irjet.net p ISSN: 2395 0072 © 2022, IRJET | Impact Factor value: 7.529 | ISO 9001:2008 Certified Journal | Page2662
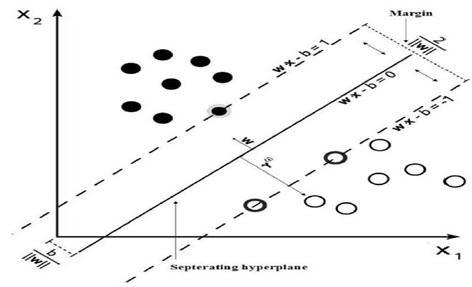
Theseparatinghyperplaneisrepresentedbythefollowing equation: h(x) wT x b
The hyper plane wTx + b represent a hyper plane separating the two classes and the distance between the hyper plane and the closest example is called the margin. Points on the boundaries of the margin are called support vectors. The middle of the margin is called optimal hyper plane separation. The region which lies between the two hyper planes wTx + b = 1 and wTx + b = +1 is called the generalizationregionofthelearningmachine.
SVM train the parameters w and b from previous training examples of clients that the financial institution had collected over time. This database is composed of a number of examples of clients. Therefore, from a geometrical point of view, the calculation of the values w and b means finding a hyper plane that separates good clients and bad ones. To do so, the SVM maximize the margin between the hyper plane and its closest observations, which are the support vectors from the trainingdata x.
Since this equation satisfies the conditions Karush-KuhnTucker (KKT), the condition gi(w) ≤ 0 is an active strain whichmeansitisaninequality.
SVMs have several advantages: they have a good capacityforgeneralization. Theycangeneralizeeffectively even when they are trained with a few examples. They do notrequireanybackgroundonthepossibledistributionof the underlying datasets (Chandra et al., 2010). The SVM method requires less effort to designate the appropriate architecture (small number of parameters to be adjusted or estimated). Moreover, it does not require assumptions aboutthestructureofthedatasuchasthenormalityofthe distribution of each of the selected variables and the assumption of independence between them (Lee, 2012). TheSVMisbasedontheprincipleoffindingtheseparating plane of the largest margin (a hyper plane). This principle minimizes the risk of over learning of training data and provides a very powerful generalization capability in classification(Bhattacharyyaetal.,2011).
In the case of imbalanced datasets, the prediction methods are dominated by the majority class and, consequently, they poorly classify the observations of the minorityclass(VasuandRavi,2011).Twotechniqueswere considered in order to restore sampling balance: ROS and SMOTE until the two classes are almost equally represented.Theselectedsamplingstrategiesarethemost popular because they are independent of the underlying classifierandcanbeeasilyimplemented.
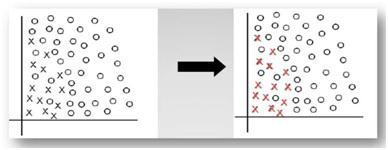
A way to rebalance the data sets is the random replication of the number of individuals belonging to the minority class as illustrated in Figure 3. The risk of this simplistic approach is to slow the algorithms by adding individuals, while providing models unable to make generalizations (risk of over training). Previous research (Japkowicz, 2000) discussed over sampling with replacement and noted that this does not improve the recognitionofminorityclasssignificantly. Figure 3 IllustrationoftheprincipleROS(seeonline versionforcolours)
In this paper, the data set is randomly divided into 70%trainingand30%testdata.Thetrainingdataareused tobuildthepredictionmodelandthetestingdataservesto assess the prediction model efficiency. In fact, the imbalanced training dataset was first used as the input of the SVM algorithm. The second and third procedures concerned ROS and SMOTE. Here, our input dataset was resampled by balancing it in a pre treatment step. The obtained balanced dataset was used as the input for the SVMalgorithm
To evaluate different techniques, we used the following performance indicators to compare the results: accuracy (the fraction of correctly classified borrowers), sensibility (the fraction of credit worthy borrowers correctly classified by the classification model), specificity (the fraction of non credit worthy borrowers correctly classified by the classification model), type I error (the fractionofborrowerswronglyclassifiedasinsolvent),type II error (the fraction of borrowers wrongly classified as solvent), G mean (the classification performance balance betweenmajorityandminorityclasses)andareaunderthe ROC curve, i.e., AUC expressed as a percentage of the maximum possible area under an ROC curve. The ROC curve serves to visualise, organise and select classifiers based on their trade off between false positive rate and true positive rate (sensitivity) (Maalouf and Trafalis, 2011). TP FN
Accuracy TP TN TP TN FP FN True positive rate (Sensitivity) TP
True negative rate (Specificity) TN TP FN
TN FP
G mean Sensitivity Specificity False negative rate (Error I) FN
False positive rate (Error II) FP TN FP
where TP (true positive) refers to the number of solvent borrowers correctly classified, TN (true negative) refers to the number of insolvent borrowers correctly
Volume: 09 Issue: 07 | July 2022 www.irjet.net p ISSN: 2395 0072
classified, FP (false positive) refers to the number of insolvent borrowers classified as solvent and FN (false negative) denotes the number of solvent borrowers classifiedasinsolvent.
The optimization of the parameters is an important step in the SVM method. Through testing all kernel functions of the original database and the balanced data, the SVM technique appears most efficient in radial kernel ascomparedtootherkernels;accuracyrankingisthemost notable. Most often, the credit risk prediction literature applies the RBF kernel because of its versatility, good overallperformanceanditssmallnumberofparameters(C and γ)(Bhattacharyyaetal.,2011).
Accuracy Sensitivity Specificity
Comparing the performance indicators of the SVM RBF method before and after balancing data allowed us to conclude that the rate of correct classification was generallyhigh acrossall of imbalanced data. Thisincrease isduetothefactthatthisdatasetheavilyoverrepresented good loans (sensitivity is of the order of 99.52% for the training set and 91.11% for the testing set) and under represented the number of bad loans (the specificity is in the order 80.26% for the training set and 59.38% for the testing set). This technique shows its inaccuracy to correctlyclassifyminoritycasesincaseofclassimbalance. MaaloufandTrafalis(2011)mentionedthataccuracyisthe most commonly used metric to evaluate the accuracy of theclassifier.However,astheresultsshow,accuracyrelies more on the majority class and therefore it should not be usedasameasureofaccuracyforimbalanceddata.
Type I Type II error error
SVM RBF Training 94.410% 0.9952 0.8026 0.0048 0.1974 Test 82.790% 0.9111 0.5938 0.0889 0.4063
SVM Training 81.120% 0.9905 0.3158 0.0095 0.6842 polynomial
Test 80.330% 0.9556 0.375 0.0444 0.625
SVM linear Training 84.270% 0.9905 0.4342 0.0095 0.5658 Test 80.330% 0.9556 0.375 0.0444 0.625
SVM Training 75.170% 0.9476 0.2105 0.0524 0.7895 sigmoid
Test 77.870% 0.9556 0.2813 0.0444 0.7188
SVM RBF Training 98.81% 0.9857 0.9904 0.0142 0.0095 Test 92.22% 0.9111 0.9333 0.0889 0.0667
SVM Training 97.86% 0.981 0.9762 0.019 0.0238 polynomial
Test 91.11% 0.9 0.9222 0.1 0.0778
SVM linear Training 82.62% 0.8524 0.8 0.1476 0.2 Test 75.00% 0.7889 0.7111 0.2111 0.2889
SVM Training 71.19% 0.7667 0.6571 0.2333 0.3429 sigmoid
Test 68.33% 0.9 0.4667 0.1 0.5333
SVM RBF Training 99.05% 0.9934 0.9867 0.0066 0.0132
Test 92.11% 0.9462 0.8878 0.0538 0.1122
SVM Training 84.28% 0.9305 0.7257 0.0695 0.2743 polynomial
Test 84.21% 0.9308 0.7245 0.0692 0.2755
SVM linear Training 84.28% 0.9172 0.7434 0.0828 0.2566
Test 82.46% 0.9077 0.7143 0.0923 0.2857
SVM Training 71.02% 0.8146 0.5708 0.1854 0.4292 sigmoid
Test 71.49% 0.8538 0.5306 0.1462 0.4694
The sensitivity value was most similar with the various databases (imbalanced and balanced). However, the results were not significant in terms of the specificity using the original data due to class imbalance (73.53%: 26.47%).Inimbalancedclassification,theminorityclassis particularlysensitivetoclassificationerrorsbecauseofthe low number of examples (Moreno Torres and Herrera, 2010). In the most extreme cases, a single misclassified example of the minority class can lead to a significant decline in performance. So, by introducing the sampling methods (ROS and SMOTE) beside the SVM, we achieved betterresultsintermsofspecificityusingtheROSmethod (99.04% for the training set and 93.33% for the testing set) and SMOTE method (98.67% for the training set and 88.78%forthetestingset).
The use of resampling techniques can be a good solutiontotheproblemofclassimbalance.Theyconstantly improved the forecasting model performance face to imbalanced data. They also had a higher capacity to identify insolvent clients compared to imbalanced data. Also,TheSVMmethodhasahighsensitivitytoimbalanced datawhenusedformodelingthebankcreditrisk.
Our resultstake intoaccounta single set ofcreditdata because of the confidentiality of the data. However, it would be more beneficial to generalise the experimental results beyond the properties of one empirical dataset. In fact, Crone and Finlay (2012) obtained similar credit scoring datasets across banks and countries. They also claimed that results can be more representative if the sample size and balance are controlled. However, the absence of sufficient additional data sets leads to clear limitationsofanyempiricalexperiment.
This work contributed to the improvement of credit scoringsystemsandthereforeincreasedthedeploymentof samplingstrategiesalongside smart techniques thatmimic human thought and manage the complexity of real world
ISSN: 2395 0056
Volume: 09 Issue: 07 | July 2022 www.irjet.net p ISSN: 2395 0072
problems. Therefore, any improvement in financial forecasting systems can be translated into huge saving (West, 2000). Because of the huge size of the credit markets, even small improvements in classification accuracy could significantly reduce the misclassification costsfacedbybanks
Weproposedinthisstudyanewapproachusingamethod of classification and sampling strategies to address the problem of evaluation of client credit at a Tunisian bank, taking into consideration the problems of the class imbalanceandimprovedtheaccuracyof the identification ofinsolventclients.
Although creditworthy clients are identified with great precision, we aimed at finding more effective and efficient methods to solve the problem of evaluation of insolvent credit clients less represented in the sample. In this work, we introduced the SVM forecasting method on two sampling strategies: ROS and SMOTE. The proposed methods were applied to solve a credit risk problem in a bank. We clarified that the proposed approaches can identify insolvent clients more efficiently than the original data.Throughthediscussionofourstudy,itwasconfirmed that the treatment methods of imbalanced data sets with the intelligent technology (SVM) can be applied to solve practicalcreditproblems.
Ourresultsprovidedaninterestingperspectiveon theroleof samplingstrategiesandartificial intelligence in theTunisiancreditmarketandtheirimpactoncreditrisk. Inordertoimprovetheprocessofmanagingthecreditrisk of banks in Tunisia, it would be wise to set up templates andsamplingstrategiesbesideclassificationtechniquesto monitorandcontrolthecreditgranted.
Asaperspective,thecost sensitivelearningisalso a potential alternative for modeling and predicting credit risk in a situation of imbalanced data. This needs to be thoroughly investigated because it matches the characteristicsofreal worldcreditriskforecasting.
[1] Akkoç, S. (2012) ‘An empirical comparison of conventional techniques, neural networks and the three stage hybrid adaptive neuro fuzzy inference system (ANFIS) Model for credit scoring analysis: the case of Turkish credit card data’, European Journal of Operational Research,Vol.222,No.1,pp.168 178.
[2] Bhattacharjee, B., Sridhar, A and Shafi, M. (2017) ‘An artificial neural network based ensemble model for credit risk assessment and deployment as a graphical user interface’, International Journal of Data Mining Modelling and Management,Vol.9,No.2,pp.122 141.
[3] Bhattacharyya, S., Jha, S., Tharakunnel, K. and Westland, J.C. (2011) ‘Data mining for credit card fraud: a comparative study’, Decision Support Systems, Vol.50,No.3,pp.602 613.
[4] Chandra, D.K., Ravi, V. and Ravisankar, P. (2010) ‘Support vector machine and wavelet neural network hybrid:applicationtobankruptcypredictioninbanks’, International Journal of Data Mining Modelling and Management,Vol.2,No.1,pp.1 21.
[5] Chawla, N.V., Bowyer, K.W., Hall, L.O. and Kegelmeyer, W.P.(2002)‘SMOTE:syntheticminorityover sampling technique’, Journal of Artificial Intelligence Research, Vol.16,No.1,pp.321 357.
[6] Crone, S.F and Finlay, S. (2012) ‘Instance sampling in credit scoring: an empirical study of sample size and balancing’, International Journal of Forecasting,Vol.28, No.1,pp.224 238.
[7] García, V., Marques., A.I and Sanchez, J.S. (2012) ‘Improving risk predictions by preprocessing imbalanced credit data’, 19th International Conference on Neural Information Processing (ICONIP 2012), Proceedings,pp.68 75.
[8] Hand, D.J and Henley, W.E. (1997) ‘Statistical classification methods in consumer credit scoring: a review’, Journal of the Royal Statistical Society: Series A (Statistics in Society),Vol.160,No.3,pp.523 541.
[9] Huang, Z., Chen, H., Hsu, C.J., Chen, W.H. and Wu, S. (2004) ‘Credit rating analysis with support vector machines and neural networks:a market comparative study’, Decision Support Systems, Vol. 37, No. 4, pp.543 558.
[10] Kou, G., Peng, Y and Wang, G. (2014) ‘Evaluation of clustering algorithms for financial risk analysis using MCDM methods’, Information Sciences (in press), http://dx.doi.org/10.1016/j.ins.2014.02.137.
[11] Lee, M.C. (2012) ‘Enterprise credit risk evaluation models: a review of current research trends’, International Journal of Computer Applications, 0975 8887,Vol.44,No.11,pp.37 44.
[12] Marqués,A.I.,García,VandSánchez,J.S.(2013)‘Onthe suitability of resampling techniques for the class imbalance problem in credit scoring’, Journal of the Operational Research Society, Vol. 64, No. 7, pp.1060 1070.
[13] Moreno Torres, J.G. and Herrera, F. (2010) ‘A preliminary studyonoverlappingand data fracturein imbalanced domains by means of genetic programming basedfeatureextraction’,in Proceedings of the 10th International Conference on Intelligent
International Research Journal of Engineering and Technology (IRJET) e ISSN: 2395 0056
Volume: 09 Issue: 07 | July 2022 www.irjet.net p ISSN: 2395 0072
Systems Design and Applications (ISDA’10), Cairo, Egypt,pp.501 506.
[14] Thomas, L.C., Oliver, R.W and Hand, D.J. (2005) ‘A survey of the issues in consumer credit modelling research’, Journal of the Operational Research Society, Vol.56,No.9,pp.1006 1015.
[15] Vasu, M and Ravi, V. (2011) ‘A hybrid under sampling approachforminingunbalanceddatasets:applications to banking and insurance’, International Journal of Data Mining Modelling and Management, Vol. 3, No. 1, pp.75 105.
[16] Verikas,A.,Kalsyte,Z.,Bacauskiene,M.andGelzinis,A. (2010) ‘Hybrid and ensemble based soft computing techniques in bankruptcy prediction: a survey’, Soft Computing,Vol.14,No.9,pp.995 1010.
[17] Zhang, D and Zhou, L. (2004) ‘Discovering golden nuggets: data mining in financial application’, IEEE Transactions on Systems, Man and Cybernetics, Vol. 34, No.4,pp.513 522.
[18] Zhou, Z.H and Liu, X.Y. (2010) ‘On multi class cost sensitive learning’, Computational Intelligence, Vol.26, pp.232 257.
2022, IRJET | Impact Factor value: 7.529 | ISO 9001:2008 Certified Journal | Page2666