International Research Journal of Engineering and Technology (IRJET) e ISSN: 2395 0056

Volume: 09 Issue: 07 | July 2022 www.irjet.net p ISSN: 2395 0072
International Research Journal of Engineering and Technology (IRJET) e ISSN: 2395 0056
Volume: 09 Issue: 07 | July 2022 www.irjet.net p ISSN: 2395 0072
1Student, Department of Civil Engineering, Late G. N. Sapkal College of Engineering, Nashik, Maharashtra, India.
2Assistant Professor, Department of Civil Engineering, Late G. N. Sapkal College of Engineering, Nashik, Maharashtra, India. ***
Abstract The purpose of this experimental work is to study the flexural and ultimate behavior of ferrocement lightweight beam by using A.A.C blocks. The investigations were carried out on R.C.C and ferrocement beams of size 150 mm X 150 mm X 700 mm. The concrete used for the R.C.C consisted of grade M25. While rich mortar was used for the construction of ferrocement beams. The central portion of the ferrocement beam was kept hollow and A.A.C bricks were installed in it. The results obtained from the experimental study indicated that the ferrocement beam gave intimation prior to the failure in the form of first crack whereas the R.C.C beam resulted in sudden failure as compared to the ferrocement components. Similarly, variations in deflection were seen between R.C.C. and ferrocement specimens. It was observed that Ferrocement specimen gave more deflection than the R.C.C counterpart. The maximum load carried by the R.C.C specimen was noted to be 85.40 kN whereas the maximum deflection was observed to be 7.83 mm. in case of ferrocement the maximum load and deflection were observed to be 62.10 kN and 15.69 mm respectively.
Key Words: Ferrocement, Lightweight, Flexural Strength, Flexural cracks, Crack width limitation, Ductility.
R.C.C.structuresinthepasthavebeenseentoshowunexpectedfailurepatternfarbeforetheexpiryoftheiractualservice expiry.Tocounterthisandmanyotheraspectsoftheconstructionthisexperimentalstudyfocusesonferrocementbeamsandits feasibilityforuse.Thestudyaimsatderivingandestablishingthebehavioralpatternofferrocementbeamsundersinglepoint load for flexure. It was accomplished by using mortar over welded wire mesh instead of conventional concrete and steel reinforcements.Thestudyaimedatnotonlydeterminesthebehaviorbutalsotoreducetheoverallcostofconstructingabeam. As ferrocementa technology does not requireconcreteas mortar is used foritscasting. Wire mesh is opted forsteel asa reinforcingmember.Therequirementofformworkisruledout,thusreducingtheoverallcost.Theoverallaimofthepresent studyistoinvestigateandimprovetheunderstandingandflexuralbehaviorofcompositebeamsandtherebystudiesother effectivealternativesfortheR.C.Csystemthatisalreadyinpractice.Experimentaltestswereperformedtoinvestigatethebeam designedinsuchawaythattheirfailurewillbeexpected.Thebeamwillbeloadedinonepointloadsystemandloadwillbe applieduntilthecracksaredeveloped.
Flexuralcracksonthesideofthebeamstartattensionfaceandextend,uptotheneutralaxis.Crackwidthisseentobehuge inthetensionsideandissupposedtoreduceaswemoveawayfromitsorigin.Thecracksherearesupposedtobeuniformly spacedinthemostheavilyloadedportionofthebeam.Asweknownearthemidspanassaggingandoverthesupportsin hogging.Themaincausesofflexuralcracksinabeamareexternalloadwhichdirectlyresultinbendingcausingflexuraland diagonalcracks.
Themeasureoftensilestrengthofabeamorslabsiscalledasflexuralstrength.Ittypicallyidentifiestheamountofstressand forceanunreinforcedconcretebeamcanstandsothatitisabletoresistfailuresissimplyreferredtoasflexuralstrength. Commonlycalledasbendingstrength/modulusofrupture/fracturestrength.
It is essential thatthe maximum valueofa crack should be less than0.1 mm for non corrosiveand0.5 mmfor corrosive environmentsandwaterretainingstructures.Thevalueforthecrackwidthinasquaremeshcanhoweverbepredicted.
International Research Journal of Engineering and Technology (IRJET) e ISSN: 2395 0056
Volume: 09 Issue: 07 | July 2022 www.irjet.net p ISSN: 2395 0072
Inthecurrentexperimentalstudy6beamsofsize150mmX150mmX700mmhavebeenadopted.Threeofwhicharemade ofR.C.Cwhiletheremaining3areferrocementspecimenandeachbeamwillbesubjectedtosinglepointloadingintheuniversal testingmachine.Loadwasgraduallyapplieduntil thefailurehadoccurred inthebeam.Thefirstcrack loadaswellasthe ultimateloadcarriedbythebeamalongwithitsdeflectionhadbeennoted.
Inthecurrentexperimentalstudy6beamsofsize150mmX150mmX700mmhavebeenadopted.Threeofwhicharemade ofR.C.Cwhiletheremaining3areferrocementspecimenandeachbeamwillbesubjectedtosinglepointloadingintheuniversal testingmachine.Loadwasgraduallyapplieduntil thefailurehadoccurredinthebeam.Thefirstcrack loadaswellasthe ultimateloadcarriedbythebeamalongwithitsdeflectionhadbeennoted.
Thebasicconstituentsforconcretearecement,sandandaggregate.Thesematerialslistedearlierareallheavyinnature.The consumptionoftheconcreteisthehighestintheworldasitisknowncomparedtoanyothermaterialotherthanwater.The compressivestrengthoftheconcreteisgoodincompressionandsteelbearsgoodintension.Asitisknownthatabeamisa structuralmemberthatresiststheloadsappliedonitsaxis.Theprimarymodeoffailureinabeamisobservedtobebending. Thisloadappliedresultsinreactionforcesgeneratingatthesupport.Totaleffectoftheforcesonthebeamistoprepareforces andmomentswithinthebeam.Thebeamsarecharacterizedbytheirmannerofsupport,profile,Length&material.
Thetesthasbeencarefullydesignedsothatthepropertiesofthematerialsrequiredforthecastingofthespecimensare determined. At the same time the flexural behavior ofthe beam is noted. The complete program consists of the following components:
1. Determination of the basic properties of the materials suchas cement, sand, aggregate also steel as per the Indian standardspecifications.
2. Castingofthreebeamsofsize(150mmX150mmX700mm)usingM25gradeconcrete,followedbycastingofthree beamsofsimilarsizeusingrichmortaraspertheIndianstandardspecifications.
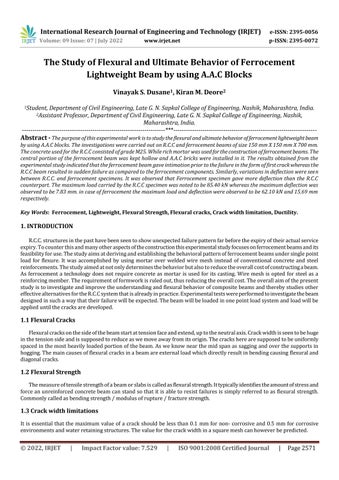
3. The layout of the test set up used for the experiments is shown in Fig. 1. All tests were carried out under simply supportedcondition.Theloadwasappliedbymeansofsinglepointloadatcentre.
4. Computationofthefirstcrackloadsandtheultimateloadcarriedbythebeamatthesametimedeterminingtheloadand deflectionrelationofthebeams.
Fig 1:OverviewoftheultimatetestsetupinUTM.
International Research Journal of Engineering and Technology (IRJET) e ISSN: 2395 0056
Volume: 09 Issue: 07 | July 2022 www.irjet.net p ISSN: 2395 0072
Cement,fineaggregates,coarseaggregate,reinforcingbars,weldedwiremesh,A.A.C.blocksareusedinthedesigningand castingofbeams.Thespecificationsandpropertiesofthematerialsareasunder:
Cementofgrade53wasusedforthisstudy.thephysicalpropertiesofthematerialasobtainedfromvarioustestsareaslisted andalltherequiredtestswerecarriedoutinaccordancewithprocedurelaiddowninIS:8112 1989.
Locallyavailablesandwasusedasfineaggregateinthecementmortarandconcretemix.Thephysicalpropertiesandsieve analysisofresultsofsand.
Crushed stone aggregate locally available of size 20 mm and 10 mm are used throughout the experimental study. The physicalpropertiesandsieveanalysisofresultsofbothaggregates.
Table 1:
Thequalityofmixingwaterformortarhasavisualeffectontheresultinghardenedcementmortar.Impuritiesinwatermay interferewithsettingofcementandwilladverselyaffectthestrengthofcausestainingofitssurfaceandmayalsoleadtoits corrosion.Usually,waterthatispipedfromthepublicsuppliesisregardedassatisfactory.
HYSDsteelofgradeFe 500of8mm,10mm,and12mmdiameterwereusedinthebeamsforR.C.C.The12mmbarshave beenusedinferrocementbeams.Apartfromthatweldedwiremeshwasusedforferrocementbeams.The12mmbarsareused astensionsteelandthe10mmbarsareusedascompressionsteel.8mmbarsareusedasshearstirrups.
Theseareelectricallyfusedweldedfabricatedjointgridsconsistingofaseriesofparallellongitudinalwireswithandaccurate spacing.Generally,machinesareusedformakingofsuchwirestopréciseddimensions.Widelyusedinagriculture,industries, transportationandmanyothersectors.Inthisexperimentalstudythewirethatwasusedhadthesquaresizeof10mmX10mm.
TheA.A.Cbrickorautoclavedaeratedconcretebrickhasbeenusedinthestudytofillthecoreoftheferrocementblocks insteadofusingmortarandcreatingahomogenousbeam.Thesizeofthebrickwasmeasuredtobe230mmX100mmX70mm.
AspertheIS10262 2009&MORT&Hmixproportionsforonecum.ofconcrete.
2022, IRJET | Impact Factor value: 7.529 | ISO 9001:2008
International Research Journal of Engineering and Technology (IRJET) e ISSN: 2395 0056
Volume: 09 Issue: 07 | July 2022 www.irjet.net p ISSN: 2395 0072
Table 2: Quantityofmaterialrequiredforonecubicmeterconcrete
Description M25
MassofCement( ) 320
MassofWater( ) 138
MassofFineAgg.( ) 751
MassofCoarseAgg.( ) 1356
WaterCementRatio 0.43 MassofAdmixture Nil
Therangeofmixproportionproposedforferrocementapplicationare1:1.5to1:2.5{Cement:Sand}butnotgreaterthan1:3. Whiletheappropriatewatercementratiowastakentobe0.35to0.5.Thegreaterthesandcontentofthemixthegreaterwillbe thewaterrequirementtomaintainworkability.Duringthisexperimentalthroughouttheexperimenttheratiowaskepttobe1:2 whereasthewatercontentratiowastakentobe0.40.
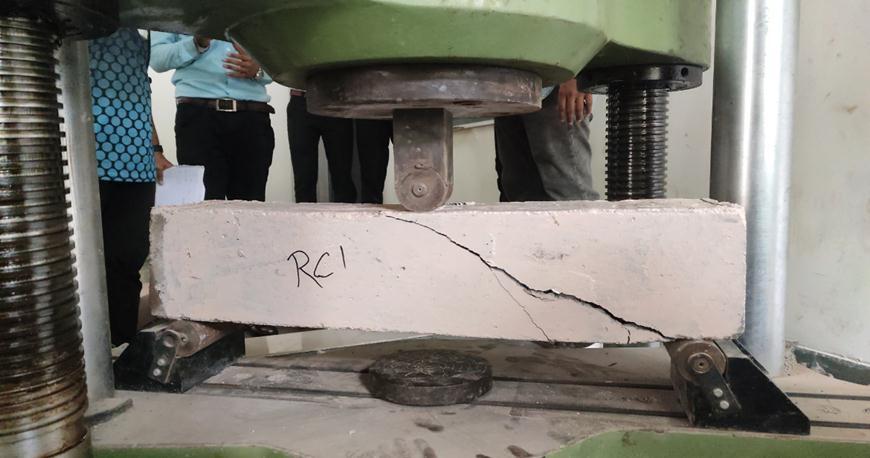
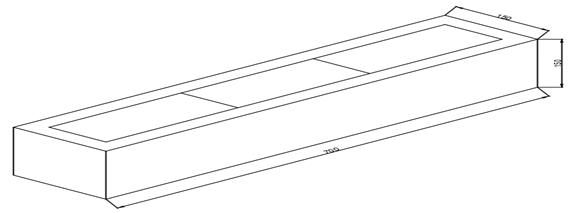
In the current study a total of three R.C. beams and three Ferrocement beams were cast and cured under appropriate conditions.ThemixdesignfortheconcretewasincorporatedtobeM25,andthesteelusedherebywasnotedtobeFE 500.The R.C.C.beamisdesignedtobeandunderreinforcedsectionwiththehelpoflimitstatemethod. Thebeamisdesignedinaway that2X12mmbarsofsteelareplacedonthetensionside.While2X10mmbarsofsteelareplacedonthecompressionside, similarly8mmbarsofsteelhavebeenusedasshearstirrups.Theferrocementbeamswerecastwiththehelpofwiremesh.2X 12mmbarswereplacedonthetensionsideofthebeamaswell.Inferrocementbeamssinglelayerofwiremeshwasusedand thecentralcoreofthebeamwaskepthollowandlateroninstalledwithA.A.Cbricks3X(230mmX100mmX700mm)per beam.ThecrosssectionofbothR.C.Cspecimenaswellasferrocementspecimenareshowninthebelowfigure2.
Fig 2:OutlinedCross sectionofSpecimen.
InitiallytheR.C.Cbeamsweretestedtofailureandthedataobtainedduringthetestwasrecorded.LateronaftertheR.C. beamsweretestedcompletelytheferrocementbeamsweretestedinthesamemannerandtheirrelativedatawasrecorded.The firstrackload,ultimateloadanddeflectionforeachofthebeamwererecordedandtabulatedaccordingly.Thebeamswere designatedasRC 1,RC 2,RC 3forR.C.C.whereastheferrocementbeamsweredesignatedasFE 1,FE 2,FE 3.
Followingarethetestresultstabulatedindeflectiontoloadmethodwithanintervalof5kNload.
International Research Journal of Engineering and Technology (IRJET) e ISSN: 2395 0056
Volume: 09 Issue: 07 | July 2022 www.irjet.net p ISSN: 2395 0072
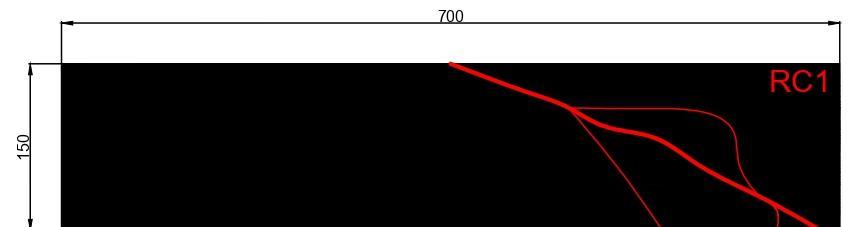
ThemaximumamountofloadcarriedbyRC 1wasnotedtobe85.40kNatthesametimethemaximumdeflectionundergone bythebeamwas7.83mm.Thebeamresultedinbrittlefailure.Firstcrackofthebeamoccurredat73kN.
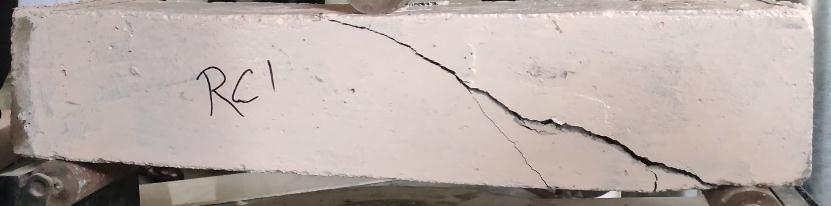 Fig -3:CracksdevelopedonlongitudinalsectionofRC 1
Fig -4:DrawingofcrackpatternonlongitudinalsectionforRC 1
Fig -3:CracksdevelopedonlongitudinalsectionofRC 1
Fig -4:DrawingofcrackpatternonlongitudinalsectionforRC 1
International Research Journal of Engineering and Technology (IRJET) e ISSN: 2395 0056
80
70
60
50
40
30
20
10
15
25
35
45
55
75 80 85.4 80 75 70 65 60 0
Volume: 09 Issue: 07 | July 2022 www.irjet.net p ISSN: 2395 0072 0 5
90 0 0.03 1.74 3.1 3.55 4 4.56 4.99 5.59 6.32 6.62 6.56 6.62 7.59 7.68 7.83
65
Load (KN)
Fig 5:GraphshowingtheloadvsdeflectionrelationforRC 1
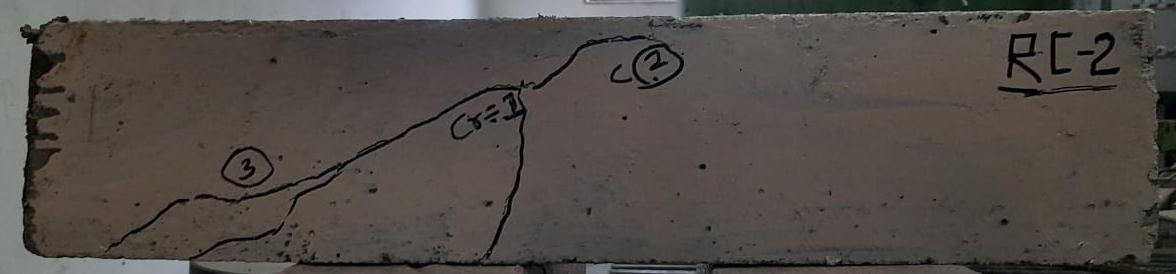
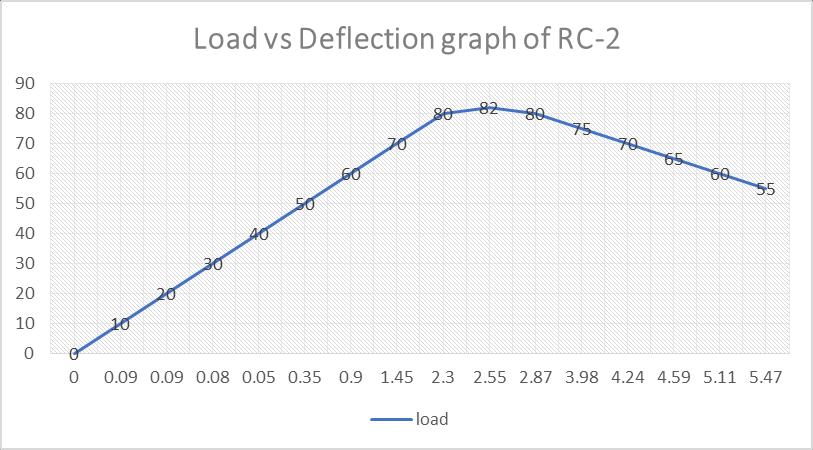
ThebeamRC 2similartotheotherRCCspecimenshowedlowerdeflectionvalues.
Fig -6:CracksdevelopedonlongitudinalsectionofRC 2
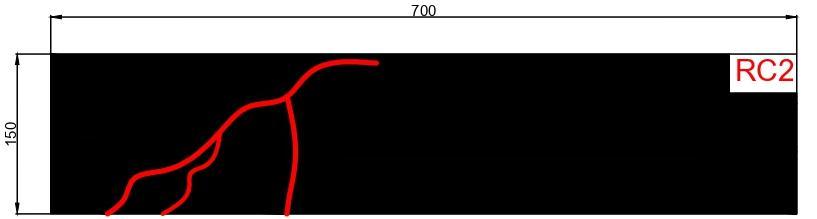
Thedifferencebetweenthefirstandthefinalcrackswerenotseentobemuch.Firstcrackforthisbeamwasobservedat 68.45kNwhereasultimatefailureoccurredat82kN.
Fig 7:DrawingofcrackpatternonlongitudinalsectionforRC 2
International Research Journal of Engineering and Technology (IRJET) e ISSN: 2395 0056
Volume: 09 Issue: 07 | July 2022 www.irjet.net p ISSN: 2395 0072
Table 4: ObservationsofLoadanditscorrespondingDeflectionofRC 2
Sr. No. Load (kN) Deflection (mm) Sr. No. Load (kN) Deflection (mm)
1 0 0.00 13 60 0.90
2 5 0.09 14 65 1.31
3 10 0.09 15 70 1.45
4 15 0.09 16 75 1.85
5 20 0.09 17 80 2.30
6 25 0.09 18 82 2.55
7 30 0.08 19 80 2.87 8 35 0.08 20 75 3.98
9 40 0.05 21 70 4.24 10 45 0.11 22 65 4.59 11 50 0.35 23 60 5.11 12 55 0.62 24 55 5.47
Fig 8:GraphshowingtheloadvsdeflectionrelationforRC 2
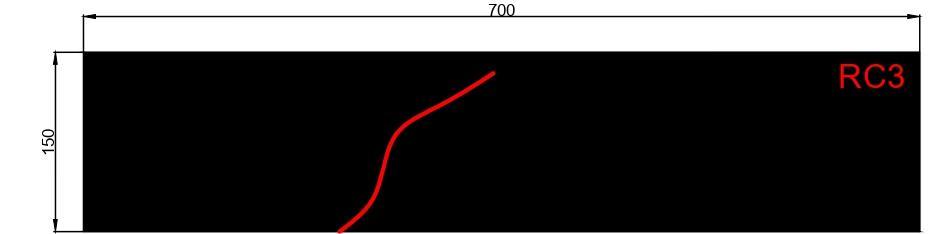
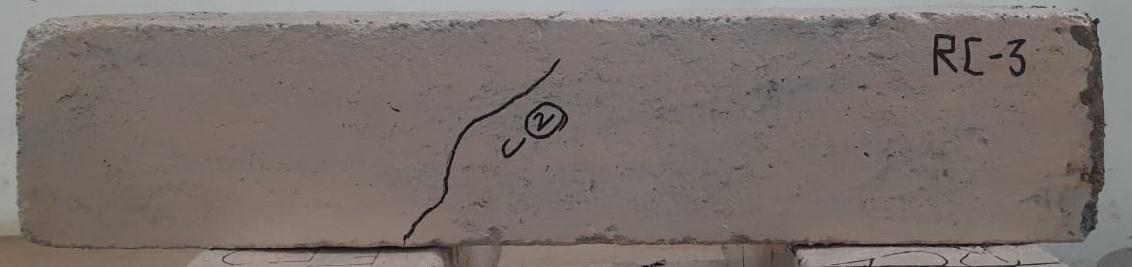
ThehighestvalueofdeflectionobservedforRC 3was6.38mmwhilethevaluesforfirstcrackloadandultimateloadwere notedtobe74.26kNand79.63kNrespectively.
2022, IRJET | Impact Factor value: 7.529 | ISO 9001:2008 Certified
International Research Journal of Engineering and Technology (IRJET) e ISSN: 2395 0056
Volume: 09 Issue: 07 | July 2022 www.irjet.net p ISSN: 2395 0072
Fig 9:CracksdevelopedonlongitudinalsectionofRC 3
Fig 10:DrawingofcrackpatternonlongitudinalsectionforRC 3 Table 5: ObservationsofLoadanditscorrespondingDeflectionofRC 3 Sr. No. Load (kN) Deflection (mm) Sr. No. Load (kN) Deflection (mm)
1 0 0.00 13 55 3.05 2 5 0.12 14 60 3.63 3 10 0.02 15 65 3.75 4 15 0.09 16 70 4.88 5 20 0.29 17 75 4.96 6 25 0.55 18 79.63 5.35 7 30 0.88 19 75 5.62 8 35 1.31 20 70 5.89 9 40 1.88 21 65 5.97 10 45 2.05 22 60 6.24 11 50 2.29
International Research Journal of Engineering and Technology (IRJET) e ISSN: 2395 0056
Issue:
2022 www.irjet.net
Fig -11:GraphshowingtheloadvsdeflectionrelationforRC 3
ISSN: 2395 0072
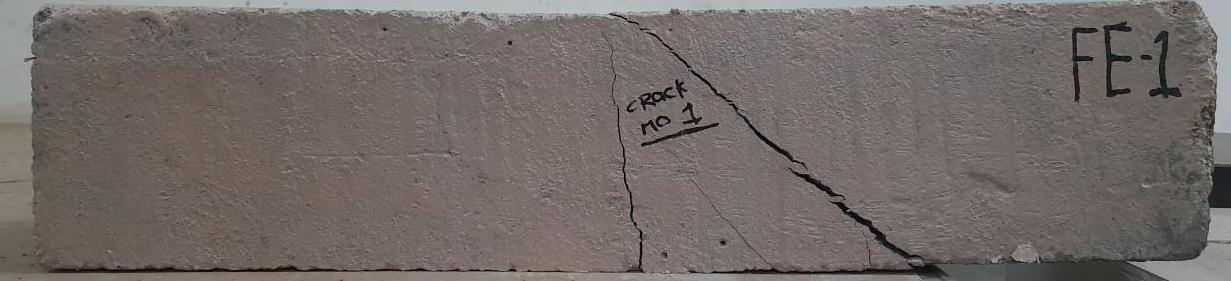
The ferrocement beams showed greater deflection values. It was noted during the testing that the ferrocementbeams showedhugedifferencebetweentheoccurrenceofthefirstcrackandtheultimatecracks.InthecaseofFE 1thefirstcrackwas observedat19.38kNandtheultimateloadwasseenat62.10kN.Themaximumdeflectiongivenbythebeamwasnotedtobe 15.69mm.
Fig -12:CracksdevelopedonlongitudinalsectionofFE 1
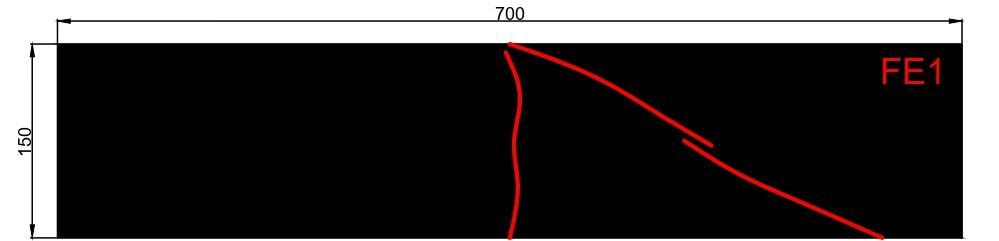
Fig 13:DrawingofcrackpatternonlongitudinalsectionforFE 1
International Research Journal of Engineering and Technology (IRJET) e ISSN: 2395 0056
Volume: 09 Issue: 07 | July 2022 www.irjet.net p ISSN: 2395 0072
60
50
40
30
20
10
Table 6: ObservationsofLoadanditscorrespondingDeflectionofFE 1 Sr. No. Load (kN) Deflection (mm) Sr. No. Load (kN) Deflection (mm) 1 0 0.00 10 45 7.33 2 5 2.06 11 50 8.82 3 10 2.41 15 55 11.20 4 15 2.5 13 60 13.87 5 20 3.01 14 62.1 14.20 6 25 3.75 15 60 14.86 7 30 4.22 16 55 15.01 8 35 5.58 17 50 15.69 9 40 6.87 0
70 0 2.06 2.41 2.5 3.01 3.75 4.22 5.58 6.87 7.33 8.82 11.2 13.87 14.2 14.86 15.01 15.69
Load vs Deflection graph of FE 1 load
Fig -14:GraphshowingtheloadvsdeflectionrelationforFE 1
5.1.5 Load vs Deflection Observations for FE 2
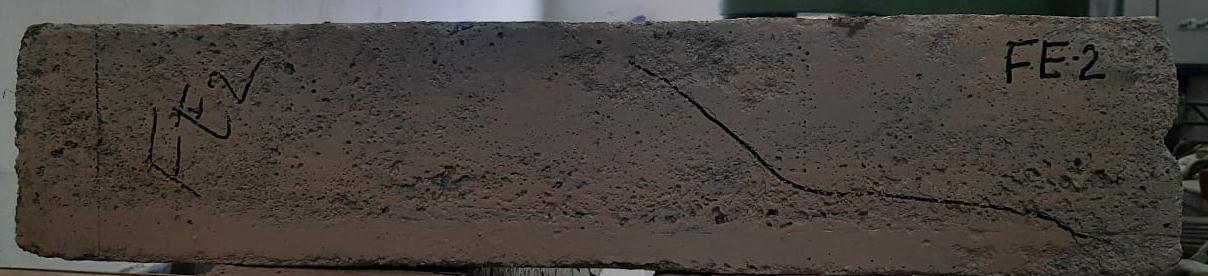
ThebeamFE 2showedmaximumdeflectionof12.78mmwhereasthefirstcrackwasseenat21.10kNandtheultimateload wasnotedat55.82kN.
Fig 15:CracksdevelopedonlongitudinalsectionofFE 2

International Research Journal of Engineering and Technology (IRJET) e ISSN: 2395 0056
Volume: 09 Issue: 07 | July 2022 www.irjet.net p ISSN: 2395 0072
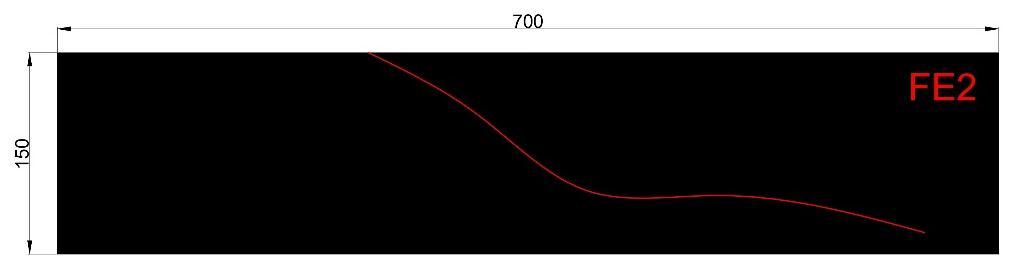
Fig 16:DrawingofcrackpatternonlongitudinalsectionforFE 2
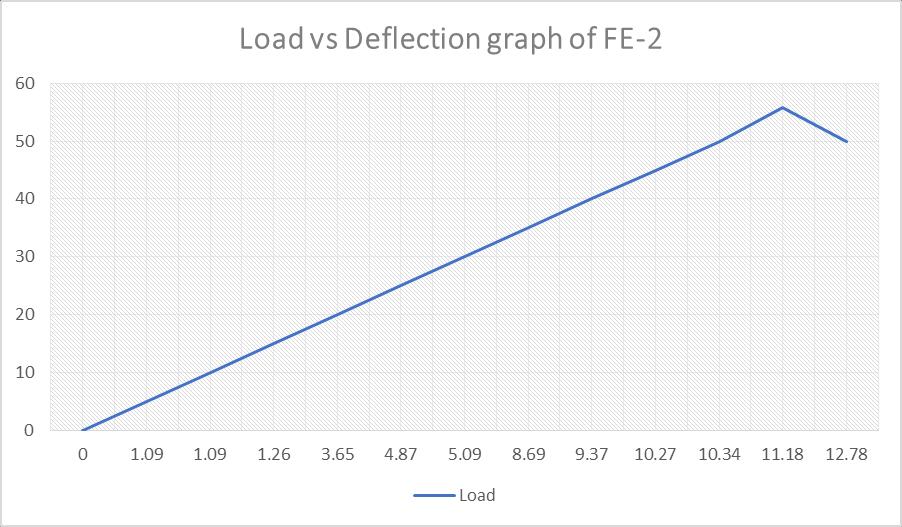
Table -7: ObservationsofLoadanditscorrespondingDeflectionofFE 2 Sr. No. Load (kN) Deflection (mm) Sr. No. Load (kN) Deflection (mm)
1 0 0.00 8 35 8.69 2 5 1.09 9 40 9.37 3 10 1.09 10 45 10.27 4 15 1.26 11 50 10.34 5 20 3.65 12 55.82 11.18 6 25 4.87 13 50 12.78 7 30 5.09
Fig 17:GraphshowingtheloadvsdeflectionrelationforFE 2
2022, IRJET | Impact Factor value: 7.529 | ISO 9001:2008 Certified Journal | Page
International Research Journal of Engineering and Technology (IRJET) e ISSN: 2395 0056
Volume: 09 Issue: 07 | July 2022 www.irjet.net p ISSN: 2395 0072
5.1.6 Load vs Deflection Observations for FE 3
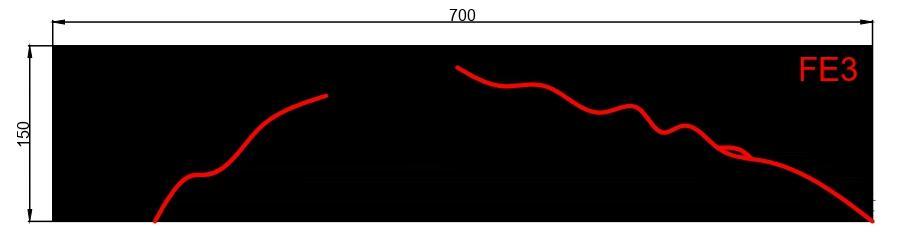
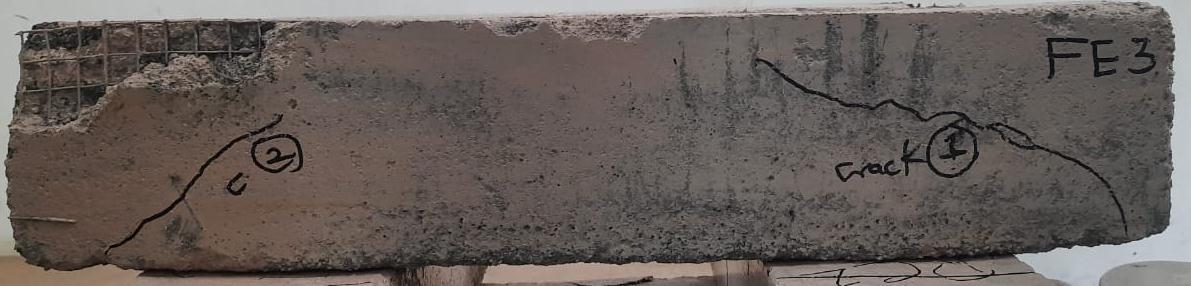
FE 3wasthefinalbeamamongthetestspecimen.Thefirstcrackloadandtheultimateloadforthisbeamwereseenat19.56 kNand51.20kNrespectively.Similarlytootherferrocementbeamsthisspecimenshowedhigherdeflectionvalues.
Fig 18:CracksdevelopedonlongitudinalsectionofFE 3
International Research Journal of Engineering and Technology (IRJET) e ISSN: 2395 0056
60
50
40
30
20
10
Volume: 09 Issue: 07 | July 2022 www.irjet.net p ISSN: 2395 0072 0
Load vs deflection of FE 3 Load
0 2.16 2.41 3 3.37 3.99 4.61 6.15 7.52 10.97 11.26 13.69 14.12
Fig 20:GraphshowingtheloadvsdeflectionrelationforFE 3
Table9belowsummarisedthefirstcrackingload,ultimateloadanditsrespectivedeflections,ductilityratio.Theductility ratio is the ratio of deformation at ultimate load to the deformation at first crack load. Average ductility ratio of three ferrocement tested beams is around 3 and average ductility ratio of three reinforced concrete tested beams is around 1. ThereforeitseemsthatfeerocementbeamisthreetimesductilethanRCbeam.Theseductilityratiosalongwithlargedeflection givesufficientwarningbeforefailureofspecimens.
Table 9: DuctilityRatioofbeams
Sr. No Bea m
First Crack Load and its corresponding deflection
Ultimate Load and its corresponding deflection Ductilit y Ratio Avg. Ductility Ratio
1 RC 1 73(5.45mm) 85.40(6.32mm) 1.159
2 RC 2 68.45(1.41mm) 82(2.55mm) 1.808 1.35 3 RC 3 74.26(4.94mm) 79.63(5.35mm) 1.083
4 FE 1 19.38(2.97mm) 62.10(14.20mm) 4.781 5 FE 2 21.10(3.70mm) 55.82(11.18mm) 3.013 3.987
6 FE 3 19.56(3.35mm) 51.20(13.96mm) 4.167
International Research Journal of Engineering and Technology (IRJET) e ISSN: 2395 0056
Volume: 09 Issue: 07 | July 2022 www.irjet.net p ISSN: 2395 0072
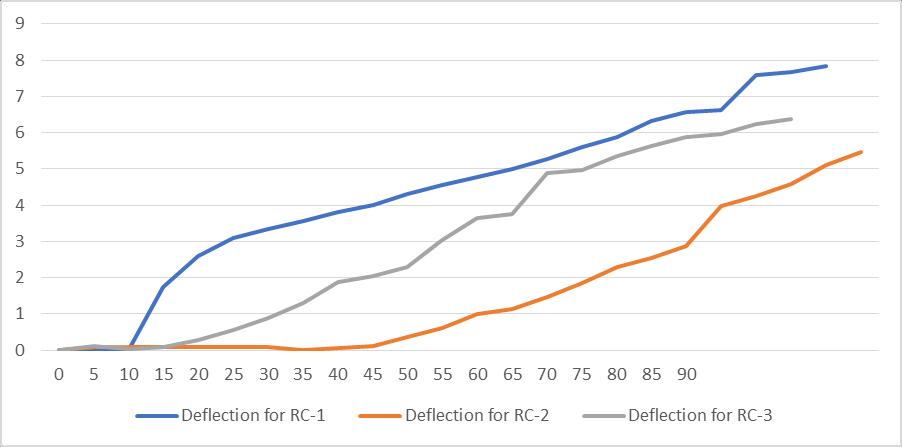
Fig 21:ShowsdeflectionbehaviorofallthreeR.C.Cbeamsundersimilarloading.
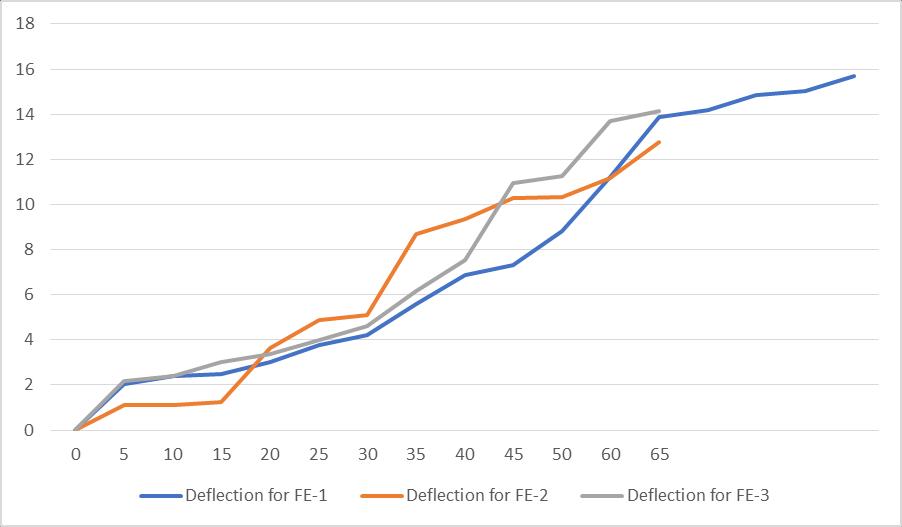
Fig 22:ShowsdeflectionbehaviorofallthreeFerrocementspecimensundersimilarloading
© 2022, IRJET | Impact Factor value: 7.529 | ISO 9001:2008 Certified Journal | Page
International Research Journal of Engineering and Technology (IRJET) e ISSN: 2395 0056
Volume: 09 Issue: 07 | July 2022 www.irjet.net p ISSN: 2395 0072
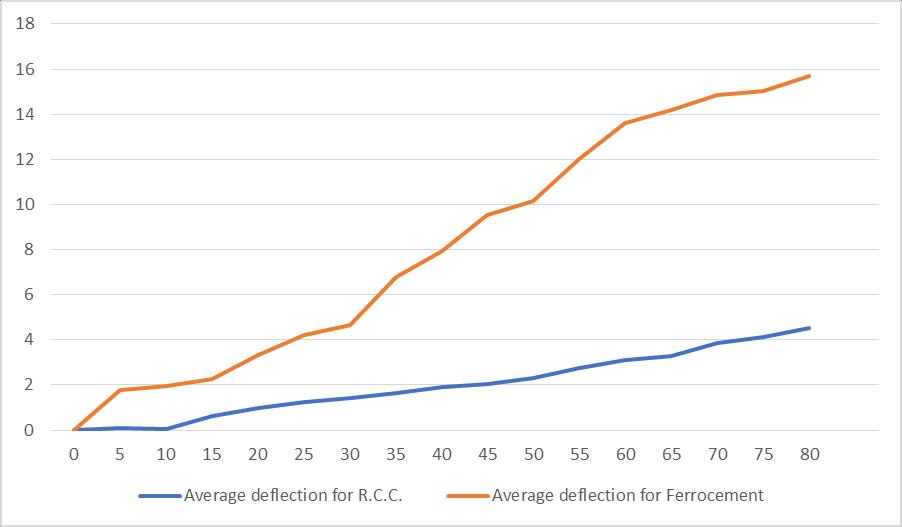
Fig 23:ShowsComparativedeflectiongraphofR.C.CandFerrocementundersimilarloading.
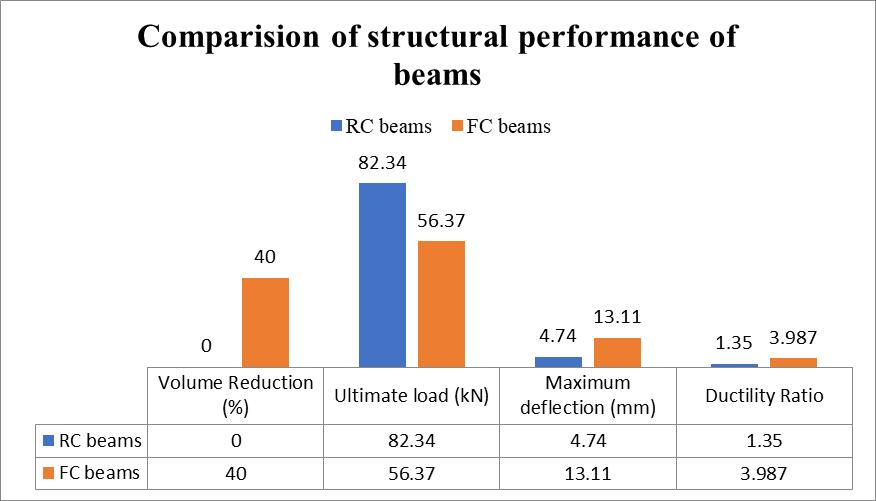
Theaverageultimatefailureloadswerefoundas80.34kNand56.37kNforRCbeamandFEbeam,respectively.Theaverage deflectionatultimatefailureloadswasnotedas4.74mmand13.11mmforRCbeamandFEbeam,respectively.Ultimateload taken by RC beam is 42.5% more than FE beam but at the same time FE beam reduced 40 % of its dead weight. Average deflectionatultimatefailureloadsofFEbeamis2.76timesmorethanRCbeam.Table10showstheultimateloadcarriedby beamsfordifferentvolumereductionpercentage.
Table -10: UltimateloadtakenbyRCandFEbeams
Bea m Volume reduction percentage
Ultimate Load and its corresponding deflection
RC 1 0% 85.40(6.32mm)
Average ultimate load Average deflection at ultimate load
RC 2 0% 82(2.55mm) 80.34 4.74
RC 3 0% 79.63(5.35mm)
FE 1 40% 62.10(14.20mm)
FE 2 40% 55.82(11.18mm) 56.37 13.11
FE 3 40% 51.20(13.96mm)
International Research Journal of Engineering and Technology (IRJET) e ISSN: 2395 0056
Volume: 09 Issue: 07 | July 2022 www.irjet.net p ISSN: 2395 0072
Fig 24:ComparisonofstructuralperformanceofRCbeamsandFEbeams
Ferrocementhasalwaysbeenreferredtoasthearchitect’smaterial,inthisexperimentanattemptwasmadetoestablish weather members cast ofitcan be utilizedas effective structural members withoutcompromisingthestrengthas well as functionalityofthemember.Fromtheresultsmentionedearlierthefollowingconclusionscanbedrawn:
1. TheR.C.C.specimenshowedbrittlefailure,inthesensethatnopriorintimationisreceivedduringorbeforethefailure. Whereasinferrocementpriorintimationisreceivedintheformoffirstcrackloadmoredeflectionisobservedinthe ferrocementbeams.
2. Noformworkorlessformworkwasrequiredforthecastingoftheferrocementspecimen,thusreducingtheoverallcost oftheproduct.
3. Eventhoughtheferrocementbeamsarelightweightitwasobservedthatnocompromisewhatsoeverwasmadeinthe strengthofthebeam.
4. Beingalightweightsection,thedesignofthestructuralmembersbecomesefficientandeconomical.
1. Whileworkingonferrocementbeamsmorelayerofwiremeshshouldbeprovidedalongwithchickenmesh.
2. Timedependenteffectsareneededtobeincorporatedinthepresentstudy.
3. Testsalongwithbendingshouldbecarriedoutfore.g.torsionaltesting,Earthquaketestingetc.
4. CareshouldbetakenwhilepreparingthemixforR.C.Caswellasfortheferrocementbeams.
5. Modificationsshouldbecarriedouttotestthedynamicbehaviorofthecompositeconcretebeam.
2022, IRJET | Impact Factor value: 7.529 | ISO 9001:2008 Certified Journal |
International Research Journal of Engineering and Technology (IRJET) e ISSN: 2395 0056
Volume: 09 Issue: 07 | July 2022 www.irjet.net p ISSN: 2395 0072
Asitisknownthatagoodshipcannotalonesailstormywaters,similarlythisarticlecouldneverhavebeenpossiblewithout ourguideProfKiranM.Deore.Itwasyourconstantguidancethatledusthroughthetimesofdifficultiesduringtheworkand theirin kindcontributionisgratefullyacknowledged.TheexperimentalworkwascarriedintheConcreteLabofLateG.N. SapkalCollegeofEngineeringNashik,Maharashtra(India).Theassistanceofthelaboratorystaffisalsoacknowledged
[1] Ibrahim G Shabaan, Yousuri B. I. shaheen, Essam L. Elsayeed, Osama, (2018), Flexural behavior and theoretical predictionoflightweightferrocementcompositebeams,Constructionandbuildingmaterialspage802 816.
[2] AshwinPAnand,JishnuPP,MelvinJoseph,MariIttiachan,(2019),DesignofResidentialBuildingusingFerrocement Technology.Issue5th May2019.
[3] G.J.Al Sulaimani,I.A.Basunbul&E.A.Mousselhy,(1990)ShearBehaviorofFerrocementboxbeams.21stApril1990.
[4] EetharThanonDawood,AbdalazizSaadShawkat,MafazHaniAbdullah,(2021),Flexuralperformanceofferrocement basedonsustainablehigh performancemortar,CaseStudiesinConstructionMaterials,Volume15,10th May2021
[5] P.DesaiandN.Ganesan,(1986),Fracturepropertiesofferrocementusingdoublecantileverbeamspecimens,The InternationaljournalofCementCompositesandLightweightConcrete,Volume8,Number2.(1986)page121 132.
[6] Taha A. El Sayeed, Abeer M. Erfan, (2018), Improving Shear Strength of beams using Ferrocement Composite, ConstructionandbuildingMaterials,Volume172,Pages608 617.
[7] RajeshS.Rajguru,ManishPatkar,(2021),TorsionalbehaviorofstrengthenedRCbeamsbyferrocement,Materials Today:Proceedings.
[8] Ibrahim G. Shaaban, Yousry B. Shaheen et al, (2018), Flexural behavior and theoretical prediction of lightweight ferrocementcompositebeams,Volume9Casestudiesinconstructionmaterials
[9] Gopal Charan Behera, Rao T. D. Gunneswar et al (2013), Torsional Strength of Ferrocement “U” Wrapped normal strength beams with only transverse reinforcement, Procedia Engineering, The 2nd International Conference on RehabilitationandMaintenanceinCivilEngineering,Page752 763.
[10] NoorAhmedMemonetal(2007),Ferrocementencasedlightweightaeratedconcrete:ANovelapproachtoproduce sandwichcomposite.Page4035 4038.
[11] P. Paramasivam et al (1998), Strengthening of RC Beams with Ferrocement laminates. Cement and Concrete composites.Page53 65.
[12] M. J. Shannag, S. M. Mourad (2012), Flowable high strength Cementous matrices for ferrocement applications, ConstructionandBuildingMaterials,Page933 939.
[13] BoLi,EddieSiuShuLam,(2018),InfluenceofInterfacialcharacteristicsontheshearbondbehaviorbetweenconcrete andferrocement.Page462 469.
[14] P.DesayiandN.Ganesan,(1984),Determinationofmaximumcrackwidthinferrocementflexuralelementsofchannel crosssection.InternationalJournalofcementcompositesandlightweightconcretevolume6number3.Page169 177.
[15] P.DesayiandN.Ganesan,(1986),Fracturepropertiesofferrocementusingdoublecantileverbeamspecimens.Page 121 132.
© 2022, IRJET | Impact Factor value: 7.529 | ISO 9001:2008 Certified Journal | Page2587
International Research Journal of Engineering and Technology (IRJET) e ISSN: 2395 0056
Volume: 09 Issue: 07 | July 2022 www.irjet.net p ISSN: 2395 0072
BE Student, Department of Civil Engineering, Late G. N. Sapkal College of Engineering, Nashik, Maharashtra,India.

AssistantProfessor,Departmentof CivilEngineering,LateG.N.Sapkal College of Engineering, Nashik, Maharashtra,India. © 2022, IRJET | Impact Factor value: 7.529 | ISO 9001:2008 Certified Journal |