International Research Journal of Engineering and Technology (IRJET) e ISSN: 2395 0056

Volume: 09 Issue: 07 | July 2022 www.irjet.net p ISSN: 2395 0072
International Research Journal of Engineering and Technology (IRJET) e ISSN: 2395 0056
Volume: 09 Issue: 07 | July 2022 www.irjet.net p ISSN: 2395 0072
1
5
Abstract - Pathanamthitta is one of the most developing districts in Kerala. Such a growing city does not have a proper Geodatabase or a soil property map which could make the civil engineering works easier. Soil samples from different sites was collected and tested to determine the index and engineering properties of the soil. The test was conducted according to IS code procedures. The soil properties thus evaluated was inputted to generate soil property maps for the area. All the maps were generated using ArcGIS 10.3.1 version. The main objective of this study is to create a database of soil properties and boring location plans and corresponding test boring logs and thus maximize the use of GIS techniques to access land use and soil classification. Geodatabase is obtainable and simply accessible; it'll be of great advantage for civil engineering works. This study aims to research the development of a Geographic system (GIS) to better manage and disseminate soils information, as developed from soil test results.
Key Words: Geodatabase, GIS, ArcGIS 10.3.1 version, Index properties, Engineering properties
Pathanamthitta District is situated at the southern part of Kerala,India.Thedistrictheadquartersiswithinthetownof Pathanamthitta. The latitude and longitude of Pathanamthittais9.26480Nand76.78700Erespectively.The districtis10.03%urbanized.Pathanamthittadistricthasan elevationof18mfromthesealevel.Thedistrictexperiences amoderateclimateincludingtworainyseasons(south west monsoon and north east monsoon). Soil properties play a vitalroleincivilengineeringfieldandagriculturalfield.With the help of a proper Geodatabase civil engineering works doneeasier.TheGIS(GeographicInformationSystem)has beenusedasavitaltoolincivilengineeringfieldsinrecent years for a variety of applications. In fact, geotechnical characterizationofanareawasanarduoustaskbeforeGIS because of complexity of soil logs and their data representation. Thus, the necessity for the GIS which transformsallpaperwork(hardcopies)intodigitalformsto form data quickly accessed and simply analysed, is inevitable. Zonation maps can be used in different engineeringdisciplinesforprovidinginformationonslope stability, seismic micro zonation, groundwater quality, watershed,vegetationandlandslidehazardassessment.
Soil is a natural material, made up of different type of particles,havingvarietyofengineeringpropertiesandindex properties,mostofwhicharenotuniform,andit differfrom oneplacetoanother.Thepropertiesofsoilwhichareusedin therecognitionandclassificationofsoilareknownasindex properties.Variousindexpropertiesofsoilarewatercontent, specific gravity, particle size, consistency, relative density, etc. The major engineering properties are permeability, compressibility and shear strength. The following are the briefdescriptionoffewengineeringandindexpropertiesof soil:
i. Moisturecontentisthatamountofwaterwhich iscontainedinthevoidsofthesoil.Itisoneof the important factors on which the shear strengthofsoildependson
ii. Permeabilityindicatestheeasewithwhichthe waterflowthroughsoils.
iii. Compressibilityisrelatedwiththedeformations which soil undergoes when subjected to compressiveloads.
iv. The shear strength helps in determining stabilityofslopes,bearingcapacityofsoilsand theearthpressuresonretainingstructures
v. Drydensityofsoilmassistheratioofmassof soilsolidstothevolumeofsoilmass.
vi. Thespecificgravityofsoilsolidsistheratioof thedensityofagivenvolumeofsoilsolidstothe greatestdensity(at+4°)ofanequalvolumeof purewater.
vii. Theprincipalsoilgrainpropertiesarethesize and shape of grains and the mineralogical characterofthefinerfractions.Theimportant aggregate property of cohesionless soil is relative density and that of cohesive soil is consistency.
Therearedifferenttypesofsoilallovertheworld,afact thattherearedifferentagentsresponsibleforthebuilding and formation of soil (landscape, climate, geology, vegetation, time and man). In the past 50 years, many
International Research Journal of Engineering and Technology (IRJET) e ISSN: 2395 0056
Volume: 09 Issue: 07 | July 2022 www.irjet.net p ISSN: 2395 0072
countriesintheworldhavebeenincludedinmakingmapsof theirsoilstoidentifytherangeofsoiltypesintheirterritory, wherethesoilsoriginatedandhowtheycanbeutilized.Soil mappinginvolvesfindingandidentifyingthedifferentsoils thatoriginated,collectingdataabouttheirlocation,nature, properties and potential use, and recording this data on mapsandtoshowthespatialdistributionofeverysoil.
Inordertomapandidentificationofdifferenttypesofsoil, itis essential tohavea system ofsoilclassification. In the case of plants, we have the Linnaean system, so a parallel approach is required for soils. Soil classifications have brought a major challenge, one that must be sufficiently solved.Atpresentthereisnosinglesystemthatcanbeused universally. There are two international systems, FAO UNESCOandUSSoilTaxonomy,butseveralothersystems havedeveloped,andmanycountrieshavedevelopedtheir ownsystemsappropriatetolocalstateofsoilformationand tolocalknowledge.
Traditionally,thesoilmappingismanagedwithanauger and spade at intervals throughout the area. The intervals between inspections can be done according to a pre determined grid (grid survey) are based upon the apprehensionofthesurveyorwhousestheirknowledgeof the affinity between soil type and landscape, geology, vegetation,etc.todeterminewheretomakecheckup.Auger borings are augmented by excavating profile pits at pre determined pointsin thelandscape. Theseprofilepits are usedtoindicatelateralchangesinthesoilaswellasvertical onesandareimportantforthefullinformationofsoiltypes and the soil sample collected for chemical, physical and biologicallaboratoryanalysis.Thus,apictureofthesoilin thatregionanditsrelationshiptothelandscapeisgenerated.
Geographic InformationSystem(GIS)isa technological fieldthatassimilategeographicalfeatureswithtabulardata in order to analyze mapandidentify real world problems. Geographyisthekeywordofthistechnology whichmeans, afewportionsofthedataisspatial.Onotherhand,datathat isreferencedtolocationsonearth.Biformedwiththisdatais usuallytabulardataandknownasattributedata.Attribute data can be defined as additional information about the geographicalfeatures.Itisthecombinationofthesetwodata types which enables GIS to solve problems through geographicalanalysis.
AGISisacomputersystemthatcapableofassembling, saving, manipulating and displaying geographically referencedinformation,i.e.,dataidentifiedaccordingtotheir regions.UsersalsoregardthetotalGISasincludingoperating crew and the data that go into the system. USGS defines a geographic information system as a computerized tool for mappingandanalyzingthingsthatremainandeventsthat occuronearth.
GIS operates on many levels. The basic level of GIS technologyiscomputercartographythatisusedforstraight forward mapping. The actual power of GIS is using geographicalandstatisticalmethodstoanalyzeattributeand geographicinformation.Theresultoftheanalysiscanbea derivative information, interpolated information or formulatedinformation.ItcanbenotedthatGISisconsidered synonymouslywithgeospatialtechnology.Butthereistwo other parts to geospatial technologies. They are remote sensingandGPS.
i. Data capture: Data used in GIS generally come frommanytypesandarestoredinseveralways.A GIS bring tools for the combination of different dataintoaformattobecorrelatedandanalysed Data sources are mainly attained from manual digitizationand scanning ofaerial photographs, papermaps,andcurrentdigitaldatasets.Remote sensingsatelliteimageryandGPSareauspicious datainputauthorityforGIS.
ii. Database Management and Update: After data beingcollectedandcombined,theGISmustbring facilities, which can be stored and maintained data.Effectivedatamanagementshouldinclude thefollowingaspects:dataintegrity,datasecurity, retrieval, data storage and data maintenance abilities.
iii. Geographic Analysis: Data combination and alterationarenotonlyacomponentoftheinput phaseofGIS.GISquantitativelyandqualitatively analyseandinterpretthecollecteddata.
iv. Presenting Results: GIS technology is one of the mostexcitingaspectsofdifferentwaysinwhich theinformationcanbevisualizedonceithasbeen handledbyGIS.Traditionalmethodsofcalculating andgraphingdatacanbeaugmentedbymapsand 3D images. Visual communication is one of the mostintriguingaspectsofGIStechnologyandis accessibleinadifferingrangeofoutputoptions
International Research Journal of Engineering and Technology (IRJET) e ISSN: 2395 0056
Volume: 09 Issue: 07 | July 2022 www.irjet.net p ISSN: 2395 0072
i. Toevaluatetheindexandengineeringpropertiesof soil samples collected from different parts of Pathanamthittadistrict
ii. To create a database involving the geotechnical propertiesofsoilinPathanamthittadistrict
iii. Tocollectthebore logdetailsatdifferentlocations ofPathanamthittadistrict
iv. Todeterminetheallowablesafebearingcapacityof soilfromSPT Nvalue.
v. To generate the soil property maps using ArcMap 10.2.
a. Variationinparticlesizedistributionofsoil
b. Variationincompactioncharacteristicsof soil
c. Variationinphysicalandindexproperties ofsoil
d. Variationinengineeringpropertiesofsoil
e. Variationinconsistencylimitsofsoil
vi. TogeneratetheSPTNvaluezonationmapat10ft, 25ft,50ft,75ftand100ftdepthusingGIS.
vii. To generate the allowable safe bearing capacity valuemapusingGIS.
viii. Toidentifyissueswithsoilsamplescollected.
• Reference for consultancies doing major geotechnicalengineeringprojectsandworks
• Provideanaidforresearcherstodotheirprojecton geotechnicalengineering
• Help the organizations to know the type and suitabilityofdifferentsoilsfordifferentworks
In order to apply GIS in geotechnical engineering, the licensedsoftwarefromESRIisimportant.Thefreeversionof GISisQGISwhichisalsoveryuserfriendly.Digitalelevation model ofany placeundertheworldcan beobtained from USGSwebsite.Thiswillbeintheformofashapefilewhich candirectlyaddedintotheGISworksheet.Therequiredarea canthenbeextractedusingGIStools.Theprimarydata(soil properties tested) regarding a site with geographical coordinateswasincorporatedintoGISworksheetfromexcel fileusingconversiontoolsintheArctoolbox.Thus,theexact latitude and longitude of data are incorporated into worksheet.Thesamplingpointscanbeincorporatedintothe Google Earth Pro to create the Google Earth scene of samplingpointsandboundaryofstudyarea.UsingSpatial analysttools,differentoperationslikeinterpolation,trend, etc.canbedonetoknowthefeaturesoflocationswhosedata areunavailable.Thefilecanbesavedinasashapefileand
can be converted into a map using layout features and exportedasaimagefile.
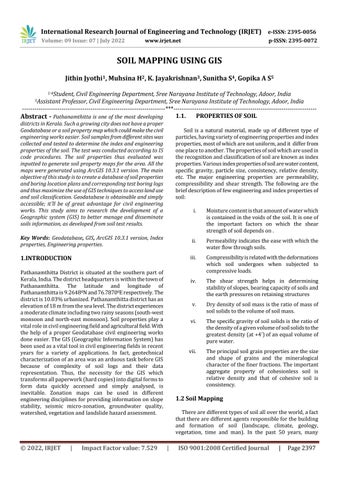
Soil samples were collected from 22 different sites in Pathanamthittadistrict.
Fig 1:MapofPathanamthitta
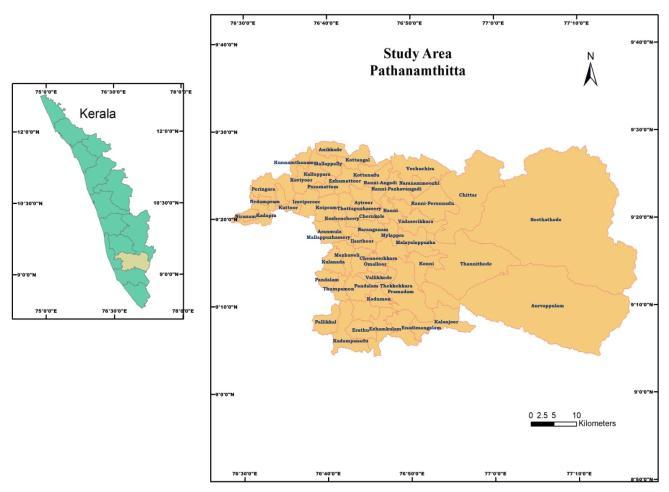
Table 1: Sitepoints
Sampl eNo.
Place Latitude Longitude 1
Parakode N9.152108 E76.753262 2 Karuvatta N9.161148 E76.725260 3 Puzhikad N9.206456158 E7667100079 4 Koodal N9.140323 E76.855804 5 Adoor N9.164094481 E76.74452638 6 Kulanada N9.230953692 E76.69960536 7 Adavi N9.245845834 E76.90966676 8 Pandalam N9.223124 E76.676277 9 Pathanamthitta N9.256121 E76.773119 10 Aranmula N9.326759 E76.684475 11 Parumala N9.334918 E76.54991 12 Ranni N9.376046 E76.784484 13 Pathanamthitta BusStand N9.266476 E76.789965 14 Pathanamthitta Jail N9.265121 E76.792619 15 Seethathod N9.323736 E76.977033 16 Niranam N9.341062 E76.516750 17 Kozhencherry N9.333247 E76.707649 18 Pathanamthitta N9.263443 E76.787239 19 Chandanapally N9.2088888 E76.766850 20 AdoorBypass N9.164094481 E76.74452638 21 Mylapara N9.272341 E76.799908 22 Thiruvalla N9.380862 E76.572862
International Research Journal of Engineering and Technology (IRJET) e ISSN: 2395 0056
Volume: 09 Issue: 07 | July 2022 www.irjet.net p ISSN: 2395 0072
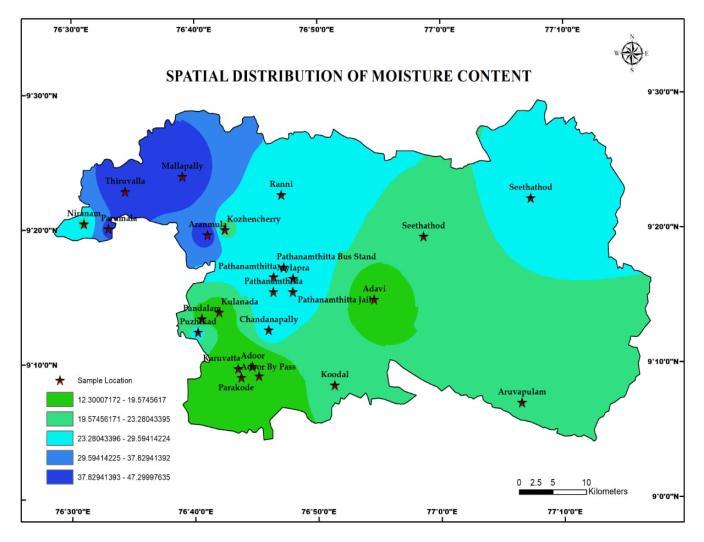
Fig.2showsthevariationinmoisturecontent.Therangeof moisture content obtained from oven dry method varies 12.3%to47.29%
Fig.4showsthevariationinangleofinternalfrictionofsoil. The range of angle of internal friction varies 22.53% to 41.99%,whichisobtainedbydirectsheartest.
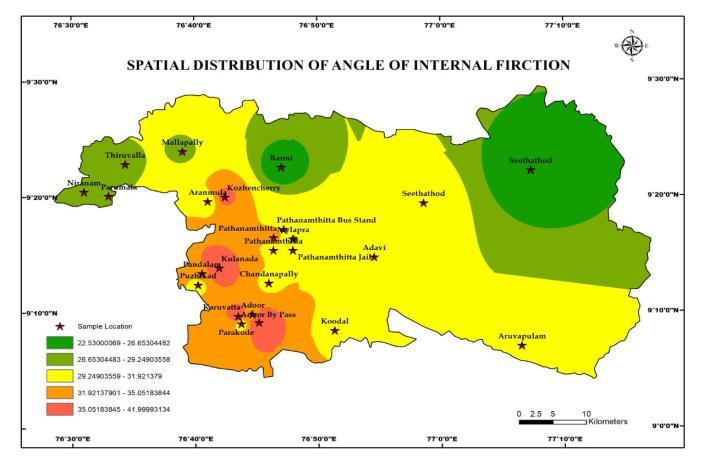
Fig 2:Variationinmoisturecontentofsoil
Fig.3showsthevariationinspecificgravityofsoil.Therange ofspecificgravityvaries2.64%to2.70%.Accordingtothe specificgravitythesoilcanbeclassifiedas:
Table -2: Typicalvaluesofspecificgravity
Soiltype Specificgravity
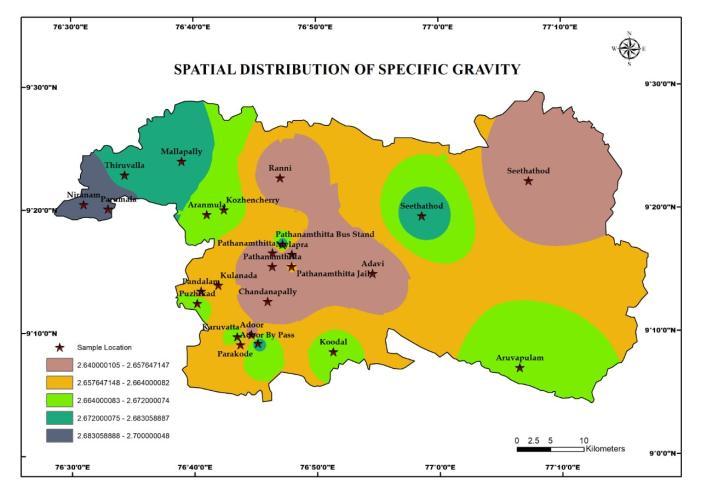
Cleansandandgravel 2.64 2.68 Siltandsiltysand 2.66 2.70 Inorganicclays 2.70 2.80 Soilhighinmica,iron 2.75 2.85 Organicsoil <2
Fig 4:Variationinangleofinternalfrictionofsoil.
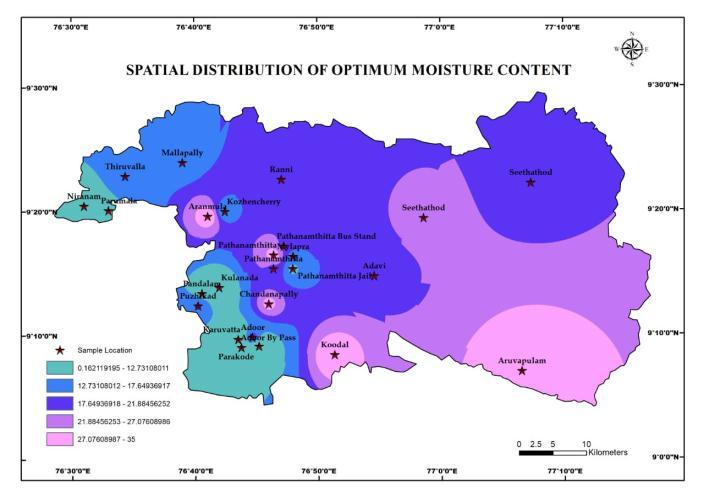
Fig.5showsthevariationinoptimummoisturecontentof soil.Therangeofoptimummoisturecontentvaries0.16%to 35%,whichisobtainedbycompaction.
Fig 3:Variationinspecificgravityofsoil
Fig 5:Variationinoptimummoisturecontentofsoil
Fig. 6shows the variationin maximum dry density of soil. Therangeofmaximumdrydensityvaries1.10%to1.85%, whichisobtainedbycompaction.
International Research Journal of Engineering and Technology (IRJET) e ISSN: 2395 0056
Volume: 09 Issue: 07 | July 2022 www.irjet.net p ISSN: 2395 0072
Fig. 9 shows the variation in unconfined compression strength of soil. The range of unconfined compression strengthvaries0.25%to4.62%
Fig -6:Variationinmaximumdrydensityofsoil
Fig.7showsthevariationinbulkdensityofsoil.Therangeof bulkdensityvariesfrom1.40%to2.04%
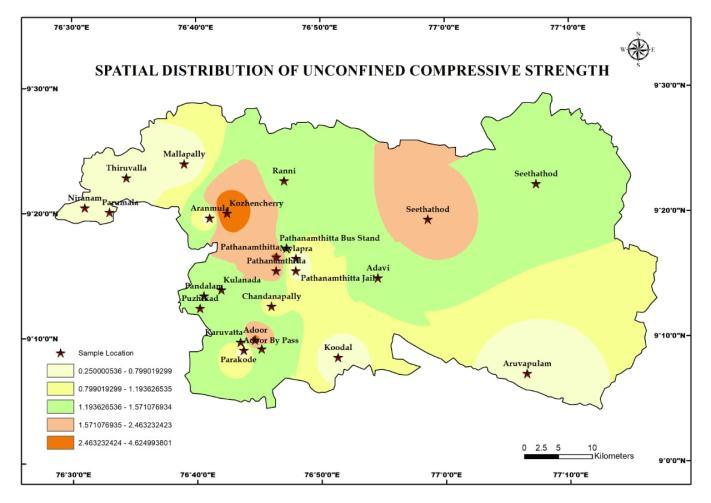
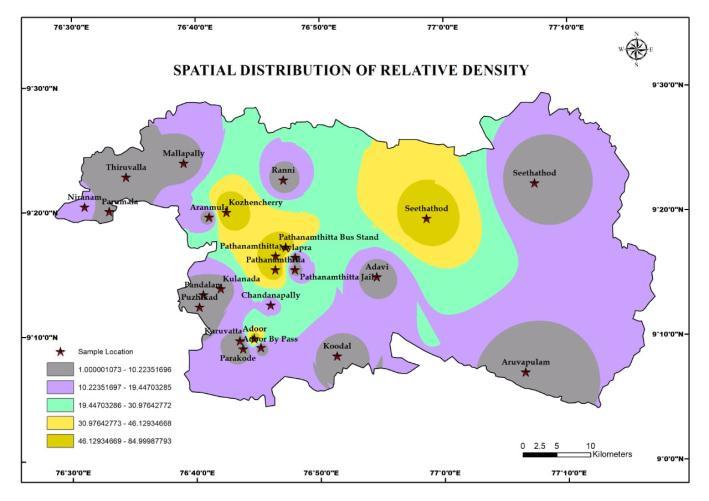
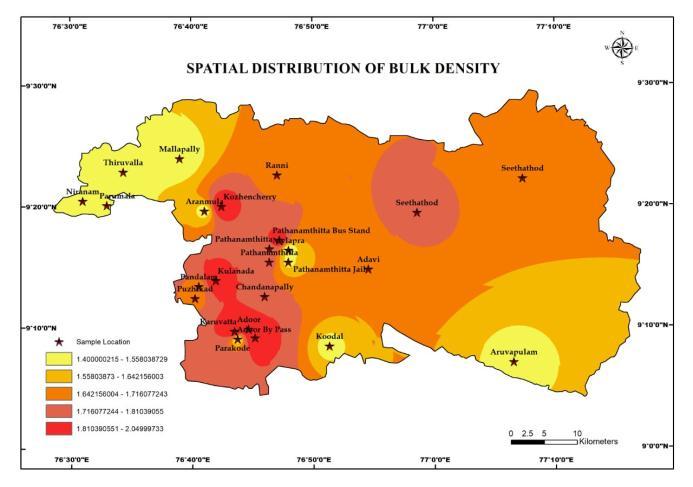
Fig 9:Variationinunconfinedcompressionstrengthof soil
Fig.10showsthevariationincohesionofsoil.Therangeof cohesionvaries0.05%to0.08%.
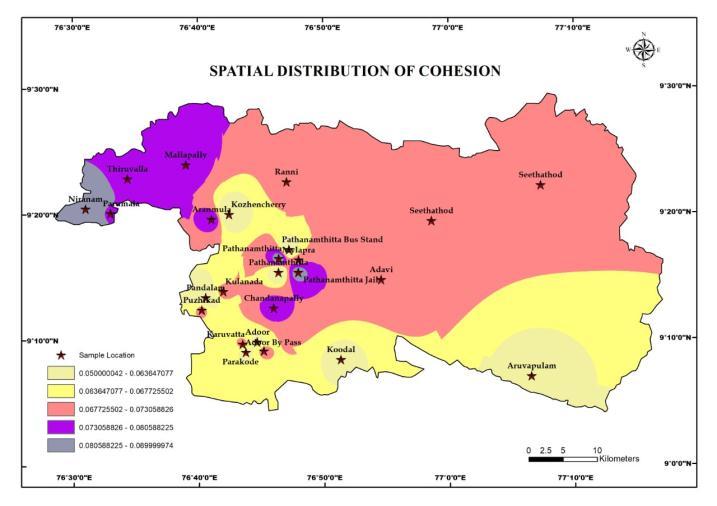
Fig 7:Variationinbulkdensityofsoil
Fig.8showsthevariationinrelativedensityofsoil.Therange ofrelativedensityvariesfrom1%to84.99%.
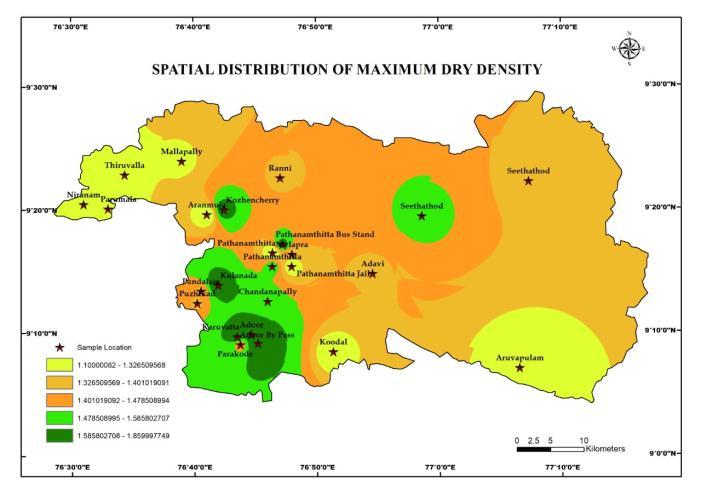
Fig 10:Variationincohesionofsoil
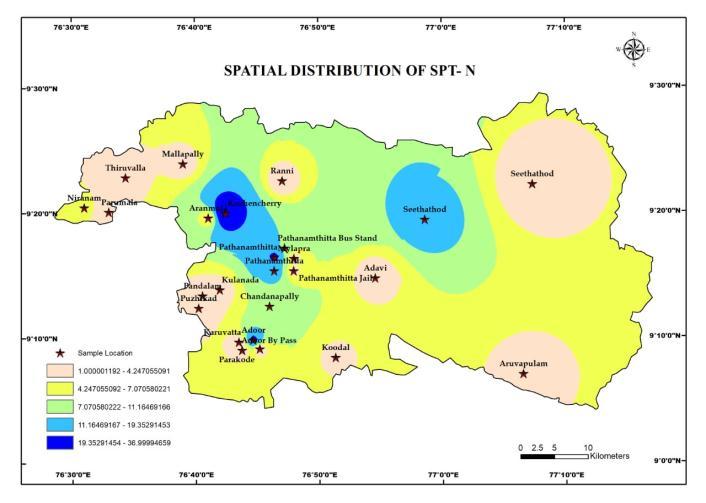
Fig.11showsthevariationinSPT Nvalueofsoil.Therange ofSPT Nvaries1%to39.99%,whichisobtainedbystandard penetrationtest.
Fig -8:Variationinrelativedensityofsoil
International Research Journal of Engineering and Technology (IRJET) e ISSN: 2395 0056
[3] Jafar Adam, Samaila Saleh, Adekunle T. Olowosulu, AhmedH.Ashrana,S.Srividhya,(2018),“Mapping of soil properties using Geographical Information System (GIS): ACasestudyofHussanUsmanKatsinapolytechnic”,Open journalofCivilEngineering,vol8,pg:544 554.
[4] Pravat Kumar Shit, Gouri Sankar Bhunia, Ramkrishna Maiti, (2016), “Spatial Analysis of properties using GIS based geostatistics models”, Springer International publishing,vol2,pg:107.
[5] A.S.Rogowski,(2007), “Quantifyingsoilvariability in GIS application: spatial distribution of soil properties”, International Journal of Geographical Information Systems,Vol10(4),Pg:455 475.
Fig 11:VariationinSPT Nvalueofsoil
Geographicsystem(GIS) is cheaper and faster technique thanthe normalones in delineating and mapping soil properties. Pathanamthitta isone amongstthe rapidly developingdistrictsbecauseofbudgetaryconstraints,small projects often overlook site characterization. Thus,the requirementfor the GIS which transforms all paper work (hard copies) into digital formsto createdata quickly accessedandsimplyanalysedisinevitable.Therecomesthe socialrelevanceofthissubject.Creationofgeodatabaseand generation of soil property maps using geographicinformation systemhelps in resolvingthe problemto certain extend. Soil samples from 22 different regionsinPathanamthittadistrictwascollectedandtested asperISspecifications.Indexandengineeringpropertiesof soilspresentoverPathanamthittaregionswasestimatedfor creating a database and these properties were representedwithin thetype ofsoil maps using Geographicinformation system(GIS). Geotechnical engineers can run more queriesof variedcombinations regarding the soil propertieswhich canhelp indecision makingprocess.TheGISmapsproducedgivesaconcepton thesoilpropertiesoverthespecifiedstudyarea.Thus,this projectis going to bebeneficial to the Geotechnical Engineers,Consultants,InvestigatorsandClients
[1] AjitB.Arote,SangitaV.Pawar,SwapnilR.Joshi(2022) “Mapping of soil properties using Geographical Information System”, International Conference on Contents,Computing&Communication
[2] AbdulkarimIbrahimIkara,YahayaHayatuUmar,Nagari DaudaDauda(2022), “MappingofGeotechnicproperties using Arcgis: A case study of Abubakar Tatawa Balewa University Bauchi, Gubi Campus”, Iconic Research and Engineeringjournals.
[6] Amoori,S.K.,El Tawel,K.,Hussain,H.M.,AlAnsari,N.and AlAli,M.J.(2018), “Bearing Capacity Map for Al Najaf and Kufa Cities Using GIS”, Procedia Engineering, 10, 262 269
[7] IslamA.,Md.HasanandAhmed(2017). “Application of GIS in general soil mapping of Bangladesh”, Journal of GeographicInformationSystem,9(5),604 621.
[8] Sanjini S. H and Shivanna (2017). “Soil Mapping and Classification using Remote Sensing and GIS in Sullia Taluk, DK, Karnataka, India”, International Journal of Innovative Research in Science, Engineering and Technology,6(9),18147 18152.
[9] Sil and Sitharam (2017). “Detection of local site conditions in Tripura and Mizoram using the topographic Gradient extracted from remote sensing data and GIS techniques”, NaturalHazardsReview,18(2),1 14.
[10] V. Dhayalan, S. M. Muthu and M. Ramaraj (2016). “Mapping and Analysis of Soil Fertility Using Remote Sensing and GIS; A Case Study of Tharangambadi Taluk, Nagappatinam District”, International Journal of Engineering Research and General Science, 4(3), 218 231
[11] Sharma B.andRahmanS.K.(2016).“Use of GIS Based Maps for Preliminary Assessment of Subsoil of Guwahati City”, JournalofGeoscienceandEnvironmentProtection, 4,106 116.
[12] Glowienk,KrystynaMichalowskaandAgnieszkaPekal Beata Hejmanowska (2016). “Application of GIS and Remote sensing techniques in multitemporal analyses of soil properties in the Foreland of the Carpathians”, IOP ConferenceSeries:EarthandEnvironmental Sciences, 44,1 6.
[13] Pravat Kumar Shit, Gouri Sankar Bhunia, Ramkrishna Maiti, (2016), “Spatial Analysis of properties using GIS based geostatistics models”, Springer International publishing,Vol.2,pp.1070.
Volume: 09 Issue: 07 | July 2022 www.irjet.net p ISSN: 2395 0072 © 2022, IRJET | Impact Factor value: 7.529 | ISO 9001:2008 Certified Journal |
International Research Journal of Engineering and Technology (IRJET) e ISSN: 2395 0056
[14] Murugan and V. K. Stalin (2016). “Development of soil suitability map using GIS”, Indian Geotechnical Conference IGC2016, December 2016, IIT Madras, Chennai,India,1 4.
[15] Gorji T., Tanik A. and Sertal E. (2015). “Soil salinity prediction, monitoring and mapping using modern technologies”, World Multidisciplinary Earth Sciences Symposium,15,507 512.
Volume: 09 Issue: 07 | July 2022 www.irjet.net p ISSN: 2395 0072 © 2022, IRJET | Impact Factor value: 7.529 | ISO 9001:2008 Certified Journal