International Research Journal of Engineering and Technology (IRJET) e ISSN: 2395 0056

Volume: 09 Issue: 07 | July 2022 www.irjet.net p ISSN: 2395 0072
International Research Journal of Engineering and Technology (IRJET) e ISSN: 2395 0056
Volume: 09 Issue: 07 | July 2022 www.irjet.net p ISSN: 2395 0072
Deepu B P1, Dr. Ravindra P Rajput2
1Student, Dept. of Electronics and Communication Engineering, University BDT College of Engineering, Karnataka, India.
2Professor, Dept. of Electronics and Communication Engineering, University BDT College of Engineering, Karnataka, India. ***
Abstract - The air quality monitoring system collects data of pollutants from different location to maintain optimum air quality. In the current situation, it is the critical concern,. The introduction of hazardous gases into the atmosphere from industrial sources, vehicle emissions, etc. pollutes the air. Today, the amount of air pollution in large cities has surpassed the government set air quality index value and reached dangerous levels. It has a significant effect on a human health. The prediction of air pollution can be done by the Machine Learning (ML) algorithms. Machine Learning (ML) combines statistics and computer science to maximize the prediction power. ML is used in order to calculate the Air Quality Index. Various sensors and an Arduino Uno microcontroller are utilized to collect the dataset. Then by using K Nearest Neighbor (KNN) algorithm, the air quality is predicted.
Keywords: Machine Learning, KNN, AQI, Arduino, sensors
Among the most crucial challenges faced in the world today is air pollution. Industrial activity is increasing more regularlydue tothe explosive growth of economy, which is causing air pollution to increase more rapidly. Environmentalpollutionisaseriousissuethataffectsall living things, including humans, with pollution from industry accounting for a significant portion of it. Solid particles such as dust, pollen, and spores, and gases, contribute to air pollution. Carbon monoxide, Carbon dioxide, Nitrogen dioxide, Sulphur oxide, Chlorofluorocarbons, Particulate Matter, and other air pollutants that cause air pollution are released by the combustion of natural gas, coal, and wood, as well as factories,cars,andothersources.Prolongedexposureto air pollution leads to serious health problems, such as lungandrespiratoryillnesses
The annual death toll from household exposure to gasoline smoke is 3.8 million. Exposure to the outdoor airpollutionwillcause4.2milliondeathsannually.9out of10peopleontheearthresideinareaswithairquality that is worse than recommended by the World Health Organization. As per the Greenpeace Southeast Asia Analysis of IQAir statistics, air pollution and associated
problems caused over 120,000 deaths in India in 2020.According to the report, air pollution caused economic losses of ₹2 lakh crore in India. This demonstrateshowcrucialitistopayattentionontheair quality.
Primary pollutantsandthe secondary pollutantsare thetwomajorclassificationsofairpollutants.Onethatis directly emitted into the atmosphere from its source is referred to as a primary pollutant, whereas a secondary pollutant is one that is produced due to the interaction between two primary pollutants or with other elements of the atmosphere. One of the detrimental effects of pollutants emitted into the environment is the degradation of air quality. Also, other harmful effects, such as acid rain, global warming, aerosol production, andphotochemicalsmoghasincreasedinpastyears.
Predicting the air quality is crucial for preventing the problem of air pollution. The Machine Learning (ML) modelscanbeusedforthis.Withtheuseoftrainingdata, a computer can learn how to build models via a technique called as Machine Learning. It is a branch of Artificial Intelligence that gives computer program the ability to forecast outcomes with ever increasing accuracy. ML can examine a variety of data and identify patterns and particular trends. Machine learning is the abilitygiventoacomputerprogramtodoataskwithout anyexternalprogrammingandthisistaskisachievedby using some statistical and advanced mathematical algorithms.
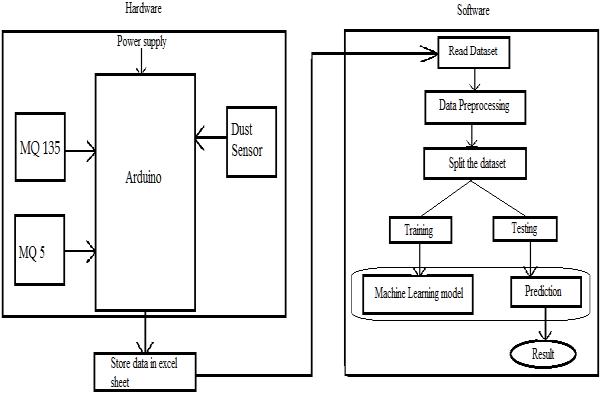
As air pollution has been rising every day, monitoring has proven to be a significant task. The amount of pollution in a given area is determined through continuous air quality monitoring at that location. The information obtained by the sensors reveals the source and concentration of the pollutants in that area. Measurestominimisepollutionlevelscanbetakenusing thatknowledgeandtheMLmodel.
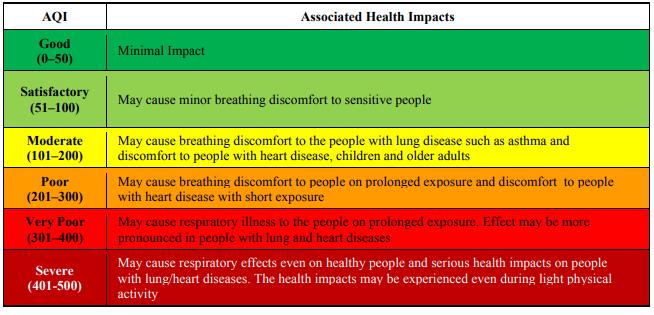
The hardware device consists of three different sensors likeMQ 135airqualitysensor,MQ 5sensor,Opticaldust sensorconnectedtotheArduinounoboard,whichhelps in collecting the pollutants information of the current place.
International Research Journal of Engineering and Technology (IRJET) e ISSN: 2395 0056
Volume: 09 Issue: 07 | July 2022 www.irjet.net p ISSN: 2395 0072
The program for collecting the information is written in the Arduino IDE according to the AQI level specified by the Central Pollution Control Board of India, in the report National Air Quality Index. The information collectedfromthesensorsisrecordedintheexcelsheet, then it is stored in the required file path, which makes the dataset. Further the excel sheet in the .csv file is directlyreadintheMLprogram.
The authors of [1] proposed that Machine Learning algorithmsplaysimportantroleinmeasuringairquality index accurately. Logistic regression and auto regression, ANN help in determining the level of PM2.5. ANNcomesoutwithbestresultsinthepaper.
In[2]authorsgivesthepredictionoftheairqualityindex by using different machine learning algorithms like Decision Tree and Random Forest. From the results, concludedthattheRandomForestalgorithmgivesbetter predictionofairqualityindex.
In[3]authorsproposedmodelbyusingBILSTMwhichis the Deep Learning model to predicted the PM2.5 with improved performance comparing the existing model andproducedexceptionalMAE,RMSE.
In [4] authors used the prediction model results were based on Big Data Analytics and Machine Learning, which have helped to evaluate and contrast current assessments of air quality. The Decision Tree algorithm gavethebestresultsamongallthealgorithms.
The authors of [5] used SVR, and LSTM Machine Learningmodels.TheMachineLearningalgorithmsused for estimating the atmospheric pollutants (PM10 and PM2.5),itwasdemonstratedthatSVRalgorithmsarethe most suitable in forecasting the air pollutants concentrations.
Informationaboutairpollutantsisobtainedfromthe sensors, analysed, and then saved as a dataset. This dataset has been pre processed with a variety of features, which includes attribute selection and normalisation.Onceitisavailable,thedatasetisdivided intoatrainingsetandatestdataset.Thetrainingdataset isthenusedtoapplyaMachineLearningalgorithm.The obtained results are matched with the testing dataset andresultsareanalysed.
Machine Learning algorithm is implemented to predict the air pollution. Machine Learning (ML) is a subfield of Artificial Intelligence (AI) that enables the
software applications to be accurate in predicting the outcomeswithoutbeingexplicitlyprogrammedtodoso.
To predict the new outcomes, Machine Learning algorithms make use of existing past data as the input. With the help ofMachineLearning,a usercan providea computer program huge amount of data, and the computer will only examine that data and draw conclusionsfromit.
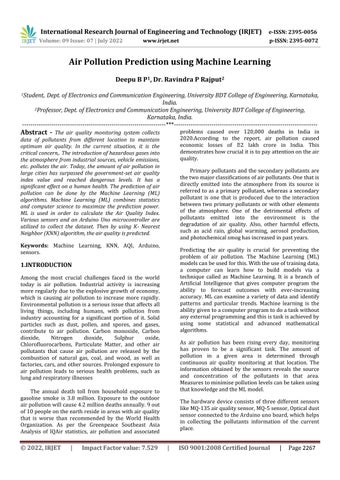
KNN is the Machine Learning algorithm used for the prediction of air pollution. The K Nearest Neighbors (KNN) algorithm is one of the types of Supervised Machine Learning algorithms. KNN is incredibly simple to design but performs quite difficult classification jobs. KNN is called the lazy learning algorithm as it lacks the training phase. Instead, it classifies a fresh data point while training on the entire dataset. It does not make any assumptions, hence it is called non parametric learningmethod.
• Determine the distance between each sample of the trainingdataandthetestdata.
• Todeterminedistance,wecanutilisetheEuclidianor MinkowskiorManhattandistanceformula.
• Sorttheestimateddistancesinascendingorder.
• Votefortheclasses.
• Output will be determined based on class having mostvotes.
• Calculate the Accuracy of the model, if required rebuildmodel.
Fig 1:FlowchartofKNN
International Research Journal of Engineering and Technology (IRJET) e ISSN: 2395 0056
Volume: 09 Issue: 07 | July 2022 www.irjet.net p ISSN: 2395 0072
MQ 135 air quality sensor can detect gases like Ammonia (NH3), sulfur (S), Benzene (C6H6), CO2, and other harmful gases and smoke. MQ5 is a sensitive gas sensor that can detect or sense liquefied gas, propane, butane, natural, other combustible gases in the environmentandsmoke. Optical dustsensorthatmeans itsensesdustbyusinganopticalsensingsystemsuchas alightsource.Itisusedtodetectdustparticlesintheair.
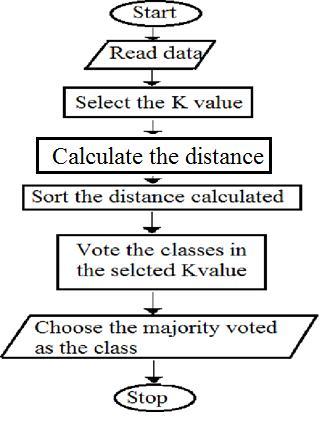
TheCentralPollutionControlBoardof Indiaprovided theAQIinthereportNationalAirQualityIndex,whichis shownintheFig2above.
According to this AQI the program is written in the ArduinoIDEtocollectthedatasetfromthecurrentplace. Further this dataset is recorded in the excel sheet and savedintheparticularfilepathasrequired.
MQ135sensorconnections:TheMQ135sensorVccis wired to the Arduino 5V pin. The GND of MQ5 and GND ofArduinoare wired together,AOofMQ5andA0of the Arduinoareconnected.
MQ5sensorconnections:TheMQ5sensorVcciswired to the Arduino 5V pin. The GND of MQ5 and GND of Arduino are wired together, AO of MQ5 and A1 of the Arduinoareconnected.
Dust sensor connections: Connect the V LED (blue) pinofsensortoArduino5Vpinwithacapacitorof220uf and a resistor of 150 ohms in between. Now connect LED GND (green) and S GND (yellow) to the GND pin of Arduino. Connect the Vcc (red) of sensor to Vcc of Arduino. Next connect VOUT (black) to A3 of Arduino and connect LED (white) of sensor to digital pin 10 of Arduino.
• After the hardware setup, upload the code in the arduinoIDE.
• Opentheexcelsheetwithdatastreamerdownloaded.
• ClickontheDataStreameronthemenubar.
• ClickontheConnecttheDevice.
• SelecttheCOMPORT.
• ClickonStartDataonthetoolbar.
Fig 3:Blockdiagram
Tostartrecordingofdataclick,RecordData.
After collecting the data click on Stop Recording to stop recording, and then click on Stop Data to end collectingdata.
Thisexcelfilecanbesavedintherequiredfilepath
International Research Journal of Engineering and Technology (IRJET) e ISSN: 2395 0056
Volume: 09 Issue: 07 | July 2022 www.irjet.net p ISSN: 2395 0072
generalises well to new and unexplored data.The better outcomesareattainedwhen20%to30%ofthedataare usedfortestingandtherest70% to80%fortraining.
This is done by importing the train_test_split library fromtheSci kit,wheretrainingandtestingratioistaken 80%and20%respectively.
KNN is the Machine Learning model chose for the predictionofairpollution.
The software used is Anaconda Navigator for Python, which features the web based Interactive Development Environmentfordata,codeandnotebookscalledJupyter Notebook. The users could build and arrange the workflows in data sciences, machine learning and scientific computing, using its interface. The Jupyter Notebook is the original web tool for producing computationaldocuments.
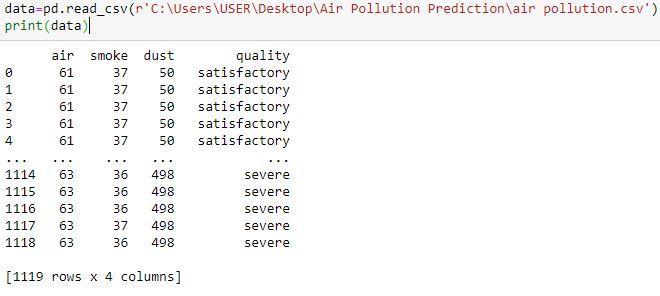
Therequiredlibrariesareimportedandthenthedataset isreadinthepythoncode.
Parameters considered in the dataset are the sensor values of air quality, smoke and dust and the respective quality of air for the values from the sensors of the current place. Hence, there are four columns in the dataset and the number of rows depends on the time thatthedataisrecorded.Thisdatasetissavedasthe.csv fileinexcel.
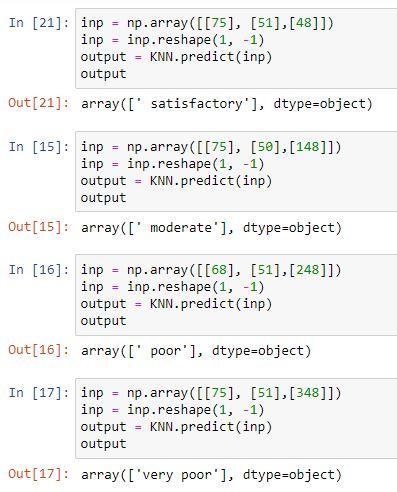
After the ML model is fit, it gives the prediction of air qualitybasedtheAQIdescribed,ofthecurrentplacei.e., whether the air quality is satisfactory or moderate to breathe, or poorsothatpeoplecandecidethe impactof air pollution, or very poor and severe to survive in that place.

The training set is used to train the model, and the testing set is used to determine whether the model
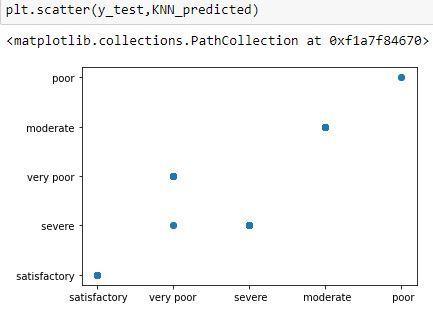
Fig 7:Scatterplotofy_testandpredictedvalues
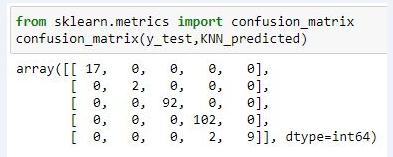
The confusion matrix of the particular dataset air pollution, which is read initially at the time of read datasetisasshownintheFig8below.
Fig 8:Confusionmatrix
International Research Journal of Engineering and Technology (IRJET) e ISSN: 2395 0056
Theaccuracyofconfusionmatrixshowninthefigureis, Accuracy=(17+2+92+102+9)/ (17+2+92+ 102+9+2) =222/224 = 99.1071%
[1] Shreyas Simu,Varsha Turkar, Rohit Martires, “Air PollutionPredictionusingMachineLearning”,2020, IEEE
[2] Tanisha Madan, Shrddha Sagar, Deepali Virmani, “ Air Quality Prediction using Machine Learning Algorithms”,2020,IEEE
[3] Venkat Rao Pasupuleti, Uhasri , Pavan Kalyan, “Air Quality Prediction Of Data Log By Machine Learning”,2020,IEEE
[4] S. Jeya, Dr. L. Sankari, “Air Pollution Prediction by DeepLearningModel”,2020,IEEE
[5] SriramKrishna Yarragunta, Mohammed Abdul Nabi, Jeyanthi.P, “Prediction of Air Pollutants Using SupervisedMachineLearning”,2021,IEEE
[6] Marius, Andreea, Marina, “ Machine Learning algorithms for air pollutants forecasting”, 2020, IEEE
[7] Madhuri V.M, Samyama Gunjal G.H, Savitha Kamalapurkar, “Air Pollution Prediction Using Machine Learning Supervised Learning Approach”, 2020, International Journal Of Scientific & TechnologyResearch,Volume9,Issue04.
Fig-9:Predictedoutcomes
The quality of the air is determined by components like gases and particulate matter. These pollutants decrease the air quality, which can lead to serious illnesses when breathed in repeatedly. With air quality monitoring systems, it is possible to identify the presence of these toxics and monitor air quality in order to take sensible measures to enhance air quality. As a result, production rises and health problems caused by air pollution are reduced.
Thepredictionmodelsbuiltusingmachinelearninghave been shown to be more reliable and consistent. Data collecting is now simple and precise due to advanced technology and sensors. Only machine learning (ML) algorithms can effectively handle the rigorous analysis needed to make accurate and efficent predictions from such vast environmental data. In order to predict air pollution, the KNN algorithm is used, which is better suitableforpredictiontasks.
The Machine Learning algorithm KNN, has given the accuracyof99.1071%intheairpollutionprediction.
[8] K. Rajakumari, V. Priyanka,“Air Pollution Prediction in Smart Cities by using Machine Learning Techniques”, 2020, International Journal of Innovative Technology and Exploring Engineering (IJITEE),Volume9,Issue05.
Volume: 09 Issue: 07 | July 2022 www.irjet.net p ISSN: 2395 0072 © 2022, IRJET | Impact Factor value: 7.529 | ISO 9001:2008 Certified Journal | Page 2271