International Research Journal of Engineering and Technology (IRJET) e-ISSN: 2395-0056

Volume: 09 Issue: 07 | July 2022 www.irjet.net p ISSN: 2395 0072
International Research Journal of Engineering and Technology (IRJET) e-ISSN: 2395-0056
Volume: 09 Issue: 07 | July 2022 www.irjet.net p ISSN: 2395 0072
1Shubham Rajendrakumar Ware, 2Mehul Mahesh Jain, 3Shruti Sanjay Bharati 1,2,3 Information Technology, Terna Engineering College, Nerul, India ***
Many GPS Data Loggers and Visualizers are available to the public to process the data in the background and give the finished output to the user. This approach makes the data gathered opaque to the user and hence the data cannot be used for implementations other than designed by the software which is in use. This makes the availability of the data to the user crucial for advanced modification or analysis. There are few projects which use this concept of making the data available to the user. By keeping the software scalable and robust, we can implement further analytical solutions to the data. This paper mainly contributes to these points while changing the traditional opaque method to the new scalable, portable and robust structure.
Keywords Visualizers, Interpolation, Dataset, Protocols
PositioningSystemtoidentifythelocationofavehicle,person,oritemwithwhichitisattachedandrecordsthatlocation at regular intervals. The data for GPS modules originates from satellite locations; with a growing number of satellites linkedtoGPS,moreexactdatamaybecollected.Themethodworksbydeterminingthetimeittakespacketstogetatthe GPSdevicebyanalyzingthedistancebetweenmultiplesatellites.Therecordedpositiondatacanbestoredinthetracking unit or sent to a central location database or an internet connected computer via the device's cellular (GPRS), radio, or satellitemodem.Thisenablestheasset'slocationtoberepresentedagainstamapbackdropinreal timeorafterthetrack has been processed using specialized software. A GPS tracking system can work in several different ways. GPS devices often are employed in the commercial sector to track the location of cars as theymove. Some technologies may save the data within the GPS tracking system (known as passive tracking) while some others routinely transfer the data to a centralizeddatabaseorsystemviaamodemwithintheGPSunit..AGPStrackingunitisadevicethatusestheGlobal
[1]Whenutilisingcomputerlanguages,visualisingGPSdatamightbedifficult.SomePythonpackagesmaybeusedforthis. Incertaincircumstances,installingandusingthem mightbedifficultifyousimply havea small task todo.Thispostwill demonstrateasimpleandeffectiveapproachforvisualising GPSdatausingPythonandOpenStreetMaps.Therearethree majorcomponentsthatmustbe included,1.Mapimage a mapinanimage formatsuchas.png,.jpg, etc.2.GPS records records made up of (latitude, longitude) pairs. 3. Geographical coordinates converting pixels to geographic coordinates Simply choose a different region of the map by choosing "Manually select a new area." In this scenario, write down the coordinatesofthetopleftandbottomrightcorners(45.8357,15.9645)and(45.6806,16.1557).Thisarticleshowedabasic yet efficient way for visualising the GPS dataset. To create a framework, we used Python and OSM. [2] This research focusesona methodologyforassessingtheaccuracyofportable,commonGPSdevicesforvehiclechase.The experiment was dispensed employing a GPS tracking device BT 338(X) on vehicles adored cars, bikes, buses and it recorded the vehicles' geographical position, velocity, and altitude within the road network. Information pre processing and improvementarerequired,yetsupplementalinformation.TheGPSobservationdata accuratelydeterminedthecars'true whereabouts.Therehavebeennoobviousintrusivefactorsinthetests'environment,suchasdenselysettledareas,woods, magnetic fields, etc. However, the somewhat poor identification of the bike' position by trees and in the proximity of magnetic fields demonstrates that the GPS' positional quality is extremely liable to the environment. Brakatsoulas et al.(2005),Taylor et al. (2006), and Quddus et al. (2006) conferred map matching techniques to resolve this downside (2007).Wehaveatendencytofeelthatlocation basedGPSchaseinformationmaybevaluableforrouting,qualitypattern detection, and general journey navigation. However, in situations demanding great geographical precision, such as parking, emergency rescue, and the like, the accuracy is insufficient. The limited effective lifespan of GPS devices is a disadvantage(Ryan etal.2004).The data gatheringportion ofthe experiment inthisresearch lastedat mosttwohours; thelengthofthedevicesisunimportantherebecausetheoperatingtimeforthedeviceisaround11hoursafterbeingfully replacedandincontinuousmode.[3]Theprimarygoalofthisreviewarticleistoaddressmanychallengesthatarisewhile processingGPStrackingdataand,asaresult,establishabasicstrategyfordataprocessing.Thesoftwarecodeusedinthe
International Research Journal of Engineering and Technology (IRJET) e-ISSN: 2395-0056
Volume: 09 Issue: 07 | July 2022 www.irjet.net p ISSN: 2395 0072
procedureisavailableforpublicuseasa referenceforanybodyinterestedinusingit.Thestudymakesuseof real world GPStrackingdatafrom300automobilesthatwereinitiallyacquiredtoexamineCO2emissionscausedbycommerce.
TheprocedureappliesmethodstomatchGPSdatawiththeroadnetworkinordertoimprovethedataperformancebased on a clear definition of movement. [4] For a completely unrelated objective, I conducted research on shrinking and zoomingdigitalimagesusingtheinterpolationprocess.Thisarticleprovideszoomingapplicationsbasedongeometricand linguistic zooming algorithms, such as classic zoom, spotlight zoom, and glance zoom. In image processing, picture zoomingisacriticaltechnique.Ingeneral,zoomingentailstwosteps:Theadditionofadditionalelementlocationsand,as a result, the attribution of a grey level to those places. The next step in image downsizing is row and column deletion, which is the analogous process of pixel replication in these cases. Zoom in and zoom out features were dynamically enforcedinthefilezoomingprogrammes.Thevisualoutcomeoftheadditiveinterpolationalgorithmissuperiorthanthe closestpurposeinterpolationmethodsinceitiscontinuous.
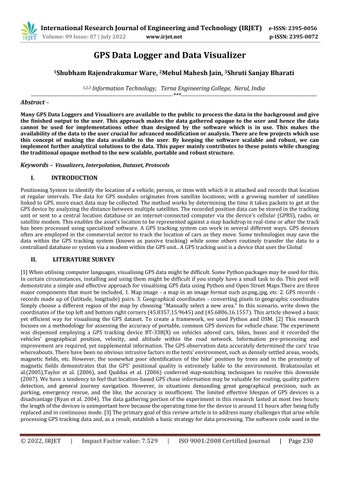
Fig:ProposedBlockDiagram.
TheproposedsystemistogetthedatathroughaGPSsensor.Betterthesensor, moreaccuratethereadingwillbelogged. We can install the sensor on any entity such as a logistics unit and track the path travelled by the device in given time. AfterinstallingthesensortotheobjectthedataisthencapturedusinganAPIwherethe noisewillbereducedandstored toafile.Welogthedatathroughaserialportandstoreitina.csvfile. Theloggingparameterswillbetakenfromthe user with the help of a user interface developed which is scalable and robust and has space to add features. A visualization featurewillbeintegratedintheuserinterfaceforeaseofaccessoffeaturesandtheuserdoesnothavetoaccessdifferent softwares.Wecanimplementmanyextrafeaturesfordatarepresentation,herewevisualizethepathtakenbythedevice with a simple arrow starting from the origin to the endpoint of the data logged. Hence getting a full route of the device travelledandthencanbeusedforfurtheranalysis.
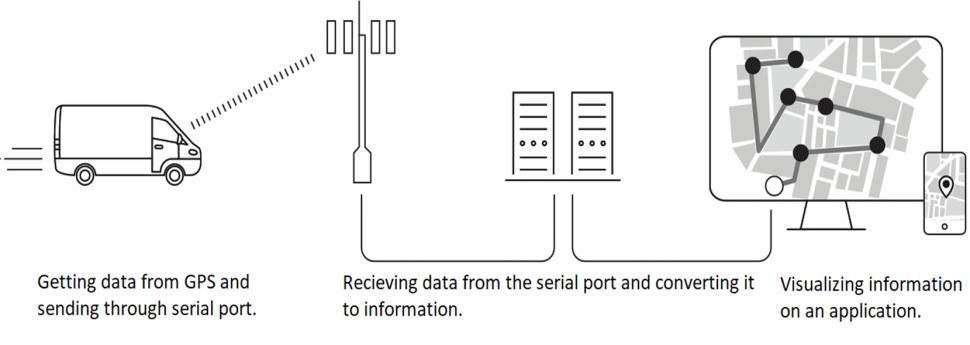
Fig:Architecturediagram.
International Research Journal of Engineering and Technology (IRJET) e-ISSN: 2395-0056
Volume: 09 Issue: 07 | July 2022 www.irjet.net p ISSN: 2395 0072
The system has 7 different sub modules, namely GPS sensor, microcontroller, User Interface, File reader, Storage unit, GmapsJavascriptAPI,Browser.Eachhasitsownindependentfunctionalityandhencemultiplehardwaresarecompatible withthesystem.
Thesystemconsistsof3maincomponents i.e. GPSModule,UserInterfaceandVisualizer.
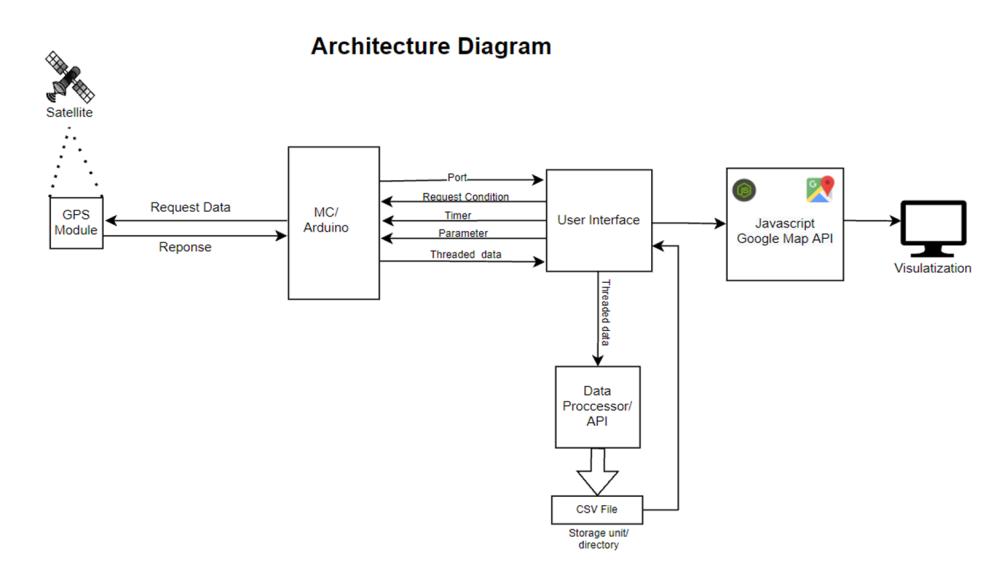
●InthisprojectwehadusedaUbloxNeo9MGPSModule.
●Itisacheapandportablemodule.
●IthasexcellentRFintegrationmitigation.
●Maximumpositionavailabilitywithconcurrentreceptionof4GNSS.
●LowPowerconsumption.
Fig:GPSUbloxNeo9M.
This device may be used for asset tracking, telematics, navigation, wearables, cameras, unmanned vehicles, automotive, road vehicle navigation, and autonomous driving, among other things. Users of GNSS anticipate instant position data, which is not always achievable due to poor signal circumstances; as a result, location, help, and correction services have becomecriticalfeatures.Ubloxhasthemostinnovativesolutionsfortheseissues.
Forthisproject wechoseC#astheprogramminglanguageasitconsists ofmanybuiltinlibrariesfordata manipulation, crossthreading,serialportcommunicationandWindowsFormFormat.Intheuserinterfacethereconsistsof2modesfor selection of logging modes. The inputs are handled by event handlers and the interface is dynamic. Options for selecting themultipleloggingformats areavailable suchasonlycoordinates,onlycoordinatesandtimeandcoordinates, timeand altitude. After selection of logging format, we have to specify the interval between the logging of data will take place. Selection of serial port on which the device is connected to the computer on which the software is installed in case multipledevicesareconnectedtothesystem.Lastlyanexportbuttontosavethedataloggedbythesoftwareinaspecified locationonthesystemmemory.
After selection of all these parameters we can start the script to log and save the data. Pressing the stop button will terminatethescriptfromlogging.AVisualizebuttontostartthevisualizationoftheloggeddatainaseparatewindowof any browser using Google Maps JavaScript API. This will summarize the functioning of the features provided in this software.
International Research Journal of Engineering and Technology (IRJET) e-ISSN: 2395-0056
Volume: 09 Issue: 07 | July 2022 www.irjet.net p ISSN: 2395 0072
Fig:DataLoggingandVisualizerUserInterface.
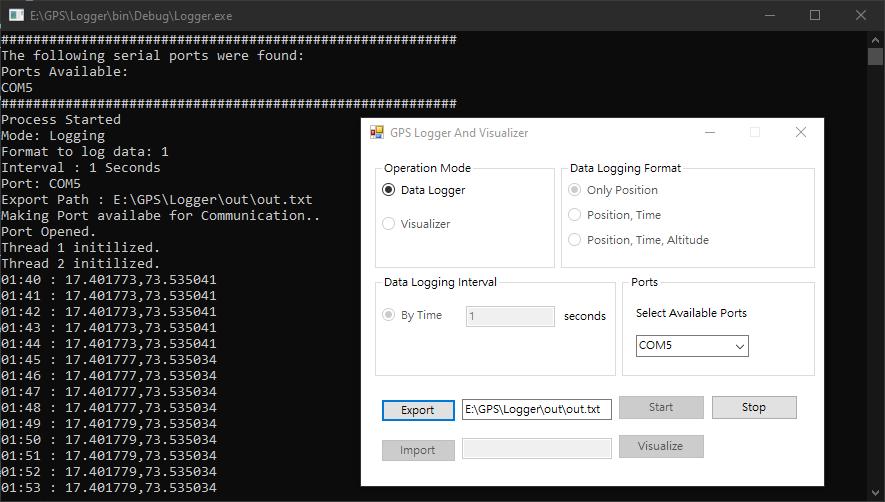
Aconsolewindowformonitoringthedataloggedinrealtimeandtokeeptrackoferrorsoccurring duringruntimeincase anymodulefails.
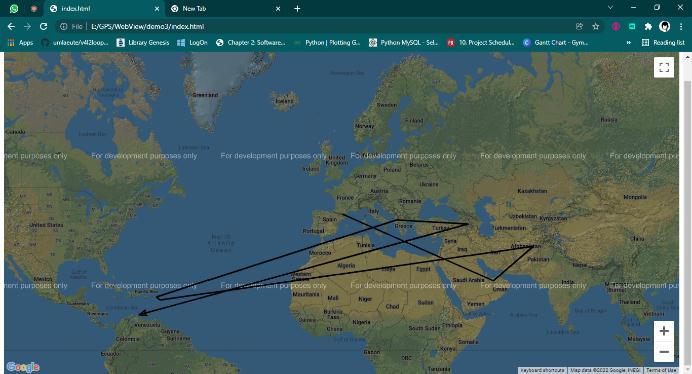
GoogleMapsprovidesajavascriptAPItoloadanarrayandtoimplementusingPolylines.Thispaperusesjavascripttoget thedataloggedfroma.csvfileandloadsitintotheAPI.Wecanaddmultipleoverlaystomakethedatavisualizationmore detailed.
Fig:DataVisualizer.
4. Filestructure.csv
.csvisastandardfilestructuretosavecommaseparatedvaluesinafileforeaseofaccessandsimplefilehandling..csv file reader can be implemented in any programming language and hence can be used by multiple programs to analyze the data.Inthispaperthe.csvispassedtoajavascriptwhichfurtherreadsandinterpretsthedataandvisualizesitinbrowser windowsusingHTMLandCSS.
International Research Journal of Engineering and Technology (IRJET) e-ISSN: 2395-0056
Volume: 09 Issue: 07 | July 2022 www.irjet.net p ISSN: 2395 0072
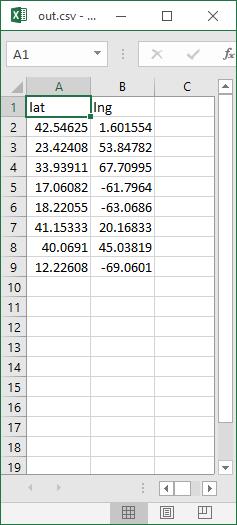
Fig: .csv Filestructure.
GPSsensorandmicrocontrollerareconnectedusingRX,TX,GND,VIN.LoggeddatafromtheGPSarecommunicatedtothe microcontroller as a Request and Response protocol. The microcontroller requests data from the sensor while the gps is gatheringthedatathroughthesatellites.Thisdatastreamisrunningfromthepowerupmomenttillthepoweriscutoffto the microcontroller. As the data request sequence can be initiated by the UI anytime, the sensor cannot be kept in a standbymode.
The microcontroller and the user interface has sub functions i.e port communication, request sender, timer, parameters, threaded communication. The user interface checks on which port the microcontroller is connected and establishes a connectiontocommunicate.Theuserinterfaceandtheserialcommunicationisestablishedontwodifferentthreadswhich helps in two separate functions to run simultaneously hence seamless running of the program. If both the tasks are carried out on the same thread the program will run a single function at a single time which results in data loss and a StreamWritercannotbeinitializedonthesamethreadasthedataisstillinreceivingmode.WeneedtheStreamWriterto be run parallely as if the connection fails during logging the data received from the sensor does not get lost. We run the StreamWriterparallelforlivedatasavingassoonasavaliddataentryoccursinthedatastreamoftheserialport.Thefirst threadsendstherequesttothemicrocontrollerwiththeparametersselectedbytheuserontheuserinterface.Thisthread issolelyusedforthebaseprogramandthesendrequest,nodataloggingisdoneonthisthread,whilethesecondthreadis usedforloggingthedatafromthesensor.Adelegateisusedtotransferthedataforprocessingfromthesecondthreadto the first. A timer is started on the start of the program to keep the time parameter in check and to rearrange the coordinatesincaseofloggingerrors.Asthemicrocontrollercaneithersendorreceiveatasingletime,hencewedeveloped a protocol suchthatthestreamisinresponsemodeuntil a newsetofparametersisnotsenttothemicrocontroller.The stream is checked for an end bit to confirm the end of a single stream. This confirms a meaningful response from the microcontrollerandnowcanbewrittenbytheStreamWriter.
TheStreamWriterhasaccesstothestorageunitsandenablescustomizedsavingoffilesinanydirectoryonthedisk.The saved file is then provided to a javascript which converts it into a json string. This string can be used by Gmaps API to visualizeinacertainway.InthiscasealineconnectingthecoordinatesonGoogleMaps.
Getting the data from the serial port in a thread and using cross threading to use the serial data to write in a file. This challenge was overcome by using a delegate to temporarily save in and further forwarding to another function for processingasdirecthandlingofdatafroma cross threadisnotpossible.
TheGPSsensorshavemodestogetafixonthesatellites.Generallyittakesaround1 2minutesforahotstart.Hotstartisa conditionwhenthesensorhasgotafix/lockonasatelliteinthepastsometime.While afreshstartmeansthesensorhas no prior knowledge of the positions of the satellites hence it takes considerable time to get the first lock on a satellite.
International Research Journal of Engineering and Technology (IRJET) e-ISSN: 2395-0056
Volume: 09 Issue: 07 | July 2022 www.irjet.net p ISSN: 2395 0072
Generally it takes around 5 10 minutes for a fresh start in a metropolitan city where there are many servers which save the location of the satellites and help in getting the first fix while the backup servers are less in rural and distant areas which contributes to large fix time. This fix/lock time can be between 30 mins to 1 day. The next fix is frequent and depends on the availability of satellites and weather conditions in the area. The sensor data drastically depends on the weatheringconditionsandplaysacrucialroleinaccuracyandnoisevolume.
We have concluded the non opaque methodology will give more analytic features to the user. This enabled the user to access the data and make custom representations to it for user friendly visualization. This system allows the developers and users to generate their personalized data, then to integrate this data through the use of sophisticated visualization tools. Furthermore, the approach enables the data to be shared and compared with expert systems and AI. The system usesoff the shelfinfrastructure,protocolsandanewlydeveloped prototypewhichallowsgatheringofdata andthencan beanalysed.
[1]LeoTišljarić,“GPS visualization Python”2021MITLicenseCopyright(c)2021
[2]42BroadwaySuite12 400,NewYork,NY,10004,US©2021TheThingsBoardAuthors
3]NikolaiJanakiev”Geospatial storytelling”TheMITLicense(MIT)Copyright(c)2016
[4]Zhao, Xiaoyun & Carling, Kenneth & Håkansson, Johan. (2014). Reliability of GPS based traffic data: an experimental evaluation.10.13140/2.1.2960.2242.
[5] Cai, Li & Zhou, Yifan & Liang, Yu & He, Jing. (2018). Research and Application of GPS Trajectory Data Visualization. AnnalsofDataScience.5.10.1007/s40745 017 0132 1.
[6]ShvetaChadda,“ZoomingTechniquesforDigitalImages:Asurvey”IJCSTVol.3,Issue1,Jan. March2012[
[7]Schwab, Michail & Hao, Sicheng & Vitek, Olga & Tompkin, James & Huang, Jeff & Borkin, Michelle. (2019). Evaluating PanandZoomTimelinesandSliders.10.1145/3290605.3300786.
[8] Wang, Junqiu & Yagi, Yasushi. (2008). Integrating Color and Shape Texture Features for Adaptive Real Time Object Tracking. IEEE transactions on image processing : a publication of the IEEE Signal Processing Society. 17. 235 40. 10.1109/TIP.2007.914150.
[9]Yang sa, “Improved bilinear interpolation method for image fast processing” intelligent computation technology and automation(icicta),2014,7thinternationalconference,oct.2014,pp.308 311