Comparative Analysis of Gaussian Filter and Median filter in Liver Cancer detection
1 HOD & Professor, Computer Science and Engineering, Adichunchanagiri Institute of Technology, Chikmagalur, Karnataka, India,
2 4th Sem M.tech Computer Science and Engineering Adichunchanagiri Institute of Technology Chikmagalur, Karnataka, India
3 Assistant Professor, Computer Science and Engineering, Adichunchanagiri Institute of Technology, Chikmagalur, Karnataka, India.
4 Assistant Professor, Computer Science and Engineering Adichunchanagiri Institute of Technology, Chikmagalur, Karnataka, India. ***
Abstract Heptocellular carcinoma, also known as liver cancer belongs to themalignant tumors which is derived from the Hepatocytes or their precursors, which is more common among males with various risk factors. If untreated it might lead to multiple complications.The treatment ranges from chemotheraphy to surgery both of which demands segmentation of tumor region.As liver is placed in between complications of tissuessourrounding. Many techniques in image processing havebeen used including CNNbut promising results were shown by U Net.The image can neither be segemented nor be classified accuratly without removing the noises present in it. These steps are prior to the classfication and segmentation. In this paper we are detailing about the pre processing techniques like median filter and Gaussian filter usedbeforethat.
Key Words: Gaussian filter, medianfilter, Preprocessing, Liver tumor, comparision
1.INTRODUCTION
Medical imaging has been an active and beneficial field when it comes to image processing. Uncontrollable growth of the cells within the liver region is called Liver cancer. Therecanbe beginninggrowthofthecellsorthe malignantgrowth. Hepta cellularcarcinomaisoneofthe most common type of malignant tumor. Majority of the tumorsareformedbecauseofthedamageortheinjuryto DNA, cells will be considered as the cancer cells, when comparedtotheregularcell,thecellwillkeepthedamage andthecell dies if the DNA is damaged. It will results in makingunnecessarynewcellsifthedamagedDNAisnot repaired.
TheLivercancerisreferredasmetastasiswhentheLiver cancer cells spread and when it moves to other parts of thebody,sothatitwillbeginstobecometumours which willbepositionsinthetissuesofthe
humanbody.Metastasisoccurswhen thecellsofcancer spreadfromonepartofthebodytootherareaslikewhich may include the bones, lungs colon cancer or rectum cancer tend to spread to liver. This metastasis Liver cancerhave symptomslike abdomen pain and weakness ofotherformsofLivercancer,italsocausesweightloss, fatigueandyellowedskin.
1.1 Growth of Tumors

Theneoplasticgrowthoftissueinliverisalivertumor.It can be benign that is non cancerous or it can also be malignant which is cancerous due to the redundant growth found in the liver. The cancer is classified into two types “primary tumours” which will occur in the liver cells or tissues and the second type of cancer is “secondary tumours” which occurs in other sites and spread to the tissues of the body. The cancer which occursintheliveritselfiscalledasprimarytumoursand thecancerwhichhavebeentravelledfrom otherpartsof the body is called as secondary tumours. Primary tumours are again divided into benign tumours and malignantcancers.
1.2 Causes
The primary liver cancer is caused due tothe heredity growth of cancer cells, this will start from the liver parts only.TheHeptacellularcarcinomaarethetrueor primary livercancers.ThisHCCwillmoveintothebloodvesselsof the nerves, muscles, bones, fat tissue present in the body andit can also spreadto anywhere in the body. These primary tumours can also be called as benign tumours which may have abnormal tissue growth results in traumaticinfectionsor inflammationcausedintotheliver. Metastasis liver canceris calledas secondary liver cancer. Thecancer cells in the liverdue to which there will be a refashion of the liver. If the non cancerous liver region is affectedbythelivercanceritwillmakethechangestothe
International Research Journal of Engineering and Technology (IRJET) e ISSN: 2395 0056
Volume: 09 Issue: 07 | July 2022 www.irjet.net p ISSN: 2395 0072
structure of the liver, or it will be broken and need to rebuild it. The entire liver will be affected by the cancer cells by the growth of new cells in the body, so liver cancer is a deadly and dangerous disease. To detect the liver cancer if the cancer cells are in the liver then there willbeadifferenceinthetextureoftheliveritcanresultin thebrokentexturewhichwillbeatamaximumrateifitis observed.
2. Methodology
Figure1depictsblock diagramofdetectionoflivercancer usingCNNandSVM
Input
Pre Processing Segmentation Output Classification
Figure -1: MethodologyofProposedSystem
The input here is CT scan images. It is very obvious to havenoisesin theCT scanimageswhich isthereason of detoriation in the image and makes it difficult to extract the vital information Hence, the pre processing steps becomes essential. This paper deals with two filters and comparisonaccuracybetweenthem.
3. Pre processing
As elemental, the origioanl RGB imageis converetd to a gray scale image. The process continues further by applicationofgaussianfilterwhichhelpsinremovingthe gaussian noise. The high frequency content of image is sujected to median filter. Ostu thresholdingis applied to further to seprate foreground image and backgrond image.
The pre processing steps are detailed below:
1.ConversionofRGBtogreyscale.
2. ApplicationofGaussianfilter
3. Applicationofmedian filter
4. Ostuthresholding
Ifwechooseawindowintheimagewhoseimagepixelsare 0, 0, 0, 0,179,243,0,65,159.The following two steps are applied.
Conversion of RGB too greyscale.
The process of converting the RGB to greyscale is carriedoutbyusingthebelowequation


��′=((0.3∗��)+(0.59∗��)+(0.11∗��))
Where,G=greenpixelintensities. R=Redpixelintensities. B=Bluepixelintensities. ��′=greypixelintensities.
The motive behind this conversion is to minimize the amount of data in RGB image. RGB has 3 channels and each channel has 8 bits of information in it, when converted to Grey scale, 3 channels is reduced to 1 channel. As we needonly theimage andnot the color of it,thisisnotconsideredtobealossofdata.
Application of Gaussian filter
Theobtainedgreyscaleimagecannotbeuseddirectlyas theremightbesomerandomvariationsintheintensities ofthe pixel values which can be termed as noise. These noises can be gaussian noise, salt and pepper noise, impulse noise or other any other forms. The obtained greyscale image cannot be used directly as there might besomerandomvariationsintheintensities ofthepixel values which can be termed as noise. These noises can be gaussian noise, salt and pepper noise, impulse noise orotheranyotherforms
The below equation is 2 dimension gaussain smooting filter.
Where �� = ���������������� ���� ���������������� ������������, when �� is wider then greater is the smoothning �� and �� are width andheightofthekernelrespectvely
Application of median filter
Medianfilter,whichishelpfulinremovingnoisessuchas salt and pepper nose, implusivenoise presentin the image. Median filter does not work on the concept of weightedsum,ratheritscomputingthemedianofofthe pixelsineachwindowcenteredaround[i,j].
Thetwostepsarefollowedinmedianfiltering.a.Tosort thepixelsintotheascendingorderbygreylevelb. Select themiddlevalueofthepixelasthenewvalueofpixel[i,j].
The first step would be arranging in ascending order. 0,0,0,0,65,159,170,243. In which themedian value is 0. Hencereplacedby170inthefirstpixel.Thisisdonetothe entire image with thestrideof 1. The zeros around are padded to retain theboundary pixels . The equation is shownbelow
Volume: 09 Issue: 07 | July 2022 www.irjet.net p ISSN: 2395 0072
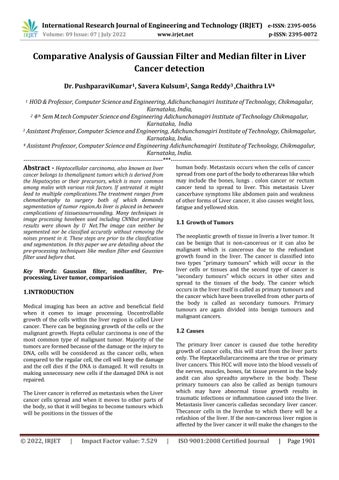
Figure 2 illustrates thepre processing stepsfor liver tumor detection for stage 1. The steps includes the image upload, gaussian filtering, Median filtering, Greyscaling and the binarizedimagewhichisdonethroughthresholding,whose imageisalsoshownbesidethebinarizationattheend.
Ostu thresholding.
In ostu thresholding, the number of repeataton of each pixel value are computed according to which a graph of values of pixels and number of their repeated values are drawn against each other and divides the image into 0’s and1’sassistingbinarization
This kind of thresholding is done to binarize and to seprateforeground and baground image.Ifconsidered, t0 tobecompleteoneregionthenitcanbegivenas{0, …..t} and t1 will be {t, t+1,l…..l 1,l}. where, t is the threshold value. Which is derived from the probablity value:
Figure 3:InputabdomenImage
Where, and are index of rows and columns respectively. and are numberof rows and colums respectively.Andvalueofiwillbe1..l
4. Results and Analysis
CT scanned images of Abdomen of stage 1, stage2and stage 3 of liver tumor are used here as input to conduct experimental results. Stage 1 means first stage of liver cancerandStage2meanssecondstageoflivercancerand same goes for stage 3. An comparative analysis graph is being depicted at the end of the results. To show the perfomance comparision between gussian filter and the medianfilter.
Figure 3 illustrates the CT scanimage of abdomen To pre process, initially the data must beselected. By clicking on choose file as shown in home page snapshot, the CT scan image is selected. The bone cancer image data is collected from the liver dataset option in which the database is storedinthefolder.
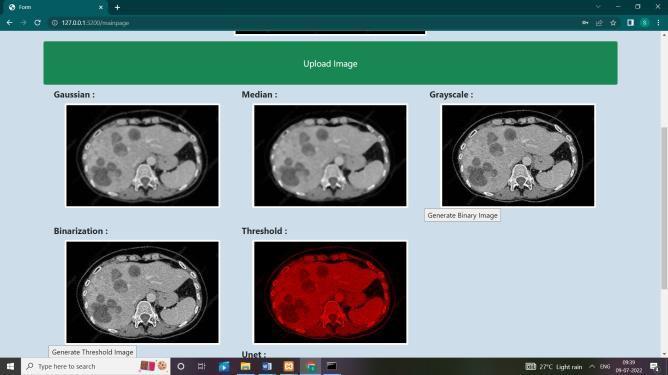
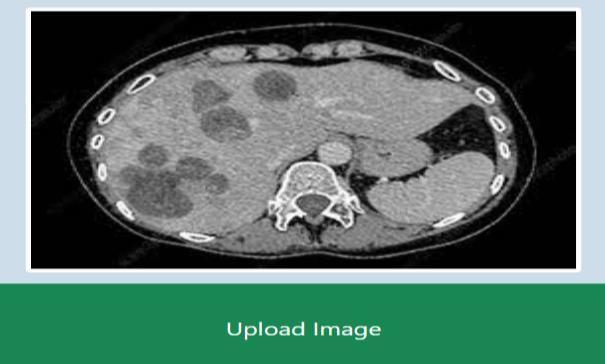
Figure 4 : Applicationofgaussianfilter
Figure 4 shows the filtered image by using gaussian filter. This noise in the image is produced if the image is not captured properly. In the case, CT scan image of patient is nottakenproperlyduetosomemovements,therewill bea noise in the image and a unwanted distortions in the original image which cannot be used for the further processes as it does not produce the properresult.So,itis important to remove the noise if there is a noise else not necessary.Ingaussianfilteragaussiankernelof3x3matrix isconvouledwiththeinputimage.
Figure 5 :Applicationofmedianfilter
Figure 5 shows the filtered image by using median filter. The other kind of filters like salt pepper noise is removed using the median filter, where as the gaussian noise is removedusingthegaussianfilter.
Figure7illustratestheprocessingstepsforlivertumor detection for stage 2. Initially the image is greyscaled, furthermore the filters are added for the removel of noises. Eventuallybinarization is done by applying ostu thresholding method which divides the image into foregroundandbackground.
Figure 6 : Binarizationoftheimage
Figure6showstheBinarizedimage whichistheresult ofthresholding.Thethresholdsetsthevalue, belowwhich the pixel intensities willbe 0’s and above it the pixel intensiteswillbe1.
Figure 8 : Pre Processingstepsforstage3 livertumor
Figure 8 illustrates the pre processing steps for liver tumor detection for stage 3. The first step includes the image being greyscaled, nextto removenoise filters are added.Attheendthresholdingisincoperatedtobinarize the image andsimplify thefurther calculation. A analysis graph for the comparasion between two filtering techniques will give the breif idea about the performanceaccuracy.
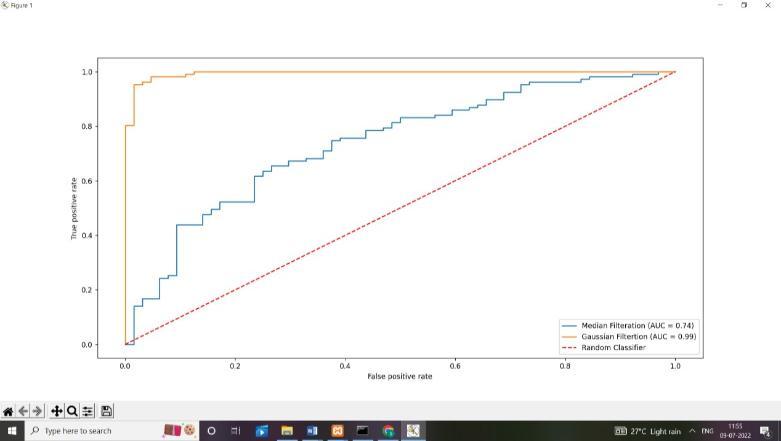
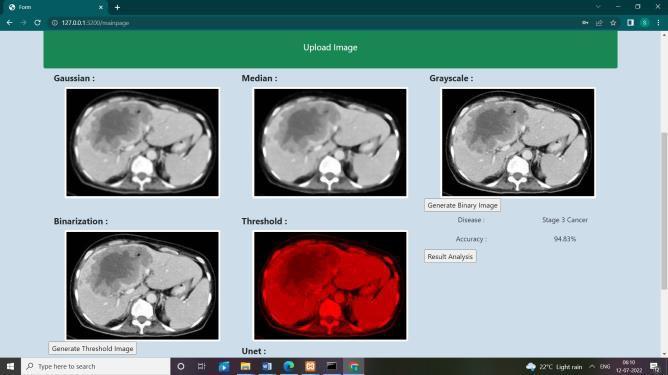
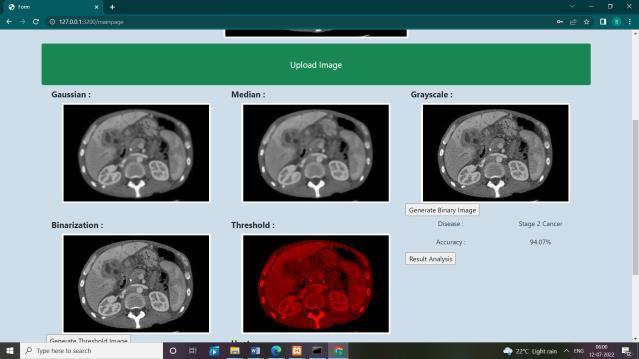
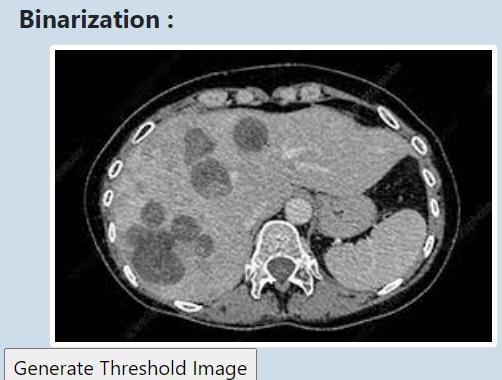
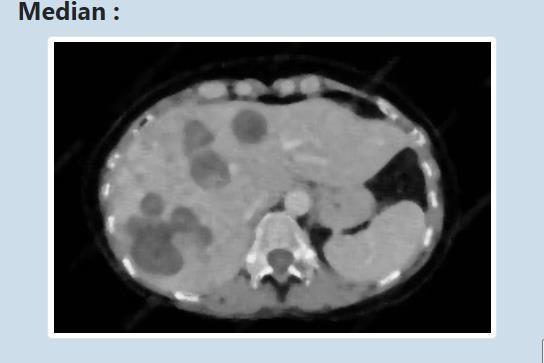
Figure 7 : Pre Processingstepsforstage2livertumor
Figure 9: ROCcurveshowingcomparativeanalysis betweenmedianfilterandGaussianfilter
International Research Journal of Engineering and Technology (IRJET) e ISSN: 2395 0056
Volume: 09 Issue: 07 | July 2022 www.irjet.net p ISSN: 2395 0072
Figure 9 shows the comparaive analysis of Median filter and Gaussian Filterthrough an ROC ( reciver operating characteristic curve) graph. The curve depicts whichamongthemodels performwell in the field of classification.AUCofboththefiltersareshownabove.The graph is plotted with FPR ( False postive rate ) at X axis andTPR(TruePositiverate)atY axis.ThegreaterAUC( areaundercurve),thehigheristheaccuracy,andlowerthe AUC ( Area uner curve)lesser the accuracy. As shown Gaussianfilterhasthe AUC with0.99andhencethebetter onecomparatively
5. Conclusion
Noises in the image whichcan make image blurry and unclear, can cause multipleobstcales in futherimage processingtechniqueswhichneedstoberemovedby using somefilters.
Here,wehavediscussedbytakingdatasetofabdomenimages and applying twokinds offilters i.e.,gaussian filter and the medianfilter.By experiments,Gaussian filters shows better performance level than the median filter by giving 99 % accuracylevel
REFERENCES
[1] S. Gunasundari, M. Suganya Ananthi, “Comparison nd Evaluation of Methods for Liver Tumor Classification fromCTDatasets ”InternationalJournal ofComputer Applications,Vol.39 No.18,2012.
[2] Xing Zhang, JieTian*,Dehui Xiang, XiuliLiandKexin Deng,“ Interactive Liver Tumr Segmentation from CT Scans using Support Vector Classification using Watershed,”33rdAnnualInternationalConferenceof IEEE EMBS Boston, Massachusetts USA, August 30 September3,2014
[3] E LiangChen,Pau Choochung, Ching LiangChen, ong Ming Tsai andChein IChang, “AnAutomatic Diagnostic System for CT Liver Image Classification,” IEEE transactions onBiomedical Engineering, Vol. 45, No6, June1998.
[4] XuechenLi,SuhuaiLuo,JiamingLi,“ LiverSegmentation fromCTImageUsingFuzzy ClusteringandLevel Set”, JournalofSignalInfromationProcessing,2013.
[5] Nadja Gruber, Stephan Antholzer, Werner Jaschke, ChristianKremser, MarkusHaltmeier,"AJointDeep LearningApproachforAutomatedLiverandTumor Segmentation”, Computer Vision and Pattern Recognition,2019.arxiv:1902.07971
[6] OlafRonneberger,PhilippFischer,andThomasBrox“U Net: Convolution Nnetworks for Biomedical Image Segmentation”, spring International Publishing Switzerland2015
[7] Chartrand,G.,Cresson,T.,Chav,R.,Gotra,A.,Tang,A.,& DeGuise, J. (2014, April). Semiautomated liver CT segmentation using Laplacian meshes. In Biomedical Imaging (ISBI), 2014 IEEE 11th International Symposiumon(pp.641 644).IEEE
[8] Chen, Bin, et al."Segmentation of liver tumor via nonlocalactivecounters."ImageProcessing(ICIP),2015 IEEEInternationalConferenceon.IEEE,2015