International Research Journal of Engineering and Technology (IRJET) e ISSN: 2395 0056

Volume: 09 Issue: 07 | July 2022 www.irjet.net p ISSN: 2395 0072
International Research Journal of Engineering and Technology (IRJET) e ISSN: 2395 0056
Volume: 09 Issue: 07 | July 2022 www.irjet.net p ISSN: 2395 0072
1PG Scholar, Manufacturing Systems Management, GEC Thrissur, Kerala, India,680009
2Assistant Professor, Department of production engineering, GEC Thrissur, Kerala, India 680009 ***
Abstract: Optimization of a manufacturing process results in higher productivity and reduced wastes. In this project, production parameters of a local steel bar manufacturing industry are to be optimized by using Define, measure, analyse, improve, andcontrol (DMAIC)methodology. Themain aim of the research was the identification of the significant factors that affects the product quality of TMT bar, and the methodology to optimize the TMT steel bar manufacturing process to improve the product quality. Conducted a study on the selected steel industry and identifiedaproblemconcerning the quality of the product, which provides a scope for the improvement of the production process. Production data is collected and analysed to identify significant factors affecting process performance and their effect on product quality. The significant factors are identified and controlled to optimized level using factorial experimentation. Different softwares like MS Excel, Minitab etc. is used for the analysis and measurement. The sigma level of the manufacturingprocessis improved.
Keywords TMTsteelbar,DMAIC,Minitab,Sigmalevel
Manufacturing industries worldwide are undergoing a revolutionarychangeinoperationssince1980’s.Consumers becamemoredemandingandqualityconcerned.Nowadays thekeyfactorinthesurvivaloftheorganizationiscustomer satisfaction. The increased customer demand and the presenceofcompetitorsforcetheindustrytoimprovethe product, processes and services. Process optimization is essentialtoreduceproductionvariationandachievehigher yield. Process optimization has ever remained a serious problem in manufacturing industries particularly steel manufacturing.Thisstudyisfocusedonsteelindustrywhich manufacturesTMTbars. TMTbarsorThermo Mechanically Treatedbarsarehigh strengthreinforcementbarshavinga toughoutercoreandasoftinnercore.Ithasawidevariety of applications like concrete reinforcement structures, bridgesandflyovers,dams,etc.
In this project a study on quality improvement through processoptimizationiscarriedoutinasteelmanufacturing industry.ThemethodologyusedwasDMAICanalysis.DMAIC (Define,measure,analyze,improve,andcontrol)analysisisa data drivenqualitystrategyusedtoimproveprocesses.As partoftheDMAICanalysis,adetailedstudyiscarriedoutin thesteelindustryandidentifiedtheprocessparametersin
the TMT manufacturing process. Various tools and techniquesareusedtoconductDMAICanalysis.TheCritical to Quality (CTQ) factors of the TMT bar are identified. Similarly, the Key performance input variables (KPIV) are identifiedandtheireffectontheCTQsareanalysed. Herean attempthasbeen made toconductDesignofExperiments (DOE) to select a set of optimal combination of process parameterstogetadesiredvalueofYield
Shigemorietal.[1]conductedstudyonasteelmanufacturing process.Thequalitydesignsteelwithagivenspecificationis produced efficiently using a Just In Time based linear regressionmodel.StefanMarkulik[2]describesthefocuses onthesearchfortherootcausesoftheoccurrenceofforeign materialrolling.The4Mmethod(man,machine,method,and material)wasusedtocategorizethecauses.K.I.Ahmadetal. [3]statesthatnumberofapproachesinqualityimprovement, viz,lean,sixsigma,PDCA,5Setc,canbeemployedtoachieve the desired level of quality taking into consideration the intricacies of the organization. This journal will provide a guidelinetoapproachforimprovingqualityandproductivity improvementinrollingproducts.
Sabiya.K[4]discusseswork,leantechniquesareappliedto themanufacturingofrandomrodsataleadingmanufacturing companyofTMTreinforcedbarstoreducethescrap.MUDA conceptofleantechniqueisappliedhere.Gauretal.[10]in his work suggests proper control of final quenching temperatureleadsoptimumstrengthwithhighUTS/YSratio. The basic requirements of rebars nowadays are low cost deformed bars with yield strength of 500N/mm2 with adequateductilityfortheseismiczones.Nearlyabout55to 60percentofIndiafallsundertheseismiczone.
Lindermanetal.[5],definesSixSigmaasanorganizedand systematic methodfor strategic process improvement and new product and service development that relies on statisticalmethodsandscientificmethodstomakedramatic reductionsincustomerdefineddefectrates.SixSigmahasits origininqualityengineering,whichtraditionallyhadastrong emphasisonstatisticalmethods.Lokkerbol[6]inhiswork describes The DMAIC (Define Measure Analyze Improve Control) method in Six Sigma as an approach for problem solving.
International Research Journal of Engineering and Technology (IRJET) e ISSN: 2395 0056
Volume: 09 Issue: 07 | July 2022 www.irjet.net p ISSN: 2395 0072
VariousapplicationofDMAICanalysisindifferentindustries areavailable. Gupta,etal. [7]demonstrates,thesix sigma DMAICphasesapplicationtoenhancetheprocesscapability (longterm)forbeadsplice.IneveryphaseofDMAICmethod, a compound of both techniques qualitative as well as quantitative was utilized. Jadhav, et al. [8], addresses the problems that are facing in a large steel company in a developing country like India regarding defects in the end product. Khawaretal.[9],Productionparametersofalocal steel bar manufacturing industry is optimized byusingsix Sigma Define, measure, analyze, improve, and control methodology.Inthistheyidentifythesignificantfactorsalong withtheoptimumlevelsthataffectstheprocessyield,andthe methodology to optimize the steel bar manufacturing process.
Designofexperiments(DOE)isasystematic,efficientmethod that enables analysts to study the relationship between multipleinputvariables(factors)andkeyoutputvariables. Sundarapandianetal.[11],inhisresearchselectstheoptimal combination of the factors which will ensure the required yieldstrengthandalsotofindoutthecontributionofeach factor in the improvement of yield strength. The data analyzed by Taguchi Method to find out the optimum combinationfactorsusingMINITABsoftware.
Hmud et al. [12] study the effect of cooling media and temperatureonthemechanicalpropertiesforreinforcement steel. Many tests are done to the samples at different temperaturewerecarriedout.Ghaleh[13]inthisstudy,the effectofcoolingratewasinvestigatedonthemorphologyand depth of martensite layer, quenched area, and tensile propertiesofareinforcementsteelbar.Musondaetal [14] conductsaseriesofexperimentsatasteelplanttoestablish the optimum temperature of the rebar at the cooling bed. Maintaininghighaccuracytemperaturemeasurementsatthe cooling section is essential in order to attain the overall quality of the finished product, and to realize the correct properties.
Apartfromthosevariousothertoolssuchascontrolchart, fishboneanalysis,processcapabilityanalysisetc.canbeused inSixsigmaanditsDMAICanalysis.Thefishboneanalysisisa toolforanalyzingthebusinessprocessanditseffectiveness. The analyst reveal that the problem area is lack of proper equipment,faultyprocesses,misdirectedpeople,improper environment and poor management. Aebtarm et al. [15] suggestthatthetraditionalC charthasbeenwidelyapplied formonitoringcountdataintheindustrialandnonindustrial processes.
DMAIC (an abbreviation for Define, Measure, Analyse, Improve,andControl)isafive phasestrategyforimproving various kinds of organizational processes, whether it is a software development, manufacturing, or some other
process. While it is a core tool used to conduct Six Sigma projects, it can be used alone as the framework for other improvementapplications.varioustoolsandtechniquesused for analysing the project to obtain the result and details These tools include process map, control charts, process capabilityanalysis,Paretoanalysis,Sigmaconversiontable etc.
Customerwantsareidentifiedbyvariousinterviewsand discussions with the manager and staffs at different departments like sales, testing and the production departmentoftheselectedsteelbarmanufacturingindustry. The problem identified in the production was often the mechanicalpropertieslikeyieldstrengthfallbelowtheISI limitwhich ledtorejection orsellingitas low gradesteel thereby causing financial loss. Hence the problem to be worked on is the improvement of the production process andtherebyincreasingthequalityandminimizerejection. Thecritical to quality(CTQ)characteristicsidentifiedforthe productareyieldstrength(YS)andultimatetensilestrength (UTS),massperlength.YSandUTSaremeasuredinNewton per millimeter square (N/mm2) and Mass per length is measured in kilogram per meter (kg/m). TMT bars of differentgradeslikeFe500,Fe550andindifferentdiameters like8mm,10mmand12mmareproducedinthisindustry. OutofthistheTMTmodelselectedforthisstudy isFe500 with8mmdiameter.TheproductspecificationofTMTbaris comparedasperISIspecificationtocheckthequalityofthe product. The ISI standards for Fe500 TMT bar with 8mm diameterisshowninthetablebelow.
Table 1: DesignspecificationforTMTbar
SPECIFICATIONOFTMTBARS(IS 1786:2008)
Mechanicalproperties(Min) Barweight(Kg/Mtr) Model Fe500 Size 8mm YieldStress (N/mm2) 500 Std 0.395
Ultimate Tensile Strength (N/mm2)
545 Min 0.367
Elongation(%) 12 Max 0.423 Ration (UTS/YS 1.09
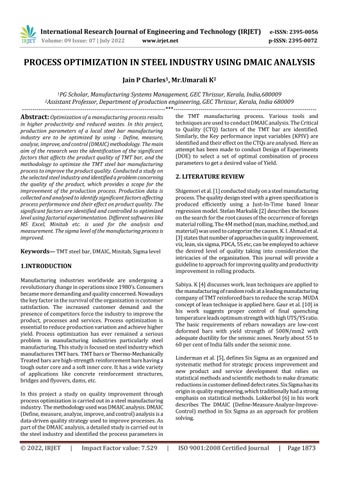
The process flow chart of the industry is created in this phasewhichisgivenbelow.
2022, IRJET | Impact Factor value: 7.529 | ISO 9001:2008 Certified
International Research Journal of Engineering and Technology (IRJET) e ISSN: 2395 0056
Volume: 09 Issue: 07 | July 2022 www.irjet.net p ISSN: 2395 0072
satisfactoryasmeanandLowerControlLimitX barvaluesof allCTQsaregreaterthanLowerSpecificationLimit.
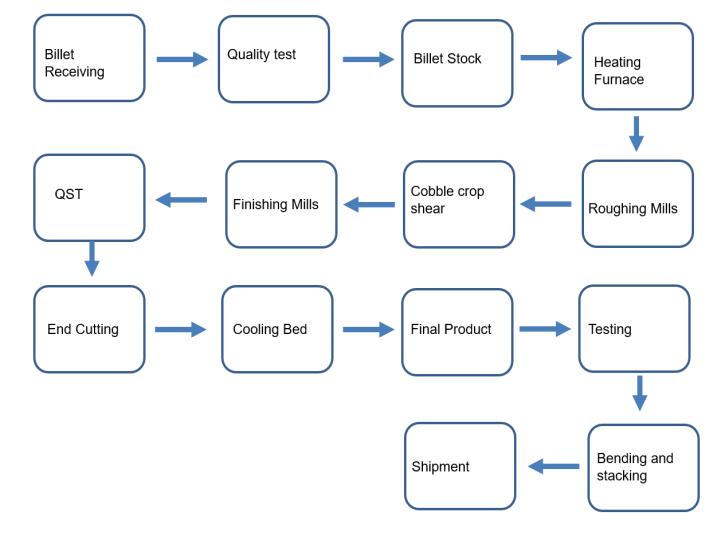
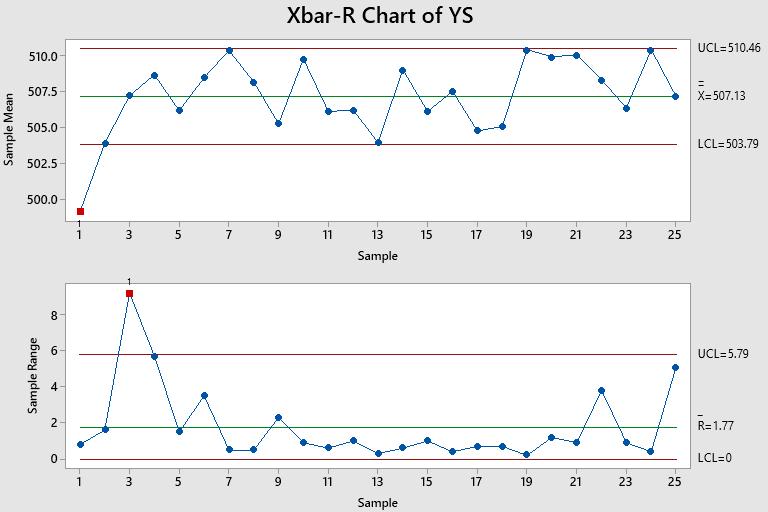
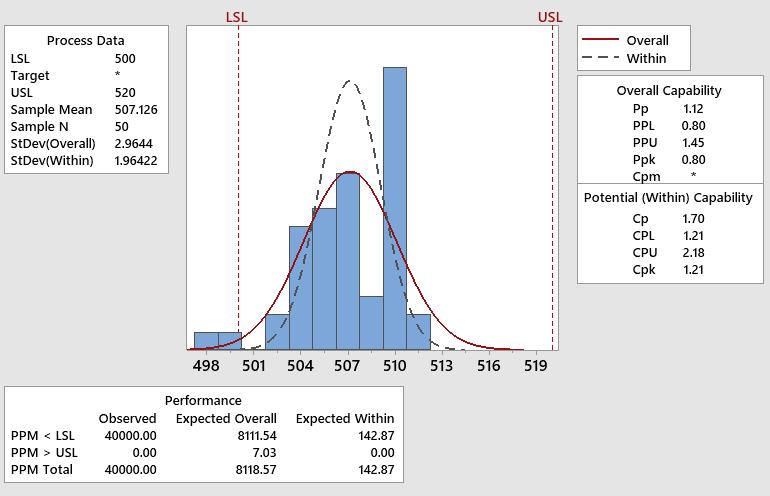
Theprocesscapabilityanalysisisasetofcalculationsusedto assesswhetherasystemisstatisticallyabletomeetasetof specifications or requirements and to evaluate their performance The steel bar manufacturing process performanceismeasuredbycarryingoutprocesscapability study. The Cpk(process capability index), Ppk(process performance index) and defects per million opportunities (DPMO)aredeterminedforeachCTQandfinallythecurrent sigmalevel.Thesampleprocesscapabilityanalysisofyield strengthisshowninthefigurebelow.
Data is collected from the quality department of the manufacturingfirmandCTQcharacteristicsaremeasured. The CTQ characteristics include yield strength, ultimate tensilestrengthandmassperlengthfortheselectedproduct variety. The process performance is measured using the collected data by using various tools like control chart, capabilityanalysisetc.
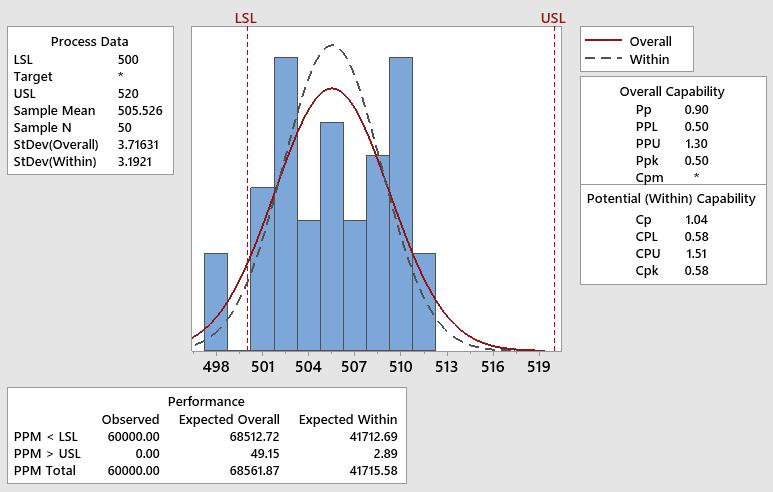
Control charts are plotted in order to know if the process meets the design specifications. Control chart of yield strength for 8mm steel bar is shown in chart 1 as an example. The desirable LSL for it is 500 N/mm2 while the process mean is 505.53 N/mm2. The upper and lower controllimitsfortheprocessare512.20N/mm2and498.85 N/mm2 respectively.Theprocessisincontrol.
AfterconductingtheProcesscapabilityanalysis,themain factors like Cpk, Ppk, Standard deviation, DPMO etc. are observed and noted. The summarized results of measure phasearegiveninthetable2
Table-2: resultofmeasurephase
Similarly, the control charts for the remaining CTQs ie ultimatetensilestrengthandmassperlengtharemadeand their parameters calculated. The process performance is
CTQ Parameters
Yield Strength UltimateTensile Strength Massper length Process capability index(Cpk)
0.54 0.67 0.72 Process performance index(Ppk)
0.49 0.66 0.59 Standard Deviation(σ) 3.71 3.6 0.015
Permillion opportunity (PMO)
1000000 1000000 1000000
International Research Journal of Engineering and Technology (IRJET) e ISSN: 2395 0056
Volume: 09 Issue: 07 | July 2022 www.irjet.net p ISSN: 2395 0072
Defectsper million opportunity (DPMO)
68562 40000 70815
ProcessYield 93.29% Sigmalevel 2.9
The summarized results help in the sigma level calculation which is the baseline quality of the current process and needs to be improved. The sigma level of the processcomesout to be2.9 asshownin Table 2.Theline DPMOformassperlengthis70815,whichisgreaterthan other CTQ’s DPMO. In this project an effort is made to improvethesigmalevelbycontrollingthesignificantfactors foundintheAnalysisphaseoftheDMAICcycle.
Theanalysisphaseidentifiesthestatisticallysignificant factors that contribute towards the rejection. Once the significant factorsareidentified, theycan becontrolled to haveminimumrejectionandmaximumprocessyield.There are various factors or input parameters of the production processthataffectsthepropertiesoftheTMTbarproduced. Someoftheprocessparametersidentifiedfromtheindustry andliteraturereviewislistedbelow;
arTemperature T inC RollingSpeed,Sinmps Coolingwaterpressure,PinbarorMpa QuenchingTime,tinsec Rawmaterialcomposition WaterFlowRate,Qinm3/hr. Quenching aterTemperature TwinC
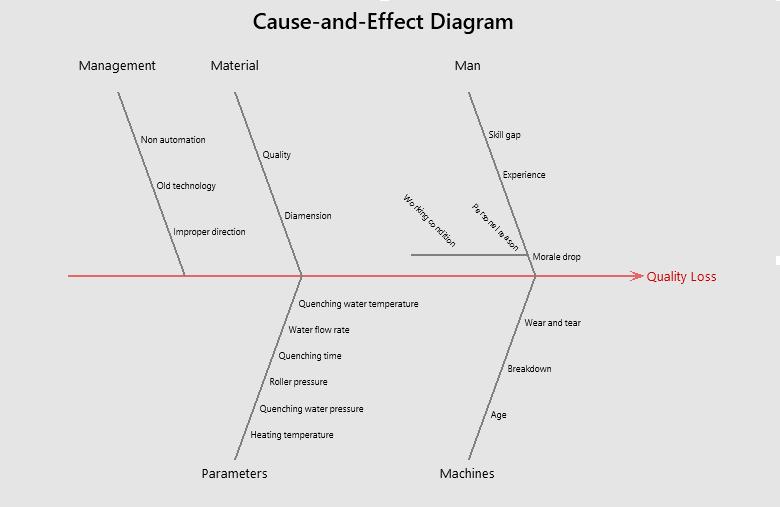
AFishboneanalysisisconductedusingthecollecteddata fromtheindustryandvariousothersources.TheFishbone diagramalsocalledcauseandeffectdiagramisshowninthe figurebelow.Thefactorscontributingtothequalitylossare depictedinthisdiagram.
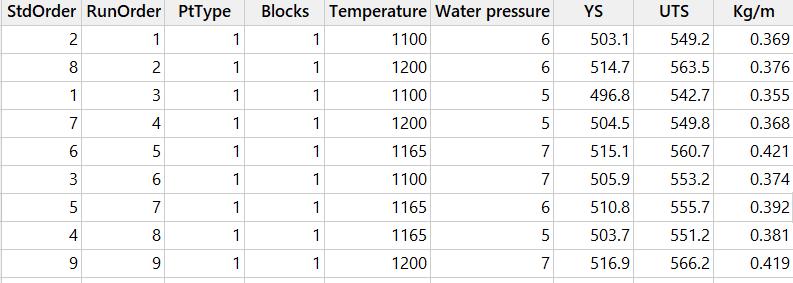
InTMTmanufacturingprocess,initiallyoneortwoTMTbars areproducedandtestedtocheckwhethertheyhavedesired propertiesanddesignspecification.Ifthedesiredproperties are not met, then the foreman will adjust the process parameterslikewaterpressure,bartemperatureetc.They willconductsomeexperimentalrunsatthebeginningand oncethedesiredspecificationsareobtainedfortheTMTbar, then the production will run on full capacity in that condition.Inordertostudytheeffectoftheseparametersa factorialexperimentationiscarriedout.Theselectedfactors andtheirlevelsareshowninthetablebelow
Table-3: Inputfactorsandlevels
Level Heating Temperature(oC) Waterpressure (bar) Low 1100 5 Medium 1165 6 High 1200 7
A factorial design experimentation is conducted using MINITABsoftware.Thedetailsareshowninthefigurebelow
Fig-4: Designexperiments
International Research Journal of Engineering and Technology (IRJET) e ISSN: 2395 0056
Volume: 09 Issue: 07 | July 2022 www.irjet.net p ISSN: 2395 0072
Basedonthedatafromdesignexperimentsandconsidering otherfactorsasampleparetoanalysisisdoneandthegraph isshownbelow
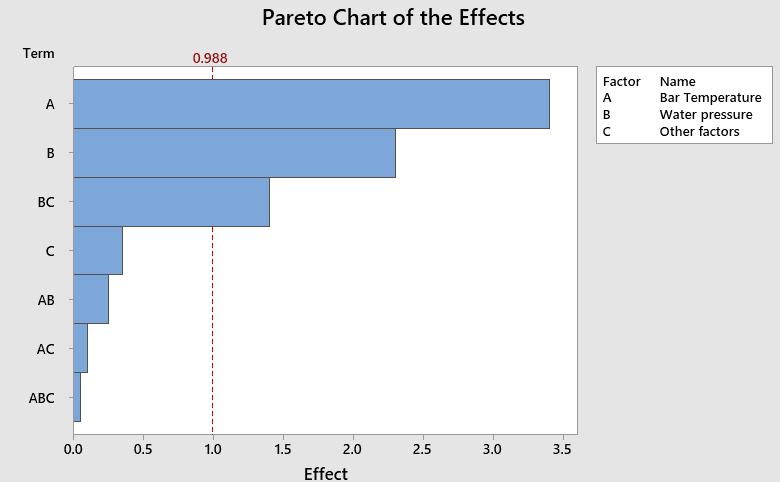
Themainfactorswhichcontributemoreonthedesired properties are water pressure and bar temperature. The otherfactorsarenotadjustedorconsideredlessduringthe production process. In the chart it shows that bar temperature and water pressure are critical factors that affecttheprocesssincetheyareabovethecriticalredline. Thecombineeffectoffactorsisalsoshowninthegraph.
The improvement phase suggest improvement or implementsthefindingsofAnalysisphaseintothesteelbar manufacturingfacilityandobservetheimprovedresults.
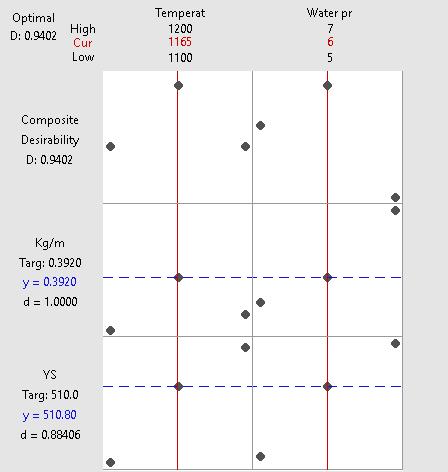
Theresponseoptimizerisusedtoidentifythecombination ofpredictorvaluesthatjointlyoptimizeoneormorefitted response.That is,itcanbe usedtofindanoptimuminput parametervaluebasedonthefactorialdesignanalysis.Only response variableswith up to datemodelsfrom thesame typeofanalysisareavailableinthelist.Theresultobtained fromtheresponseoptimizerisgivenbelow.
The desired value of yield strength(510N/mm2) and massperlength(0.392Kg/Mtr)asperindustrialstandards aregivenasinputvaluesintheresponseoptimizerandthe obtainedinputparametervaluesaretemperature 1165C andwaterpressure(6bar).Theindustryissuggestedtorun onthisconditiontogetimprovedresults.
Thecontrolchartcanbetooltomonitortheprocessover time.Asamplecontrolchartofyieldstressoftheprocess operatingneartheimprovedconditionsaregivenbelow.
FromthecontrolchartwecanseethattheUCLandLCL areimprovedand shifted more toward mean. The control chartsofYSandUTShaveimprovedbutthecontrolchartof mass per length only varied little. The process mean and
International Research Journal of Engineering and Technology (IRJET) e ISSN: 2395 0056
Volume: 09 Issue: 07 | July 2022 www.irjet.net p ISSN: 2395 0072
lowercontrollimitaregreaterthantheLSLoftheproduct. Hencetheprocessisundercontrol.Similarlycontrolcharts for yield stress and mass per length are also plotted. The meanvaluebecamehigherandneartodesiredlevel.
Theprocesscapabilityanalysisofsampledatawhenworking near our suggested range is conducted. The results of processcapabilityofyieldstressareshownasanexample.
The results are communicated to the team and the production department is directed to run the production processunderthesuggestedfactorssettings.Inthecontrol phasetheproductioncontrolteammonitorstheprocessto makesureitoperatescorrectly.
Aone sampleZ Testisperformedontheimproveddata tocheckwhetherifthemeanoftheprocessisgreaterthan the given product LSL. The test is performed with a 95% confidencelevelandtheresultsaresummarizedintable5 givenbelow.
Table 5:One sampleZ testresults
CTQ parameter Standard deviation Alternate hypothesis P value Results (alternate hypothesis testing)
Yield strength 2.96 μ>500 0 Accept Ultimate tensile strength
3.4 μ>545 0 Accept Massper length 0.013 μ>0.367 0 Accept
AfterconductingtheProcesscapabilityanalysis,themain factors like Cpk, Ppk, Standard deviation, DPMO etc. are observed and noted. Similarly, the process capability of ultimatetensilestrengthandmassperlengtharecalculated. Thesummarizedresultsofimprovementphasearegivenin thetablebelow.
CTQParameters
Yield Strength Ultimate Tensile Strength
Massper length
The one sample z test for μ>LSL is performed. The p value less than α 0.05 indicate the rejection of Null Hypothesis Ho=μ≤LSL and hence the Null Hypothesis is rejected and Alternate Hypothesis Ha=μ>LSL is accepted. HenceitisconcludedthatthemeanvalueoftheCTQ’sare greaterthanLSLasdesired.
Table 6: Measuringvs.improvementphaseresults
Process capability index(Cpk)
1.21 1.36 0.88 Process performance index(Ppk)
0.8 0.95 0.7 Standard Deviation(σ) 2.96 3.4 0.013
CTQ Parameters Measurementphase Improvementphase YS UTS Mass per length
YS UTS Mass per length Process capability index(Cpk)
Permillion opportunity (PMO)
40000 40000 34619
1000000 1000000 1000000 Defectsper million opportunity (DPMO)
ProcessYield 96.1% SigmaLevel 3.2
0.54 0.67 0.72 1.21 1.36 0.88 Process performance index (Ppk)
0.49 0.66 0.59 0.8 0.95 0.7 Standard Deviation(σ) 3.71 3.6 0.015 2.96 3.4 0.013
Defectsper million opportunity (DPMO)
68562 40000 70815 40000 40000 34619 Process Yield 93.29% 96.1% Sigma Level 2.9 3.2
International Research Journal of Engineering and Technology (IRJET) e ISSN: 2395 0056
Volume: 09 Issue: 07 | July 2022 www.irjet.net p ISSN: 2395 0072
AfterconductingDMAICanalysisthesummarizedresultsof measurement phase and improve phase is compared and tabulated. The table containing comparison of the summarizedresultsareshownabove.
AlltheCTQcharacteristics,CpkandPpkareimproved,and DPMOandstandarddeviationareminimizedasthesteelbar manufacturing is conducted on the suggested levels of identifiedprocesscontrolparameters.Fromthetableitcan beobservedthatthevariousmeasuringindicesoftheTMT manufacturingprocesshaveimprovedslightly.Thisshows theeffectofchangesincontrolparameters.Theperformance indices like Cpk and Ppk are improved, and DPMO and standard deviation are reduced. The process yield was improvedapproximatelyfrom93.29%to96.1%.Thesigma leveloftheprocessisalsoimprovedslightlyfrom2.9to3.2.
The DMAIC analysis conducted on a steel manufacturing industry.Detailedprocessstudyisconductedontheselected TMTbarmanufacturingprocessandprocessmapiscreated. The critical to quality (CTQs) factors are defined and key inputparametersareidentifiedthatsignificantlyaffectthe productquality.Thedatafromtheproductionandquality departmentiscollectedandanalysedusingvarioustoolsin the MINITAB software. The process performance is measured in terms of Cpk, Ppk, Process yield, DPMO and Sigma Level. The process yield calculated is 93.29% and sigmalevelwas2.9fortheprocess.Toimprovetheprocess performance,aprocessanalysisiscarriedoutandafactorial designexperimentisperformed.Thefactorsselectedinclude heatingtemperatureandwaterpressurewhicharethemain adjustableparameterthatcanbeemployed.Theproduction datawascollectedwhenthelinewasoperatedatdifferent input factors and the effect was noted. The statistically significantfactorsalongwiththeoptimumlevelsettingsare found after the factorial experimentation. The optimum processparametersareidentifiedusingresponseoptimizer andsuggestionisgiventotheindustry.Improveddatawas collected from the industry and improved results are presented. The process yield is improved to 96.1% of the totalproductionandthesigmalevelisimprovedto3.2. In futureresearchmoresamplesize,morefactorsandlevels canbeconsidered.
[1] SHIGEMORI H, KANO M, HASEBE Shinji (2011), Optimum quality design system for steel products throughlocallyweighted regressionmodel,Journal of ProcessControl,21(2),pp293 301
[2] Stefan Markulik, Anna Nagyova, Renata Turisova and Tomas Villinsky (2021), Improving quality in the process of hot rolling of steel sheets, Appl. Sci. 2021, Vol.11,Issue12
[3] K.I.Ahmad,Dr.R.L.Shrivastav,SohailPervez,NafeesP. Khan (2014), Analysing quality and productivity improvementinsteelrollingindustryincentralIndia, IOSR Journal of Mechanical and Civil Engineering, e ISSN:2278 1684,pp06 11
[4] Sabiya.K,M.Shilpa,S.Appaiah(2019),ScrapReduction inTMTReinforcedBarProductionbytheApplicationof Lean Techniques, International Journal of Recent TechnologyandEngineering(IJRTE),Volume 8,Issue 2
[5] Linderman, K., Schroeder, R.G., Zaheer, S., Choo, A.S, (2003),SixSigma:agoaltheoreticperspective,Journalof OperationsManagement21,193 203
[6] JeroendeMastn,JoranLokkerbol(2012),Ananalysisof the Six Sigma DMAIC method from the perspective of problem solving, International Journal of Production Economics,Volume139,Issue2,pp604 614
[7] VikashGupta,RahulJain,M.L.Meena,G.S.Dangayach (2018), Six sigma application in tire manufacturing company:acasestudy,JournalofIndustrialEngineering International,Volume14,No3
[8] SandeepBJadhav,GaneshPJadhav,Prof.S.N.Teli(2014), SteelIndustriesandSixSigma,InternationalJournalof Scientific&EngineeringResearch,Volume5,Issue12
[9] NAEEM Khawar, ULLAH Misbah, TARIQ Adnan, MAQSOOD Shahid, AKHTAR Rehman, NAWAZ Rashid, andHUSSAINIftikhar(2016),OptimizationofSteelBar ManufacturingProcessUsingSixSigma,Chinesejournal ofmechanicalengineering,Vol.29,No.2
[10] Gaur,A.,Dutta,J.,Barkar,M.,andLakshminarasimhan,B (2018),DevelopmentofFe500sEarthquakeresistance TMT Rebar, International Journal of Advance EngineeringandResearchDevelopment,Vol.5,No.1,pp. 938 947.
[11] B.VijayaPrakash,S.Sundarapandian(2019),Selection ofEffectiveControlfactorsforTMTBarsusingTaguchi, International Journal of Engineering and Advanced Technology,Volume 8,Issue 63
[12] Ali A. Hmud, Hamid M. Mahan, Abdaljabar S. Jomah (2018), Effect of Cooling Media and Tempering Temperature on the Mechanical Properties of Reinforcement Steel, International Journal of Applied EngineeringResearch,Vol13,pp.3979 3987
[13] MiladHeidariGhaleh(2011),Effect of cooling rateon quenched & tempered steel rebar properties, International Conference on Martensitic Transformations2011
International Research Journal of Engineering and Technology (IRJET) e ISSN: 2395 0056
[14] VMusonda(2017),OptimumTemperatureofHotRolled Reinforced Bars at the Cooling Bed, IOP Conference Series:MaterialsScienceandEngineering225,
[15] Surath Aebtarm, Nizar Bouguila(2011), An empirical evaluation of attribute control charts for monitoring defects,ExpertSystemswithApplications,Volume38, Issue6,JPages7869 7880.
Volume: 09 Issue: 07 | July 2022 www.irjet.net p ISSN: 2395 0072 © 2022, IRJET | Impact Factor value: 7.529 | ISO 9001:2008 Certified Journal