International Research Journal of Engineering and Technology (IRJET) e-ISSN: 2395-0056

Volume: 09 Issue: 07 | July 2022 www.irjet.net p-ISSN: 2395-0072

International Research Journal of Engineering and Technology (IRJET) e-ISSN: 2395-0056
Volume: 09 Issue: 07 | July 2022 www.irjet.net p-ISSN: 2395-0072
1MTech Student, Department of Civil Engineering, Pimpri Chinchwad College of Engineering Pune, Savitribai Phule Pune University, (INDIA).
2Assistant Professor, Department of Civil Engineering, Pimpri Chinchwad College of Engineering, Pune. Savitribai Phule Pune University, (INDIA). ***
Abstract - The design of energy efficient buildings is becoming a need to reduce environment impact. Hence it has become necessary to design or plan the buildings in different forms with different parameters to make it energy efficient. This research report presents quantitative study of energy performance effect due to building morphology in five different climatic zones. Using four building parameters (i.e., relative compactness, orientation; window percentage; sun shading) an optimal building morphology has been suggested for specific Indian climatic zones i.e., Hot and Dry, Warm and Humid, Composite, Cold and Temperate.
The software to be used for energy Analysis for buildings is AUTODESKINSIGHT360 software.
Key Words: ENERGY EFFICIENT BUILDING, ORIENTATION, OVERHANG SHADE, CLIMATIC ZONES, BUILDING MORPHOLOGY, HEATING AND COOLING LOADS, REVIT, INSIGHT 360
Thebuildingsectormakesasignificantcontributiontototal energyconsumption.Thisisoneofthereasonswhyenergy efficiency measures in buildings are increasingly being demanded. Worldwide, the issue of energy efficiency has gained relevance in the last decade with the objective of reducing energy consumption that would impact the buildingperformanceaccordingtotheInternationalEnergy Agency(IEA).Thegrowthofnewtechnologiesbroughtmany changesinbuildingdesignandenergyanalysisprocess.Itis now more crucial than ever to choose from a variety of solutionstoincreasecomfort,cutcarbondioxideemissions, andmaximizebuildingprofitability.Theincreasingdemand for more energy efficient buildings led scientists in the worldtoengageinbuildingenergymodelingtoimplement the strategies that would affect an overall reduction in buildingenergyconsumption.Buildingenergymodelingisa process of creating an architectural and energy model throughcomputersoftwaretopredictenergyconsumption and improving building energy performance during occupancy.Comparingthepredictedenergyconsumptionto theactualenergyconsumptioncanhelpbuildingownersand
operators to detect and diagnose low efficiency or malfunctioningequipment.
Fig.11.EnergyConsumptionbyMajorSectors
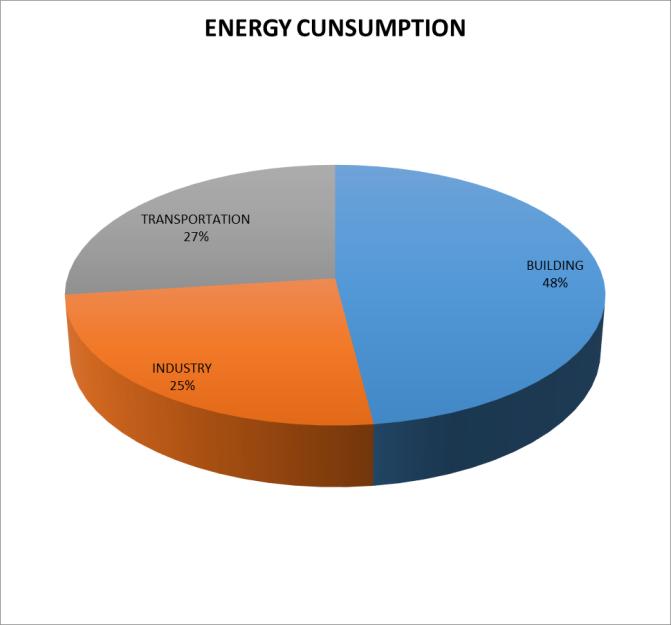
Above figure 1. shows energy consumption by different sectorsvizIndustries,Buildings,Transportation.Fromthe figure we come to know that buildings consume 48% of energyi.e.,itconsumesthemaximumfromallthreesectors.
Energy use Scenario in India:
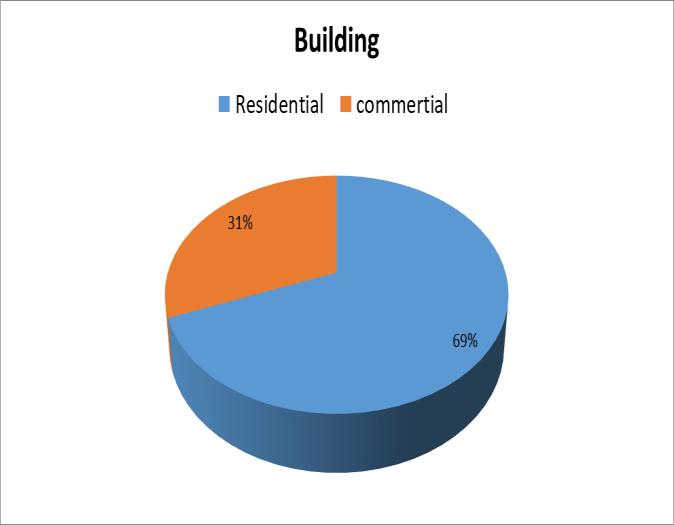
Energyisaprerequisiteforeconomicgrowthinpractically all of India's key industries, including agriculture, manufacturing,transportation,business,andresidential.In India, buildings use 29% of the country's total energy, of which20%areresidentialand9%arecommercial.
© 2022, IRJET | Impact Factor value: 7.529 | ISO 9001:2008 Certified Journal | Page1634
International Research Journal of Engineering and Technology (IRJET) e ISSN: 2395 0056
Volume: 09 Issue: 07 | July 2022 www.irjet.net p ISSN: 2395 0072
1.3.
Theengineeralsochargesforenergyefficientbuilding whichismuchhighertopayforaclient.
ToAnalyzeEnergyEfficiencyofBuildingforIndianClimatic ZonesusingSimulationSoftware.
1.4.
1. Toidentifymostinfluencingarchitecturalparameters.
2. Todevelopacomplex3Dmodelasperparameterssetof buildinginRevit
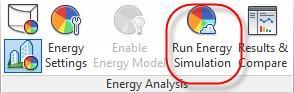
3. TorunanenergyanalyticalmodelinInsight360andto getenergyconsumptionresults.
Fig.1.2EnergyUseScenarioinIndia
R.Pacheco, et al. (2012) this paper discusses about variousfactorsorparametersinvolvedinaffectingthe internaltemperatureofthebuildingandthetotalenergy demandofthebuildingtoachievethermalcomfort.
Werner Pessenlehner et al. (2003) simple numeric indicatorsareusedbycertainenergyrelatedbuilding standards to describe geometric compactness of the building.
Soojung Kim et al. (2016) windowsplayamajorrole in improving energy efficiency of buildings. in this article65differentdesignscenariosarecreatedwhich arevarybywindowsize,positionandorientation.
Saboor Shaik et al. (2016) this paper presents the thermalperformanceofvarioussingleglazingwindow glasses covered with and without window overhang shading.
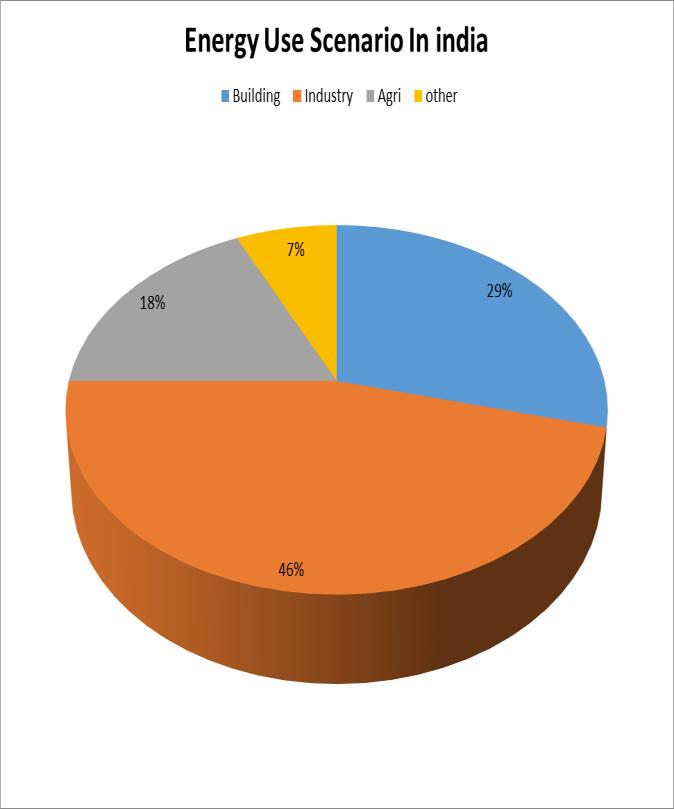
Fig.1.3.ResidentialVS.CommercialBuildingEnergy Consumption
Ahmed S. Muhaisen et al. (2016) thispaperexamines the effect of building proportions and orientations on thethermalperformanceofhousingunits.
Heating, ventilation and air conditioning (HVAC) accounts for approximately 40% of building energy consumption, Soo it is important to overcome these drawbacksandtodeliverenergyefficientbuildingwith minimalcoststotheclient.
Thereisnotmuchawarenessinconstructionindustry regardinghowenergyconsumptionofabuildingcanbe reduced and other factors like lack of industrial knowledge,lackofskilledpeople.
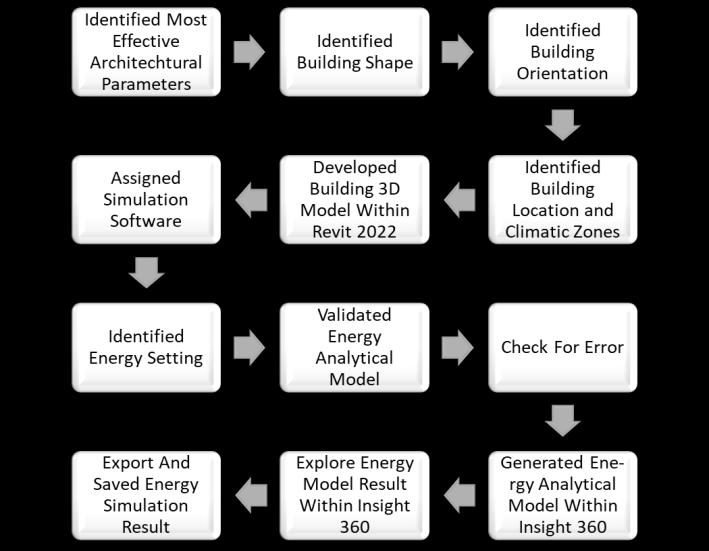
Theresearchdesignforthepresentstudyinvolvesthe followingsteps:
i) A sample of different building shapes is selected, providingmorphologicalvariance;
ii) Differentglazingscenariosaregenerated through varianceinglazing area iii) Orientation;
International Research Journal of Engineering and Technology (IRJET) e ISSN: 2395 0056
Volume: 09 Issue: 07 | July 2022 www.irjet.net p ISSN: 2395 0072
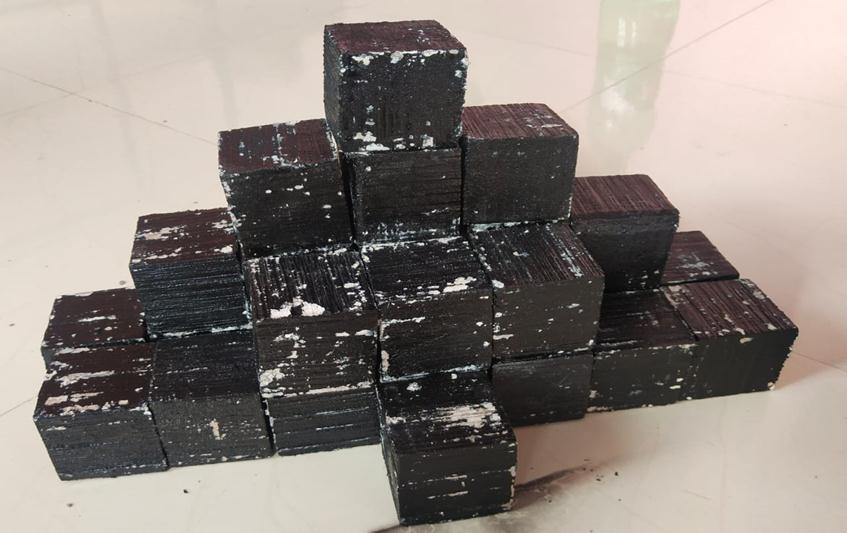
1. Relative Compactness (0.6)

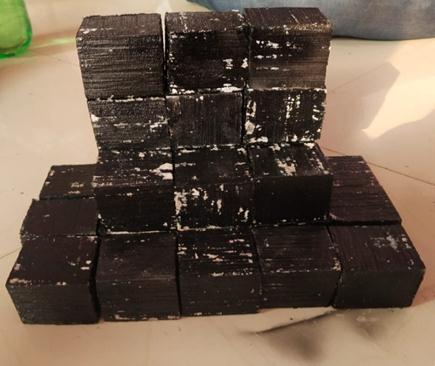
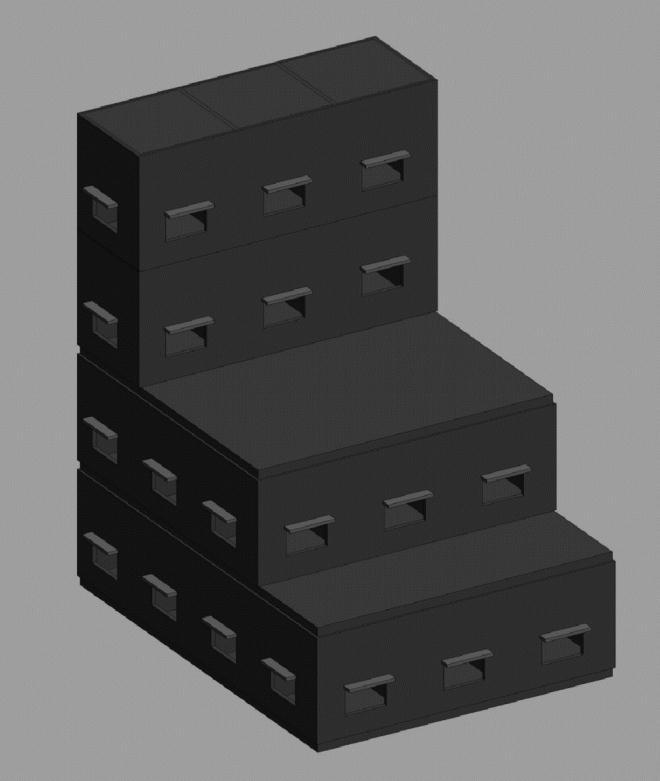
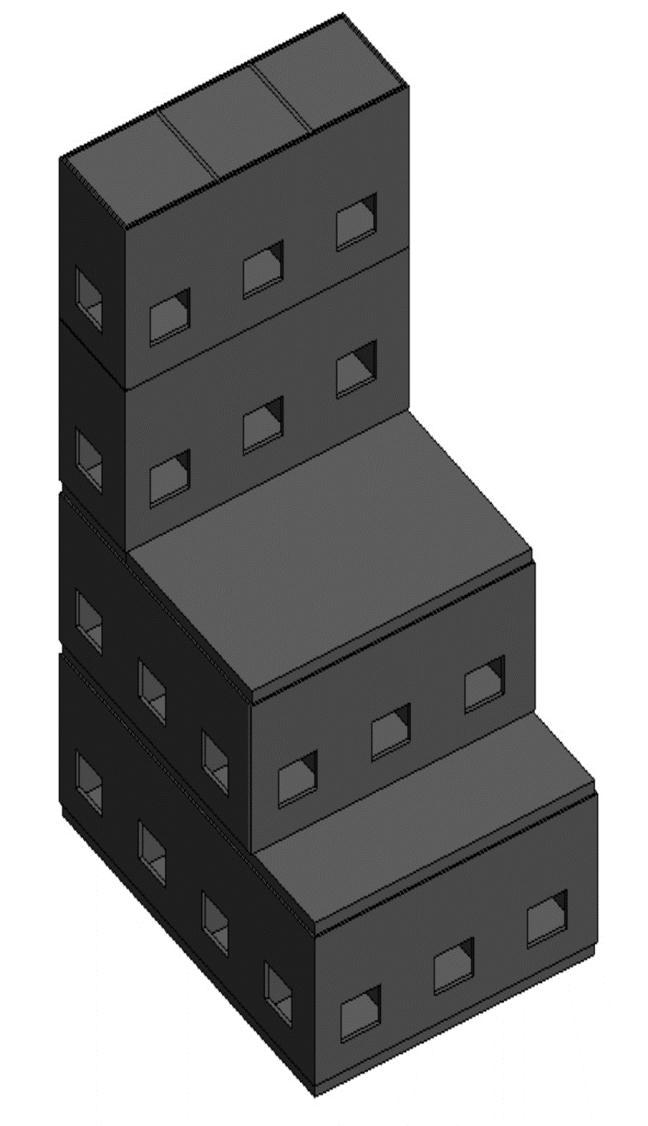
A modular geometry system was derived based on an elementary cube(5x5x5m): To generate different building shapes, such elements were used. These elements were aggregated in different ways to create 70 morphological variationsamongwhichninewereselectedonthebasisof geometric index and relative compactness. The "relative compactness" (RC) indicator was employed to define compactness.TheRCofashapeisderivedinthatitsvolume tosurface ration iscomparedto thatof themostcompact shapewithsamevolume.

According to relative compactness of each building shape theyweredividedintoninegroups0.6,0.65,0.7,0.75,0.8, 0.85,0.9,0.95,1.Theshapesofbuildingswhichwerehaving commonrelativecompactnesswereclubbedintoonegroup among nine above. Then one shape from each group was selected and then analyzed through software (Autodesk Insight 360)Analysis.
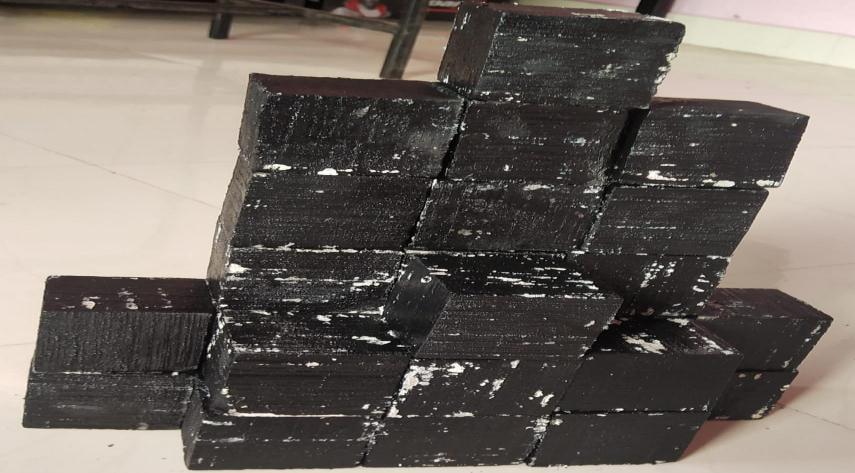
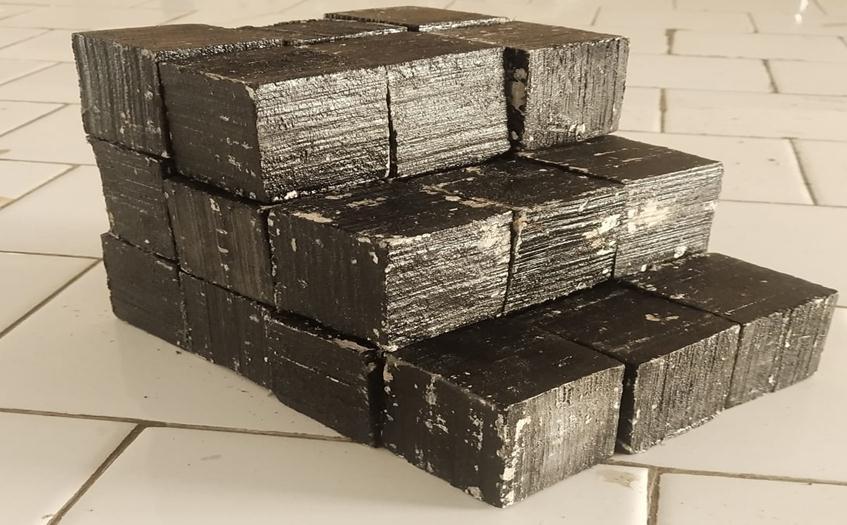
Following are the examples of different building shapes grouped according to relative compactness among the 70 woodenmodels.
Fig.3.2.1.BuildingShape1,RelativeIndex0.6
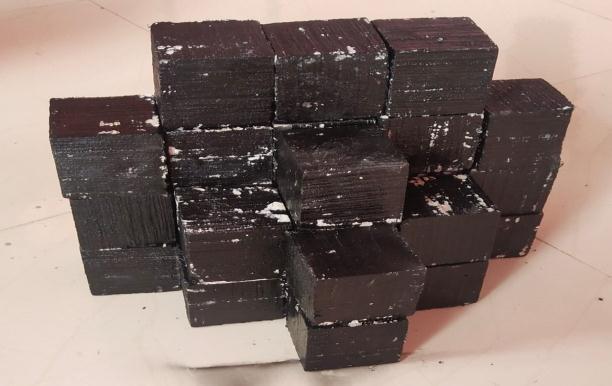
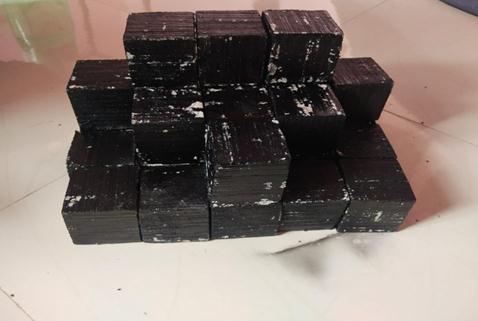
2. Relative Compactness (0.65)
Fig.3.2.2.BuildingShape2,RelativeIndex.65
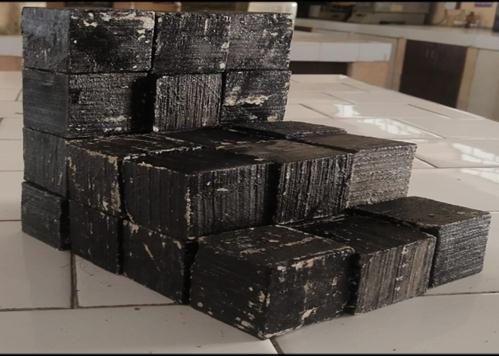
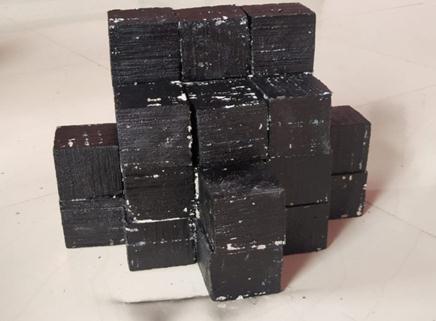
3. Relative Compactness (0.7)
Fig.3.2.3.BuildingShape3,RelativeIndex0.7

Insight 360 is an energy analysis and thermal load simulation program. based on a user's description of a buildingfromtheviewpointofthephysicalcompositionof the building and related mechanical and other systems. It calculatesheatingandcoolingloadsnecessarytomaintain thermalcontrolsetpoints,conditionsthroughoutsecondary HVACsystemandcoilloads,andtheenergyconsumptionof primaryplantequipment.Simultaneousintegrationofthese and many other details verify that the Insight 360 simulationperformsaswouldtherealbuilding.
Insight360isawholebuildingenergysimulationprogram that engineers, architects, and researchers use to model energy and water use in buildings. Modeling of a building with Insight 360 enables building professionals to the performanceoptimizethebuildingdesigntouselessenergy andwater.EachversionofInsight360istestedextensively beforerelease.
Insight 360 models heating, cooling, lighting, ventilation, other energy flows, and water use. Insight 360 includes manyinnovativesimulationcapabilities:timestepslessthan ahalfhour,modularsystemsandplantintegratedwithheat balance basedzonesimulation,multizoneairflow,thermal comfort, water use, natural ventilation and photovoltaic system.
Key capabilities of Insight 360 Discoverafast,IntuitiveOutcomeDrivenGuidetoBetter Building Energy &Environment Performance throughouttheBuildingLifecycle Visualize critical performance metrics, benchmarks, factors,ranges,andspecsandinteractwiththemtoget real time cause and effect feedback that can help you achievebetterresults.
Create strong autonomous analytical models using Formlt Pro and Revit to create insights, and see performancedatarightinthemodellingenvironment.
Utilizing cutting edge parallel cloud computing techniques,trustedindustry leadingsimulationengines forwholebuildingenergy,heating,cooling,daylighting, and solar radiation simulation operate to simultaneouslyrepresentmillionsofpossibleoutcomes.
International Research Journal of Engineering and Technology (IRJET) e ISSN: 2395 0056
Volume: 09 Issue: 07 | July 2022 www.irjet.net p ISSN: 2395 0072
Organizeandshareinsightwithotherstakeholdersand access anywhere to work towards better outcomes continuouslyandconsistentlyfromearlytargetingand feasibilityallthewaythroughtooperation.
AdvancedmodellingtoolsareofferedbyAutodeskInsight 360inauser friendlyinterface.Thismakesitpossiblefor the entire design team to create cost and energy efficient designsfromconceptiontocompletionusingthesametools. It is a well liked tool used by architects, has a straightforward modelling process, makes it simple to quickly change a model's attributes, and takes a decent amountoftimetoanalyzeamodel.
Forthepurposeofthepresentanalysis,severalassumptions aremade:
a) All the buildings have equivalent material usage, thermal properties and elements;
b) All the buildings are oriented 90° and 180° with the north.
Auto desk Insight 360 calculates the heating and cooling loadsbasedontheadmittanceprocedure,whichassumethat thefluctuationsbetweentheexternalandinternalloadscan bepresentedbythesumofthesteady statecomponent.This method is insensitive to the rapid change in neither temperaturenorlong termheatstorage.
However,thismethodhasnorestrictionsonthenumberof thermalzonesorbuildinggeometry.Theanalysisbasedon thelocal(outsideandinside)meanandthefluctuationsin the temperature around this mean, when outside temperature or solar load change the internal air temperaturefluctuateinasimilarway.
AnalysisisgoingtodoneonfiveclimateZonesofIndia
1) Zone I Hot and Dry : ( Jaisalmer)
2) Zone 2 Warm and Humid: (Chennai)
3) Zone 3 Composite: - (Lucknow)
4) Zone 4 Cold: - (Srinagar)
5) Zone 5 Temperate: (Bangalore)
TheAutodeskInsight360procedurestartswithcreatinga three dimensionalshellthatrepresentsthebuildingform. Thiscanbedoneinoneoftwoways:
1) Building geometry can be imported from 2D CAD floor plandataandthentracedoverwithinAutodeskInsight
360tocreateblocksandtopartitionblockupintozones.
2) 3D CAD models can be imported from Revit, Micro station,ArchiCADandSketchupusinggbXML.
Forthisanalysis,wecanpreparethebuilding'sgeometryin Rivet, and then imported the 3D model as surfaces and rooms to Autodesk Insight 360. The analysis then moves forward with the building's envelope being given its allocated thermal properties. a component's constituent substance(concretewall,slab,glazingwall,etc.).
Theanalysisbasedonthelocal(outsideandinside)mean andthefluctuationsinthetemperaturearoundthismean, whenoutsidetemperatureorsolarloadchangetheinternal airtemperaturefluctuateinasimilarway.
The method used in this study is derived with some considerations and assumptions. The thermal analysis involvesexaminingeachofthe9modelsineachofthefive Zone 1. Hot and Dry Zone 2. Hot and Humid Zone 3. CompositeZone4.ColdZone5.Moderate.
The 9 models analysis required 540 different simulation runs,eachofwhichrequiresapproximatelyhalfanhourto complete.Foreachclimatezone,weatherdata(TMYfiles) foreachcityisloadedandthe9modelsweretestedunder equalthermalconditions.Thatis,theonlydifferencesamong therunsinthesameclimatezonearethegeometricratio. Weather data files are imported through AUTODESK INSIGHT360.
2022, IRJET | Impact Factor value: 7.529 | ISO 9001:2008 Certified Journal
International Research Journal of Engineering and Technology (IRJET) e ISSN: 2395 0056
Volume: 09 Issue: 07 | July 2022 www.irjet.net p ISSN: 2395 0072
SelectArchitecturaltemplate→SetoutProjectUnit asEnergyandthencreatetheshape.
SpecifyingtheOpenings.
SpecifyingtheLocation.
SpecifyingtheTypeofBuilding.
Generatingananalyticalmodel
SpecifyingtheOrientation.
Aftergeneratingenergymodel,thebuildingwilllooklike asbelow.
Definingthermalpropertiesofmaterials.
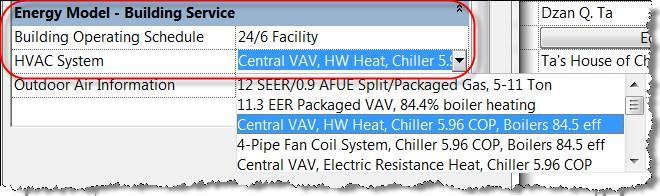
DefiningSpecifyingtheHVACsystem.
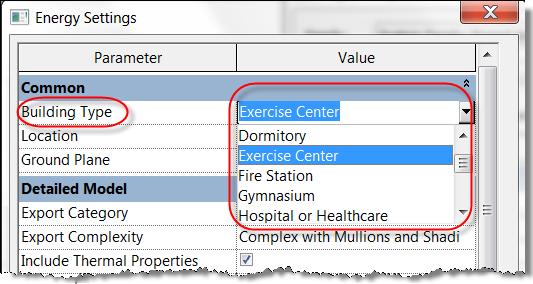
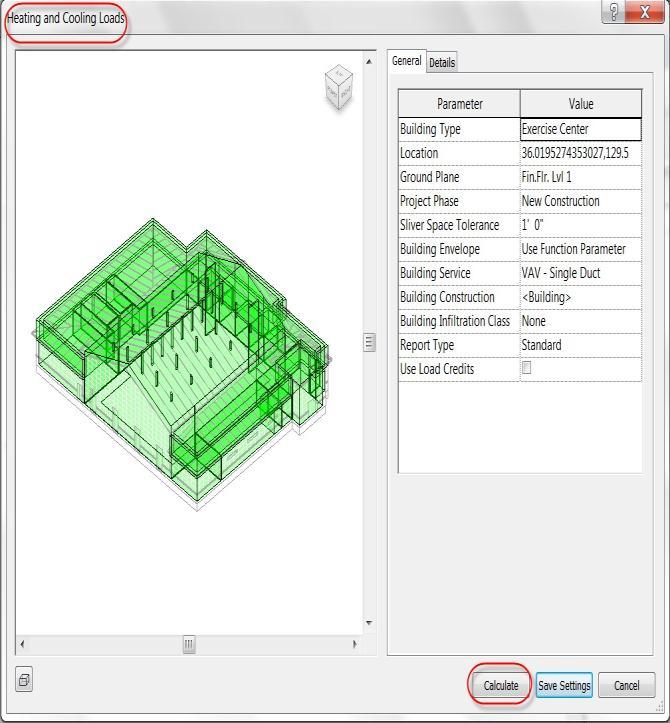
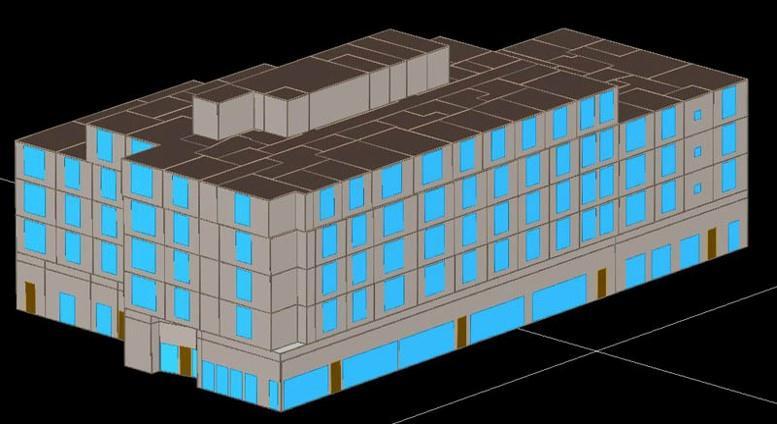
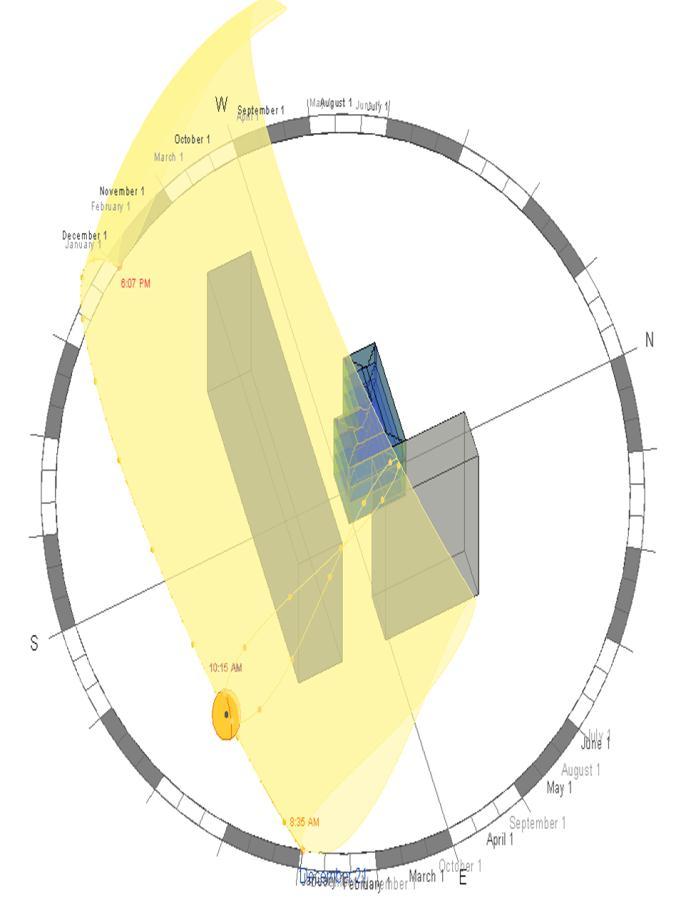
Fig.3.7.1Virtual3DRevitBuildingEnergyModel
Thermalpropertiesofmaterials.
Specifyingdifferentspacetypesinourbuilding
Generatingourdefinedbuildingindetail.
Fig.3.7.2.RevitHeatingandCoolingLoadSimulation
International Research Journal of Engineering and Technology (IRJET) e ISSN: 2395 0056
Volume: 09 Issue: 07 | July 2022 www.irjet.net p ISSN: 2395 0072
A role of Insight 360 is to operate simulations of constructionperformancetooptimizepowereffectiveness aswellastoworktowardscarbonneutralitypreviouslyin thedesignphase.
This idea helps to extend ability before designing high performancebuildings.ByusingAutodeskRevit2022,the evaluationofpowerusagecanconductpowersimulationfor conceptualformsandcomprehensivearchitecturaldesigns producedinthesoftware.Theoutputofheating&cooling loadandenergyconsumptionarepresentedinthispart.
Thecontrolofheatingandcoolingloadsisverysignificant forfacilitybecauseitisassociatedwithfuelandelectricity consumption. It is well known that by accumulative the thermalmassofabuildingfacility,moreheatisstoredinthe facility structure and the daily maximum temperature is decreased.
Thethermalloadsareoverdueforsomehoursandthisisthe way of controlling the temperature of the facility simultaneously.Therefore,heatingandcoolinganalysisfor the facility is performed using BIM for designing a better sustainable facility such that, it gets heated and cooled naturally.
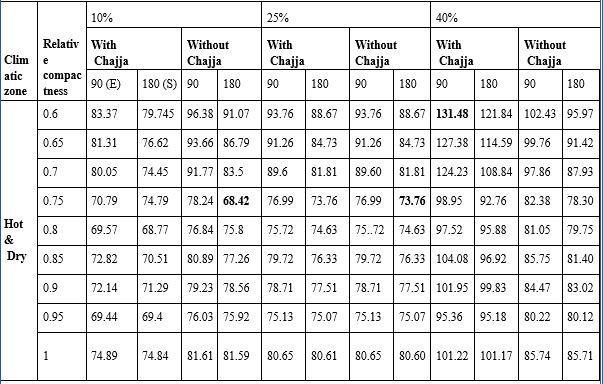
Table No. 4.1. Heating & Cooling Loads (In MW.Hr) Hot & Dry Region (Jaisalmer)
International Research Journal of Engineering and Technology (IRJET) e ISSN: 2395 0056
Volume: 09 Issue: 07 | July 2022 www.irjet.net p ISSN: 2395 0072
Table No. 4.2. Heating & Cooling Loads (In MW.Hr) Warm & Humid Region (Chennai)
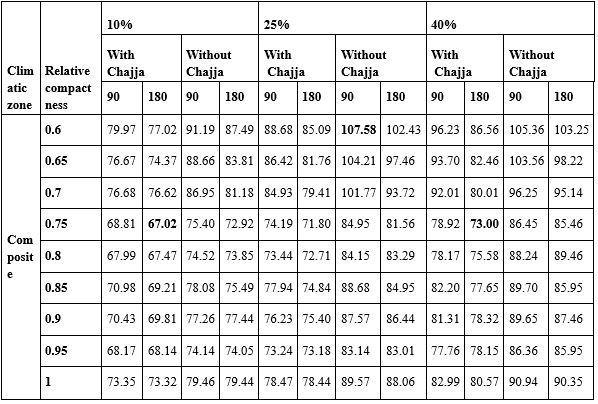
Table No. 4.4. Heating & Cooling Loads (In MW.Hr) Cold Region (Srinagar)
Table No. 4.3. Heating & Cooling Loads (In MW.Hr) Composite Region (Lucknow)
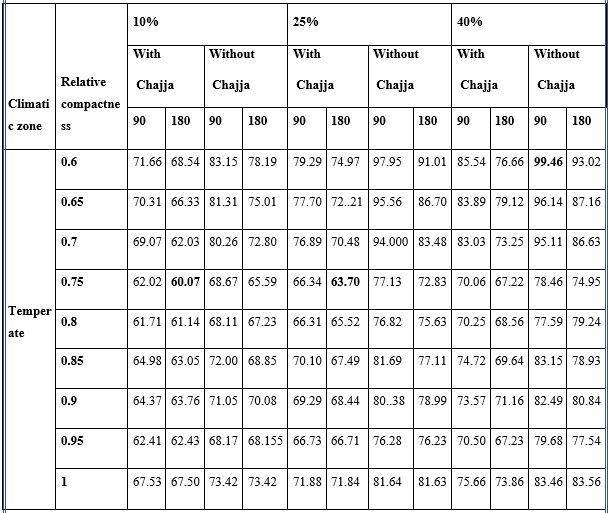
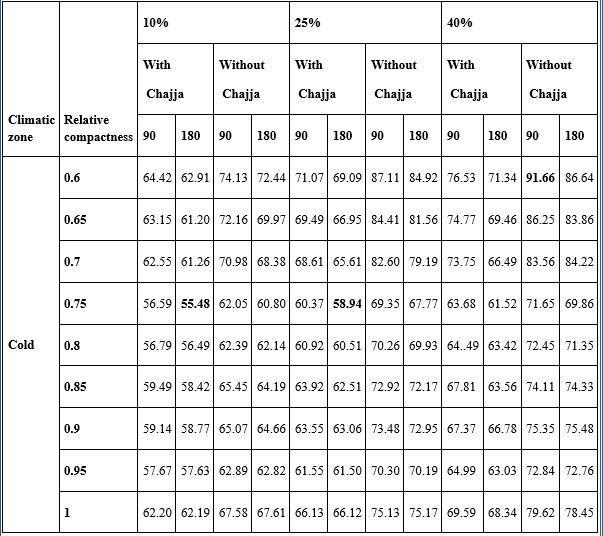
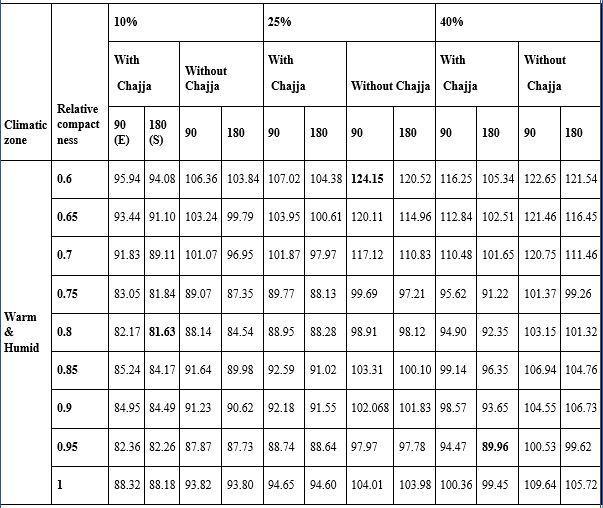
Table No. 5 Heating & Cooling Loads (In MW.Hr) Temperate Region (Bangalore)
Building energy requirements are the reason for a high percentage of energy use. In this article, Building Information Modeling (BIM) technology was used to accentuate the importance of this technology in such substantialsubjects.itwasfoundthattheapplicationofthis technologyCanleadtoprecognitionofthedesignedbuilding performance thatprovides a real opportunity to decision makerstoenhancethebuildingperformanceinawaythat minifytheenergyconsumption,cost,andpollution.
2022, IRJET | Impact Factor value: 7.529 | ISO 9001:2008 Certified Journal |
International Research Journal of Engineering and Technology (IRJET) e ISSN: 2395 0056
Theresultsshowedthat:
•Usesuitableorientationofthebuildingsavesaround3% 4%oftheenergyanditscost.
•Reducingthewindowstowallsrationto20%canreduce theenergyanditscost2% 4%,respectively.
• 1.5% of total energy can be saved by using the proper Morphologyofbuilding.
•UseasuitableHVACsystemcansave(15% 45%)ofannual energyand(5% 30%)ofitscost.
1. Pacheco,R.,Ordóñez,J.,&Martinez,G.(2012).Energy efficient design of building: A review. Renewable and SustainableEnergyReviews,16(6),3559 3573.
2. Pessenlehner. W., & Madhavi A. (2003). Building morphology,transparence,andenergyperformance.
3. Kim,S.,Zadeh,P.A.,Staub French,S.,Froese,T.,&Cavka, B.T.(2016).AssessmentoftheImpactofWindowSize, PositionandOrientationonBuildingEnergyLoadUsing BIM.ProcediaEngineering,145,1424 1431.
4. Reeves and et al, "Guidelines for using Building InformationModelingforenergyanalysisofbuildings," Buildings,vol.5,no.4,pp.1361 1388,2015.
5. Shaik,S.,Gorantla,K.,&Setty,A.B.T.P.(2016).Effectof WindowOverhangShadeonHeatGainofVariousSingle GlazingWindowGlassesfor PassiveCooling.Procedia Technology,23,439 446.
6. Muhaisen,A.S.,&Abed,H.M.(2016).EffectofBuilding Proportions on the Thermal Performance in the Mediterranean Climate of the Gaza Strip. Journal of EngineeringResearchandTechnology,2(2).
7. Gao, Koch, and Wu, "Building Information Modelling based Building Energy Modelling: A review," Applied Energy,vol.238,pp.320 343,01/222019.
8. Abanda and et al, "An investigation of the impact of building orientation on energy consumption in a domestic building using emerging BIM (Building InformationModelling),"Energy,vol.97,pp.517 527, 2016
9. Autodesk. (2014). Building Information Modeling for Sustainable Design. Available: https:// federal news network.com/wpcontent/uploads/pdfs/Building Information Modeling for Sustainable Design white%20paper.pdf,Accessedon:November15,2019
10. CentralElectricityAuthority'sYearEndReview2020 21,NewDelhi:CEA,MoP,fromGOVERNMENTOFINDIA, Retrievedwww.cea.nic.in/reports/yearly/annualreport /2020 21/ar_20_21.pdf,2021
Volume: 09 Issue: 07 | July 2022 www.irjet.net p ISSN: 2395 0072 © 2022, IRJET | Impact Factor value: 7.529 | ISO 9001:2008 Certified Journal