Volume: 09 Issue: 07 | July 2022 www.irjet.net p ISSN: 2395 0072
Prediction and Analysis of Water Requirement in Automated Irrigation System Using ANN And Lora Technology
1234students, Department of Electronics and Communication Engineering, Dr. AIT, Bangalore 560056
5 Professors of, Department of Electronics and Communication Engineering, Dr. AIT, Bangalore 560056

6 Assistant Professor, Department of Electronics and Communication Engineering, Dr AIT, Bangalore 560056 ***
Abstract: Anautomatedirrigationsystemwasdeveloped tooptimize waterusagefor agriculturecrops.Thesystem consisting of wireless sensor unit that is temperature sensorandsoilmoistureareplacedintheplantrootzone by using LoRa technology. This desired threshold values from temperature and soil moisture sensor are programmedtocontroller.TheGPRScanbeusedtosenda data to IOT and the user. ANN is use in the paper for optimizing the usage of water in automatic irrigation system
Key Words: WSU, WIU, WiFi, IoT, ANN
1. INTRODUCTION:
Agriculture uses 85% of available freshwater resources worldwide and this use of freshwater will continuetobeincreasebecauseofpopulationgrowthand increasedfooddemand.
In nations like India most of irrigation system is operated manually. This can overcome by the semi automated and automated irrigation technique. The available traditional irrigation technique are terraced irrigation,dripirrigation,sprinklerirrigation.
This type of irrigation is waste of water and its poor performance. This problems can be appropriately rectified if we use automated system for irrigation to reducethewasteofwaterandimprovecropperformance theautomatedirrigationsystemaredeveloped.
This system uses the wireless network of temperature sensor and soil moisture sensors are placed intherootzoneofplantandwaterlevel sensorisused to find the level of water in the tank. These sensors can be usedtoprovidetherightamountofwaterattherighttime which can be provided to plants without using any labor. The temperature varies day by day it cannot be made constanteasilybutbyusingthistechniquewecangivethe almostconstanttemperaturethatplantrequires.Thedata oftemperature,moistureandtheamountofwater issend to IOT through GPRS. This data is applied to ANN’S it works in the principle of prediction, it compares the valuesoftwothreedaysandtheoutputoftheANN’Sshow the feature days data this helps to store the water for upcomingdays.Theperformanceandprogressofcropcan be analyzed by using the artificial neural network. It is usedforoptimizationofwater.
2. METHODOLOGY
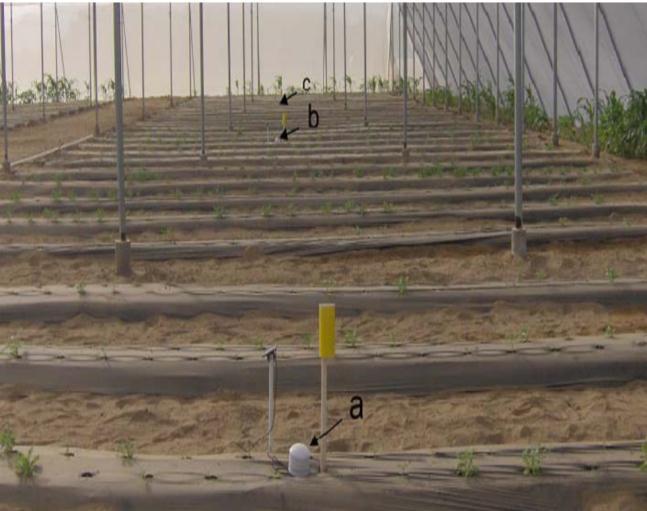
Fig1:Configurationoftheautomatedirrigationsystem. WSUsandaWIUbasedonmicrocontrollerandLoRa technologies.
The automated irrigation system mainly consisting of two components wireless sensor unit (WSU’s) and a wireless information unit (WIU’s). The Wireless sensor unit consisting of moisture sensor and temperature sensor. This can be used to monitoring and recording the
International Research Journal of Engineering and Technology (IRJET) e ISSN: 2395 0056
© 2022, IRJET | Impact Factor value: 7.529 | ISO 9001:2008 Certified Journal | Page1113
Kishor C1 , Ratihn Gowda K G2 , Rohit 3 , Rahul B N4, Dr. Umadevi H5 , S Nithyashree6
International Research Journal of Engineering and Technology (IRJET) e ISSN: 2395 0056
Volume: 09 Issue: 07 | July 2022 www.irjet.net p ISSN: 2395 0072
physical condition of the environment. Wireless information unit consists of controller and WIFI technology. Motor is connected through relay. The WIU send the data to the web and user through WIFI. When temperature is below the threshold value, the motor will be OFF and above the threshold value, the motor will be ON.Thewebdata isappliestoANN’s.TheANN’snetwork compares the previous temperature and moisture level anditgivesthevaluesofnextdays.
Wireless sensor Unit(WSU): Fig2:WSU
WSU consists of Temperature sensor, Moisture sensor which is used to read the temperature and moisture level of the soil. The sensor output voltage is directly proportional to temperature that is there will be a rise of 10mV for every 1°C rise in temperature. The Microcontroller in the WSU receives the data from the sensors and provides the sensor data to the LoRa transmitter.LoRatransmittertransmitsthesensordatato theWIU
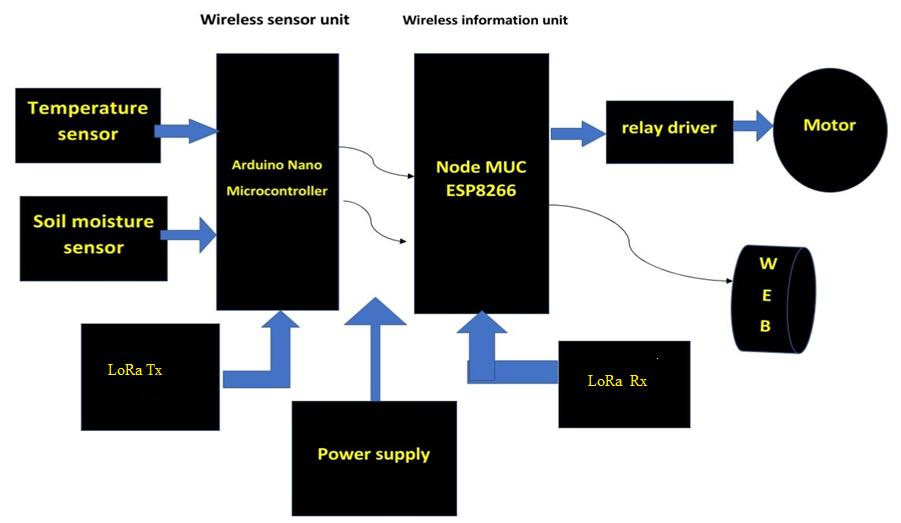
Wireless Information Unit(WIU): Fig3:WIU
WIU consists of LoRa receiver, Microcontroller, Motor control Unit, Relay, ANN and Wifi module. The LoRa receiver receives the data transmitted by the LoRa transmitter and provides this data to the controller unit. Thecontrollerunit processesthedata andcompareswith thepredefinedthresholdvalue.Ifthevalueisgreaterthan the threshold value, then it turns the motor on, else it turns the motor off. And the same status is sent to GSM module.
The Wifi module is used to send the motor status by sendingthemessagetotheregistereduser.
Once the motor is turned on/off, then the values of temperature sensor, moisture sensor and the amount of water taken to reach the threshold value are sent to the web (Thingspeak). Thingspeak is used to store the all the sensor data and consumption of water for the particular temperature/moisture
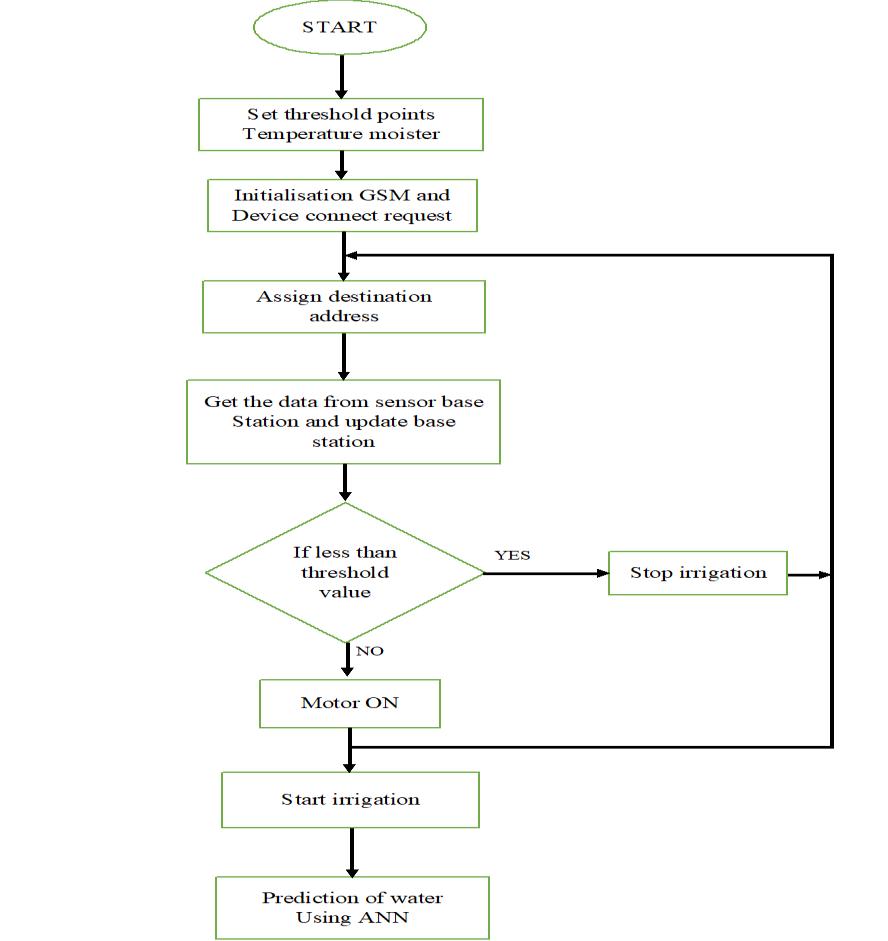
3. FLOWCHART
Sensors Threshold pointes
Temperature <27⁰c Motor off >27⁰c Motor on
SoilMoisture <807 Motor off >807 Motor on
Algorithm steps:
Step1:Startirrigationsystem
Step 2: Initialize the threshold level of the both temperatureandmoisturesensor
Step3:InitializetheGSM
Step4:CollectthesensordatafromtheWSU
Step 5: If the values of temperature and soil moisture is greater than threshold value, then start the irrigation system.
Step 6: If the values of temperature and soil moisture is lessthanthresholdvalue,thenstoptheirrigationsystem.
2022, IRJET | Impact Factor value: 7.529 | ISO 9001:2008 Certified Journal | Page1114
©
International Research Journal of Engineering and Technology (IRJET) e ISSN: 2395 0056
Volume: 09 Issue: 07 | July 2022 www.irjet.net p ISSN: 2395 0072
Step 7: Send the sensors values, motor status and consumptionofwatertoThinkspeakandANN.
Step8:ANNanalysisthedataandcalculatestheamountof waterrequiredforthecomingdays.
4: Date Stored In Web (IOT)
IOT is used to provide sensor information as well as enable device to device communication so that we can exchange the data between physical devices and web. Softwareallowstheusertovisualizethedata throughthe authorized devices which consists internet. The stored data in the web will be read by the software and used to predicttheupcomingdata.
Table Column Head
Date Temp Moisture Motor Status Water Pumped Total Usage
Day1 27.55 500 On 100ml 100ml Day1 26.23 450 Off 00ml 100ml Day1 28.56 750 On 150ml 250ml Day2 29.23 895 On 110ml 360ml Day2 31.23 754 On 60ml 420ml Day2 26.95 659 Off 00ml 420ml Day2 27.56 862 On 50ml 470ml Day3 29.01 430 On 60ml 530ml Day3 26.01 301 Off 00ml 530ml Day3 25.96 900 On 90ml 620ml
Water usage approximation using ANN’s:
Artificialneuralnetworks(ANN)areusedformodeling non linear problems and to predict the output values for given input parameters from their training values. The neural network similar to the human brain because of its function so that it including classifying information, predicts outcomes and cluster data. As the networks process and from data they can classify a given data set intoapredefinedclass,itcanbetrainedtopredictoutputs that are expected from a given input and can identify a special feature of data to then classify the data by that specialfeature.
Thing speak stores the data and provides the same data to the ANN. When all data is provided to the ANN, based on that data, it calculates the quantity of water required.ThemainobjectiveofusingthisANNistoknow quantity of water required for the upcoming days, so that we need to store the water in order to utilize in future days.
Historical data of water usage
The above table shows the historical data of temperature sensor values, moisture sensor values and theamountofwater usedtoreachtherequiredthreshold value.
Water usage data of previous days
Date Temp Moisture Motor Status Water Pumped Total Usage
Day1 27.55 500 On 100ml 100ml Day1 26.23 450 Off 00ml 100ml Day1 28.56 750 On 150ml 250ml Day2 29.23 895 On 110ml 360ml Day2 31.23 754 On 60ml 420ml Day2 26.95 659 Off 00ml 420ml Day2 27.56 862 On 50ml 470ml Day3 29.01 430 On 60ml 530ml Day3 26.01 301 Off 00ml 530ml Day3 25.96 900 On 90ml 620ml
Water prediction data of upcoming days
The net input can be calculated by using the below formula. yin=x1.w1+x2.w2+x3.w3+……..+xm.wm i.e.,Netinput yin=∑
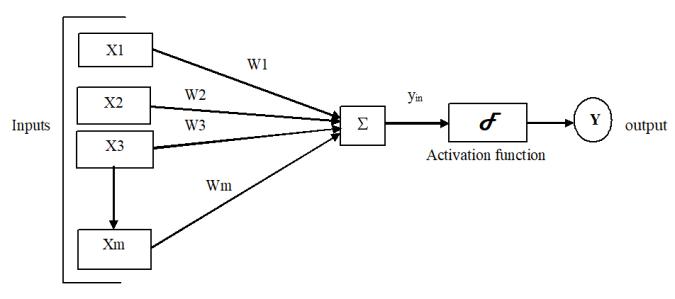
The output can be calculated by applying through the activationfunctionoverthenetinput.
Y=F(yin)
Output=Function(netinputcalculated).
Water prediction data of upcoming days
Date Temp Moisture Motor Status Water Pumped Total Usage
Day4 28.10 610 On 110ml 110ml Day4 26.33 511 Off 00ml 110ml Day4 28.30 841 On 220ml 310ml Day4 29.59 796 On 170ml 480ml Day5 31.00 673 On 90ml 570ml Day5 28.55 751 On 85ml 655ml
© 2022, IRJET | Impact Factor value: 7.529 | ISO 9001:2008 Certified Journal | Page1115
International Research Journal of Engineering and Technology (IRJET) e ISSN: 2395 0056
Volume: 09 Issue: 07 | July 2022 www.irjet.net p ISSN: 2395 0072
Water prediction data of upcoming days
Date Temp Moisture Motor Status Water Pumped Total Usage
Day5 28.00 558 On 55ml 710ml
Day6 26.99 645 Off 00ml 710ml Day6 27.05 873 On 50ml 760ml Day6 26.9 465 On 00ml 760ml
This table shows the predicted water required for the coming days, which is calculated by using ANN. ANN analyses the previous data based on that, it predicts the amountofwaterrequiredinupcomingdays.
5.RESULT.
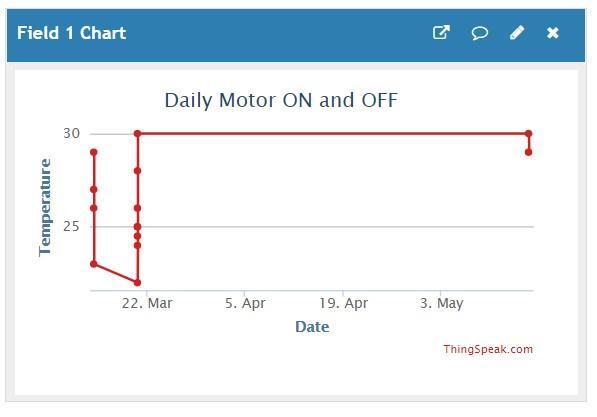
Temperature data
Soil Moisture Data
Hereweplottingtemperaturegraphoncomputer using processing environment and Arduino. The graph is used to observe and subsequently describe the visible patternthatexistswithinthedata.Wejustreadtheanalog output of the temperature sensor as shown in graph. The temperature varies according to the time and it’s directly proportional. The graph shows the temperature for particulardateandtime.
The above graph shows the soil moisture data. Based on the temperature the soil moisture content varies and it stores the data. The variation of the sensor data will be shown in the above graph Based on that data motor works.
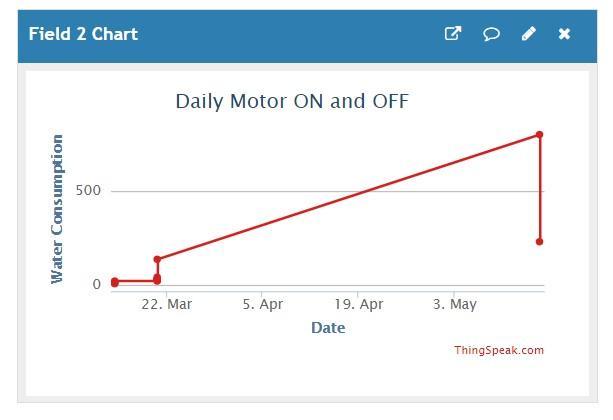
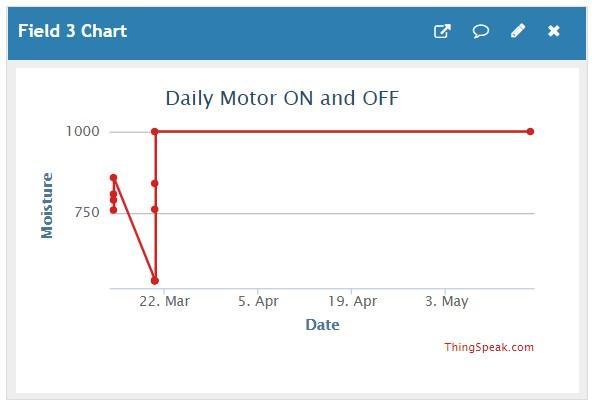
Water consumption data
Theabove graph showsthe waterconsumption.Based on both the temperature and moisture data amount of consumption of water data will be also stored and it is shownintheabovegraph.
© 2022, IRJET | Impact Factor value: 7.529 | ISO 9001:2008 Certified Journal | Page1116
International Research Journal of Engineering and Technology (IRJET) e ISSN: 2395 0056
Volume: 09 Issue: 07 | July 2022 www.irjet.net p ISSN: 2395 0072
Prediction of water for upcoming days:
fulfillment Bachelor of Engineering in Electronics and Communication.. I take this opportunity to express my deepsenseofgratitudeMr.DrRameshSDepartmenthead ECE, Dr.AIT Bangalore, for his constant support. I am thankful to may project guide Dr. Umadevi H Professor dept of ECE I am Finlay thankful to Miss. S Nithyashree Assistant Professor Dept. of ECE Dr AIT Bangalore for the guidanceandsupportfromtimetotime
REFERENCES
[1] Kishor C, “Water usage approximation of Automated Irrigation System using IOT and ANN’s” Second International conference on I SMAC (I SMAC 2018)IEEE Xplore Part Number: CFP18OZV ART; ISBN:978 1 5386 1442 6
[2] Joaquín Gutiérrez, Juan Francisco Villa Medina, Alejandra Nieto Garibay, and Miguel ÁngelPorta Gándara, “Automated Irrigation System Using a Wireless Sensor Network and GPRS Module,” IEEE transactions on instrumentation and measurement, vol.63,no.1,January2014.
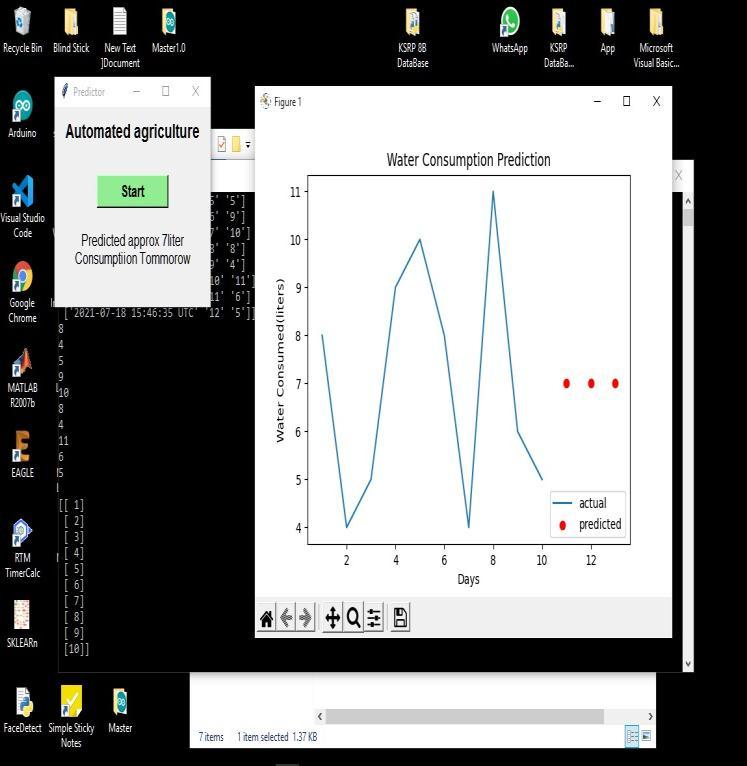
The graph shows the relation between the temperature and the consumption of water. X axis shows thetemperatureandY axisshowsthewaterconsumption. Blue dot shows the particular temperature and the amount of water consumed, the red line shows the linear fit, and black star mark shows the amount of water predictedfortheupcomingdays
6. CONCLUSIONS
1. This Study presented a detailed methodology for developing Successful ANN model for prediction of watercharacteristics
2. The Smart Irrigation System implemented is cost effective for optimizing water resources for agriculturalproductions.
3. The Smart Irrigation System proves to be useful as it automates and regulates the watering without any manualintervention.
4. Usingthissystem,wecanmonitorthestatusofallthe sensors (soil moisture, temperature and water level) andalsoON/OFFstatusofthemotor.
ACKNOWLEDGEMENT
We are glad to present on topic as ““Prediction and Analysis of Water Requirement for Automated IrrigationSystemusingIOT andANN” towardsthepartial
[3] John R. Dela Cruz, Renann G. Baldovino, Argel A. Bandala,ElmerP.Dadios“WaterUsageOptimizationof Smart Farm Automated Irrigation System Using Artificial Neural Network”2017 Fifth International Conference on Information and Communication Technology(ICoICT)
[4]Vaishali S, Suraj S, Vignesh G, Dhivya S and Udhiayakumar S “Mobile Integrated Smart Irrigation Management and Monitoring System Using IOT” International Conference on Communication and SignalProcessing,April6 8,2017,India
BIOGRAPHIES


“Dr.Umadevi.H,BE. M.TechPhD Professor,DeptofECEDrAIT, Bangalore,Karnataka,India.”
“SNithyashree,BE. M.Tech Assistant Professor Dept of ECE DrAIT,Bangalore,Karnataka,India.”
“KishorC, StudentDeptofECEDrAIT, Bangalore,Karnataka,India.”
© 2022, IRJET |
7.529 | ISO 9001:2008 Certified Journal | Page1117
Impact Factor value:
International Research Journal of Engineering and Technology (IRJET) e ISSN: 2395 0056
Volume: 09 Issue: 07 | July 2022 www.irjet.net p ISSN: 2395 0072

“Rohit, StudentDeptofECEDrAIT, Bangalore,Karnataka,India.”


“RathinGowdaKG, StudentDeptofECEDrAIT, Bangalore,Karnataka,India”
“RahulBasavarajNaragund, StudentDeptofECEDrAIT, Bangalore,Karnataka,India.”
© 2022, IRJET | Impact Factor value: 7.529 | ISO 9001:2008 Certified Journal | Page1118