International Research Journal of Engineering and Technology (IRJET) e ISSN: 2395 0056

Volume: 09 Issue: 07 | July 2022 www.irjet.net p ISSN: 2395 0072
International Research Journal of Engineering and Technology (IRJET) e ISSN: 2395 0056
Volume: 09 Issue: 07 | July 2022 www.irjet.net p ISSN: 2395 0072
Department of mechanical engineering, MLR institute of technology, Hyderabad, Telangana 500043 ***
Abstract - Electric vehicles have been gaining attention as an efficient and clean means of transportation. This project focuses on the study of dynamic performance and electric consumption of an electric bike. To stimulate the operation of the electric bike, this study establishes the simulation models including dynamic models of the electric bike components and battery. These simulation models are solved by sci lab to provide the operating characteristics of vehicle. Each major electric component of the electric powered bike is modeled by Model Based Design (MBD) method with Sci lab. Modelling of EV in sci lab can help in predicting the component size, predict the behaviors of system and component, predict the energy consumption and many more. Initially a simulation is created using a standard drive cycle available (NEDC and WLTP). Basically, a drive cycle is a series of data points representing the speed of a vehicle versus time. Drive cycle are produced by different countries and organizations to assess the performance of a vehicles. The data generatedfrom simulation is very crucial while selecting a motor for the vehicle. After selection of motor battery will be selected and based on their specification and power required by the motor. This simulation model will save time and money by running the analysis without buying the actual component.
Key Words: Drive cycle, simulation, analysis, dynamic model…
This project includes development of a high performing powertrain there are several areas that needs to be considered. Within the frame of the project the areas of vehicledynamics,accumulatorsandpropulsionanalysisare included. These areas have their own limitations and problemsthatrequiretobesolved.Toproperlyassesshow powertrainwouldperformduringthisevent.Themodelwill bedevelopedusingSci labXcos,itwillusetheoutcomesof thevehiclesimulationcodeofthepower’smotor,torque’s motor, and speed’s motor. Apart from the performance evaluationobtainedfromthesimulationmodels,thereare some aspects of each proposed solution that should be evaluatedqualitativelytohaveamorecomprehensiveidea oftheirpotential.Theseaspectsincludedesigncomplexity and cost. After evaluating all the results for the different viable solutions, the best configuration is chosen, and a preliminarydesignwillbeprovided.Thisdesignwillinclude a fast overview of all the components included of the powertrain.Especiallycomponenttestofeachmajorelectric partthatarerepresentedbymotor,inverterandbatteryand
assessmentofthetotalelectricbikesystemisveryimportant in developing electric powered bike. Functional test and assessmentmethodabouteachelectriccomponentortotal system using non verified prototype component in real situation has not also probability to face mishap or injury duetofaultofthecomponentbutalsocausinglotsoflosses economically and in time. And it is also impossible to do cyclictestatthesamecircumstancesbecausetestconditions suchasdrivingmode,speedandroadconditionarechanged accordingtotestdriverorenvironmentalchange.
Model BasedDesign(MBD)maybeamathematicaland visualmethodofaddressingproblemsrelatedtodesigning complex control, signal processing, and communication systems. it's utilized in many motion controls, industrial equipment, aerospace, and automotive applications, embedded systems, system modeling, state estimations & optimizations, etc. Model based design may be a methodologyappliedindesigningembeddedsoftware.
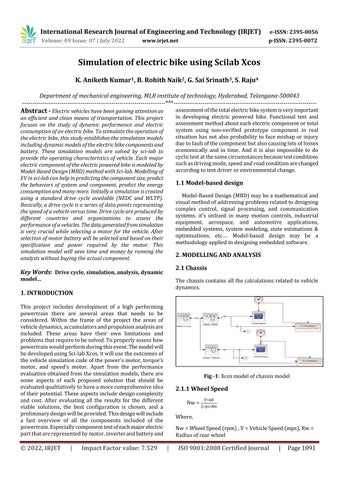
The chassis contains all thecalculations related to vehicle dynamics.
Fig 1:Xcosmodelofchassismodel
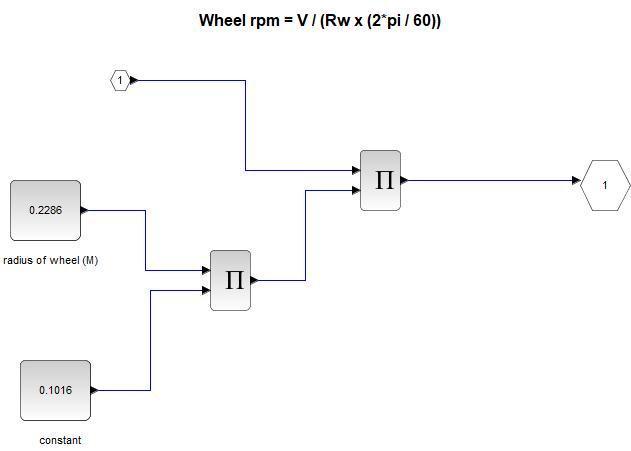
2.1.1 Wheel Speed
Nw= Where, Nw=WheelSpeed(rpm),V=VehicleSpeed(mps),Rw= Radiusofrearwheel
International Research Journal of Engineering and Technology (IRJET) e ISSN: 2395 0056
Volume: 09 Issue: 07 | July 2022 www.irjet.net p ISSN: 2395 0072
Crf=coefficientofrollingfriction
Fig 2: Xcosmodelofwheelspeed
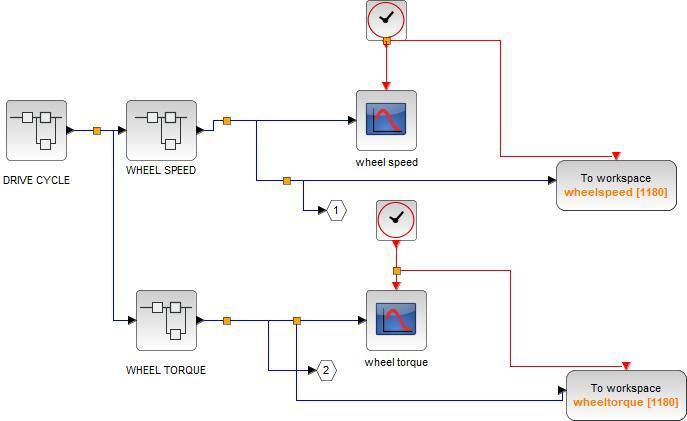
WT=Totaltractiveeffort*RW
Totaltractiveeffort=Rollingresistance+Gradientforce+ Aerodynamicforce+Accelerationforce
Fig -4: Xcosmodelofrollingresistance
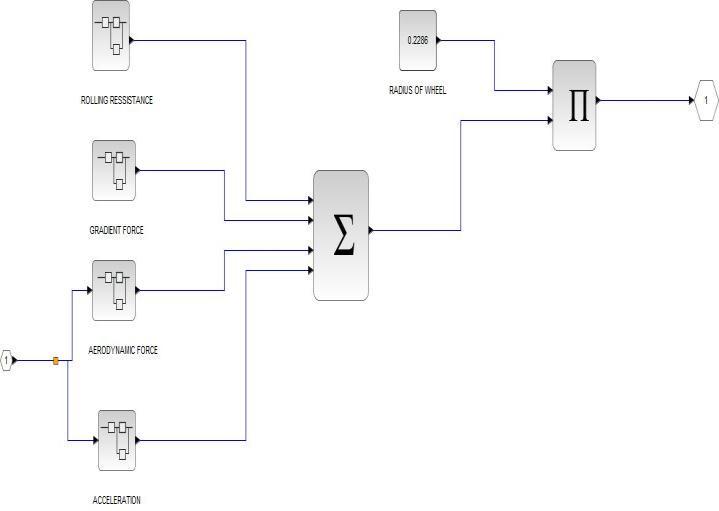
2.1.4 Aerodynamic force
It is a resistive force acting on the vehicle, because of its frontalarea,densityofair,geometryofcar&carsvelocity. Whentheareaofthevehicleisnotgiventheaerodynamic forcecanbecalculatedbyprocesscalledcoastdownprocess.
Fa=1∗rho∗A∗Cd∗�22
Where,
Fa=AerodynamicForce[N], rho=Densityofair[Kg/m^3],
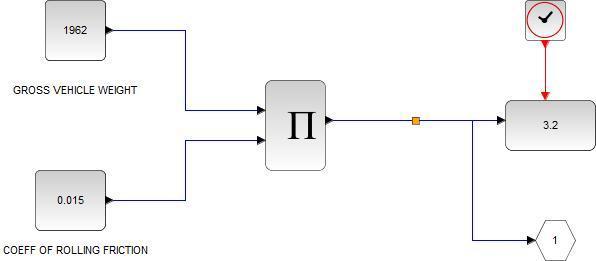
Fig 3: Xcosmodelofwheeltorque
Rolling resistance, sometimes is generally referred to as rollingfrictionorrollingdrag,isthattheforceresistingthe motionwhenabody(suchasaball,tire,orwheel)rollsona surface.Rollingresistanceforceisthattheproductofgross vehicle weight and therefore the rolling resistance coefficient. The coefficient of rolling resistance, which has thedimensionoflength, isapproximatelyadequate to the worthoftherollingresistanceforcetimestheradiusofthe wheel divided by the wheel load. The coefficient rolling resistancevaluedependsonthewheelsandroadmaterial.
Fr=GVW∗Crf
Where,
Fr=Rollingresistanceforce[N]
GVW=Grossvehicleweight[N]
A=Frontalarea[m2] Cd=CoefficientofDrag, v=VehicleSpeed[m/s]
Fig 5: Xcosmodelaerodynamicforce
2022, IRJET | Impact Factor value: 7.529 | ISO 9001:2008 Certified Journal
International Research Journal of Engineering and Technology (IRJET) e ISSN: 2395 0056
Volume: 09 Issue: 07 | July 2022 www.irjet.net p ISSN: 2395 0072
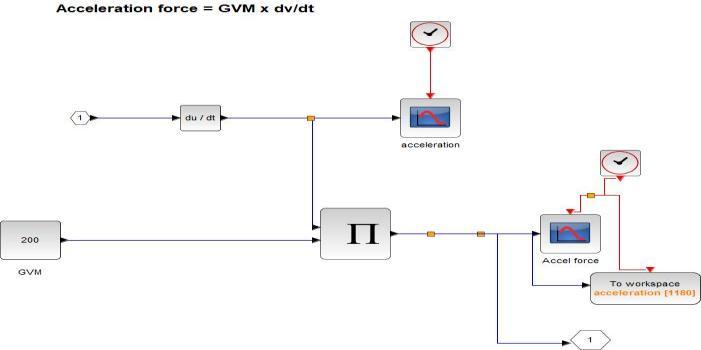
Acceleration force is the force that helps the vehicle to accelerateapredefinedspeedfromrestinaspecifiedperiod oftime.
Facc = GVM*a
Fig 6: Xcosmodelofaccelerationforce
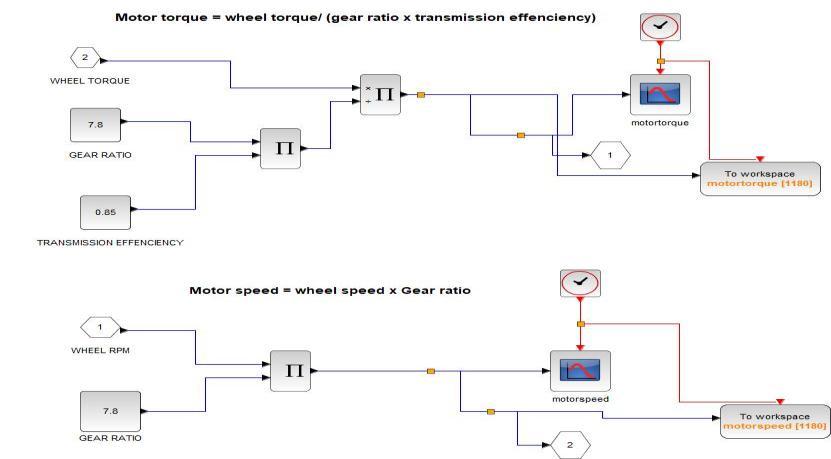
Transmission may be a device present within the electric vehiclewhichisemployedtoextendtorqueorspeedatthe. wheel. The transmission is connected between the motor and therefore the wheels. Transmission may be a system which transfer power from motor to wheel. An electrical vehicledoesn’thaveamulti gearsystemasincombustion vehicle. Almost all electric vehicle features a single speed transmission which is big advantage considering the load andefficiencyloss.Thisdistinctionoftransmissionbetween electricvehicleandcombustionvehicleismajorlyduetotwo reasons.First,anelectricalmotorcandeliveritsmaximum torqueatzeroRPM,soitdoesn'tgottochangegearratiosto urgethespecifiedtorque.Also,electricmotorshaveabigger speedrangecomparedtotypicalinternalengine.Thismeans anelectricalvehiclecanworkononegearratiothroughout therun.
2.2.1
Mt =
Where,
Mt=MotorTorque[Nm],
Tw=WheelTorque[Nm]
Neff=Transmissionefficiency
2.2.2 Motor speed
Ms= Nw*Netgearreduction
Where,
Ms=MotorSpeed[rpm]
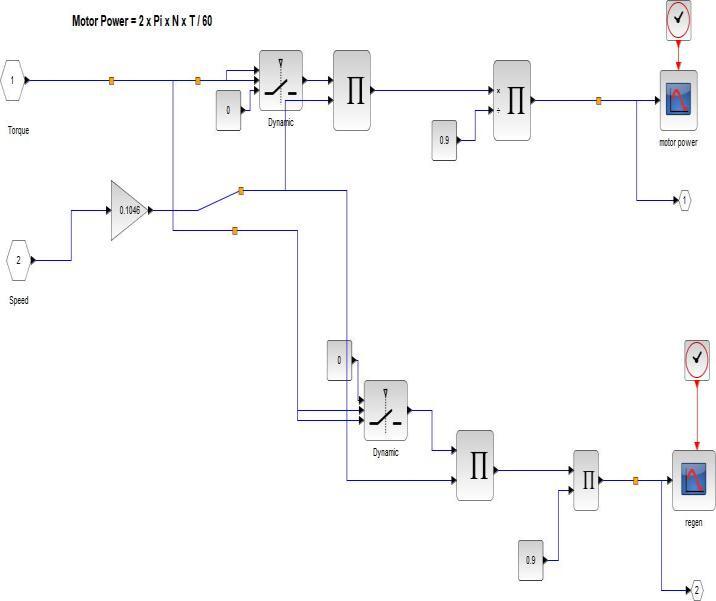
Fig 7: Xcosmodelofmotortorqueandmotorpower
2.2.3
An electric motor is an electro mechanical device that convertselectricalenergyintomechanicalpower.
Motorusefulpower=
Fig 8: Xcosmodelofmotorpower
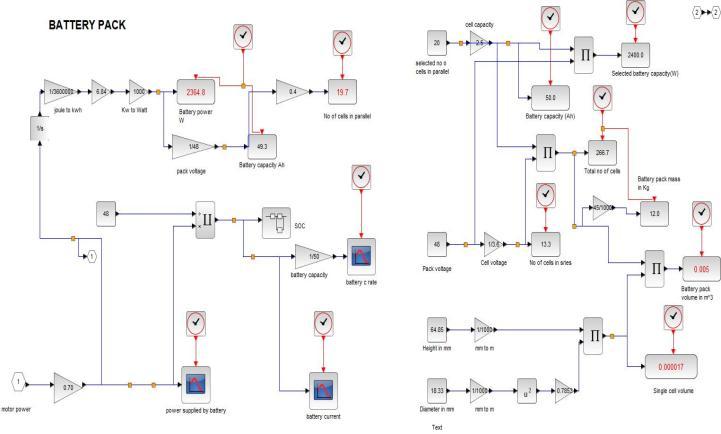
Thebatterysubsystemcontainsalltherequiredcalculations relatedtothebattery.
2.3.1 Battery C-rate
C rate is a measure of the rate at which that a battery is being discharged relative to its maximum capacity. For example, battery with a capacity of Ah, this equates to a dischargecurrentofAmps.TheCrateforthisbatterywould discharge the battery at 500 Amps and C/2 rate would dischargeat50Amps.
© 2022, IRJET | Impact Factor value: 7.529 | ISO 9001:2008 Certified Journal | Page1093
International Research Journal of Engineering and Technology (IRJET) e ISSN: 2395 0056
Volume: 09 Issue: 07 | July 2022 www.irjet.net p ISSN: 2395 0072
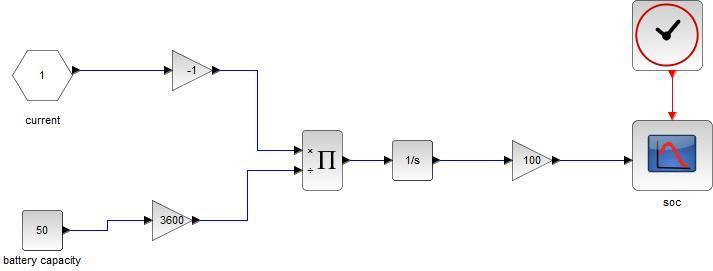
StateofCharge(SOC)ofa cell denotesthecapacitythatis currentlyavailableasafunctionofratedcapacity.Theunitof SOCispercentage.ThevalueofSOCvariesbetween0%to 100%. If the SOC is 100%, then the cell is said to be fully charged, whereas a SOC of 0% indicates the cell is completelydischarged.Thestateofchargeofabatterycan becalculatedbytakingunderconsiderationthequantityof electrical current whichisgoinginandout of the battery. Belowisamethodologyrecognizeascoulombcountingthat worksontheamountofcurrententeringintoandoutofthe battery.
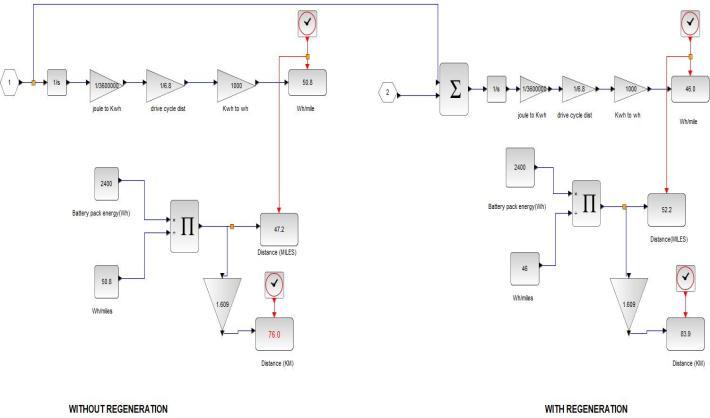
Fig 11: Xcosmodelofvehiclerange
Table 1: InputVehiclespecifications
Sl .No Specification Value Units 1. Kerbmassofvehicle 200 Kg 2. Drivermass 70 Kg 3. Gravity 9.81 m/s 4. Gearratio 7.8:1 5. Efficiencyof transmission 85 6. Frontwheelsize (dia) 21 m 7. Rearwheelsize(dia) 17 m 8. Frontalarea 0.418 m2 9. Airdensity 0.875 Kg/m3 10. Coeffofdrag 1.225
Rangeofanelectricvehiclereferstothedistanceanelectric vehiclecantravelbeforethebatteryneedstoberecharged. RangeofanEViscalculatedbydividingtheamountofpower in battery (KWh) by the efficiency of the vehicle in (KWh/mile).
Adrivecycleisseriesofdatapointsrepresentingthespeed of a vehicle versus time. Drive cycles are produced by different countries and organizations to access the performanceofvehicleinvariousways,asinstanceelectric vehicle autonomy and fuel consumption. To perform simulationNationalEuropeandrivecycle(NEDC)isincluded asreference
Table 1: Drivecycle
NEDC
Distance 11023m
Duration 1180s Averagespeed 9.33mps
International Research Journal of Engineering and Technology (IRJET) e ISSN: 2395 0056
Volume: 09 Issue: 07 | July 2022 www.irjet.net p ISSN: 2395 0072
Chart -5:Wheeltorque
Chart -1:Velocity
Chart 2:Aerodynamicforce
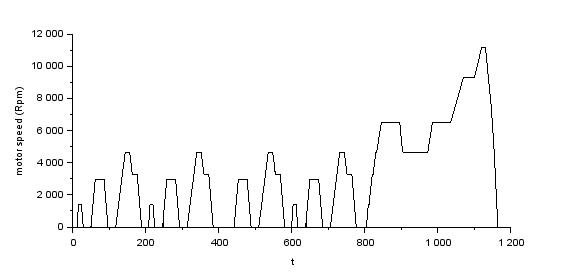
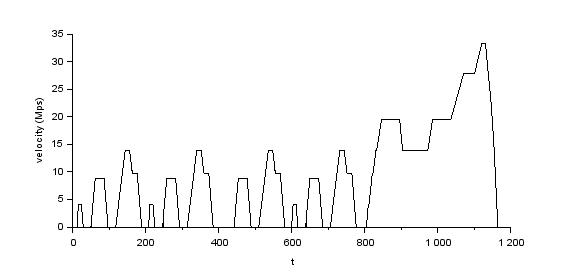
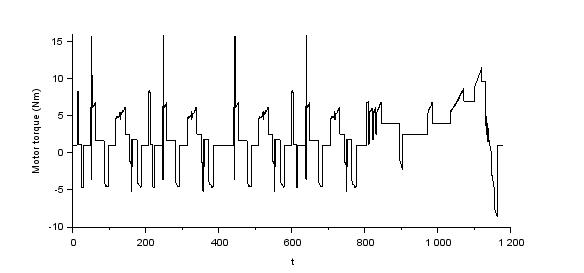
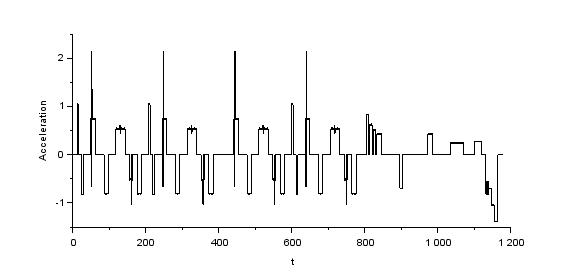
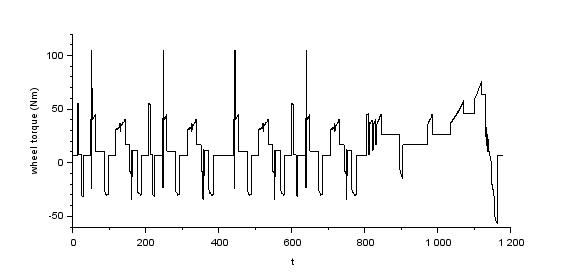
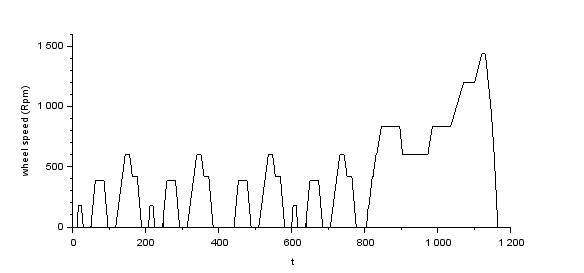
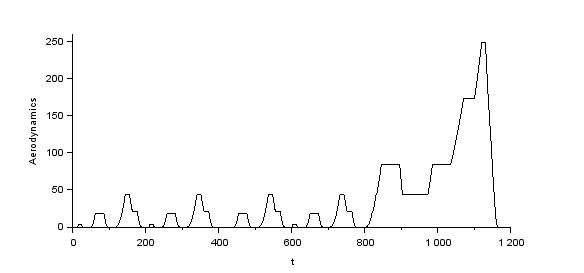
Chart -6:Motorspeed
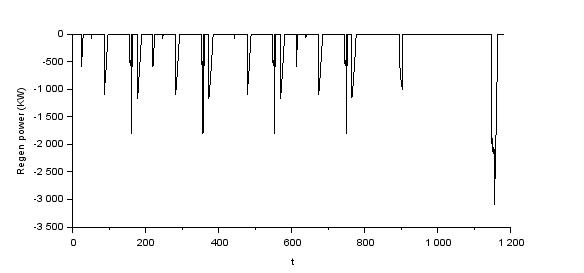
Chart 3:Accelerationforce
Chart 7:Motortorque
Chart 4:Wheelspeed
Chart -8:Regenerativepower
2022, IRJET | Impact Factor value: 7.529 | ISO 9001:2008 Certified
International Research Journal of Engineering and Technology (IRJET) e ISSN: 2395 0056
Volume: 09 Issue: 07 | July 2022 www.irjet.net p ISSN: 2395 0072
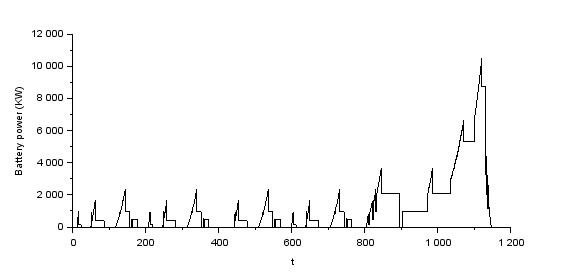
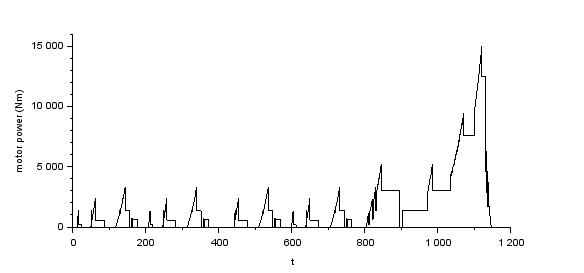
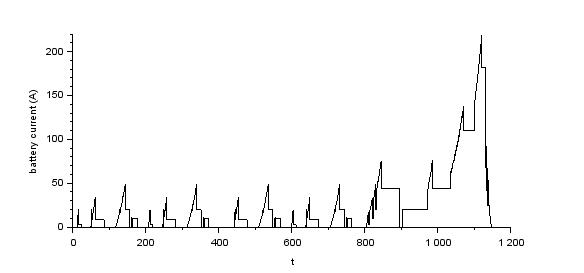
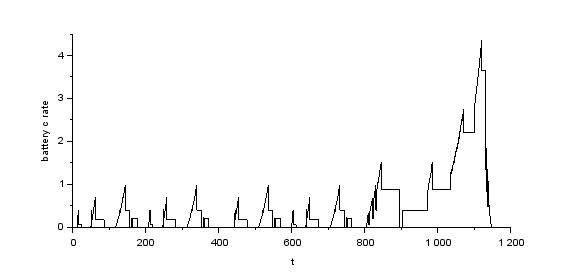
Chart 13:Stateofcharge
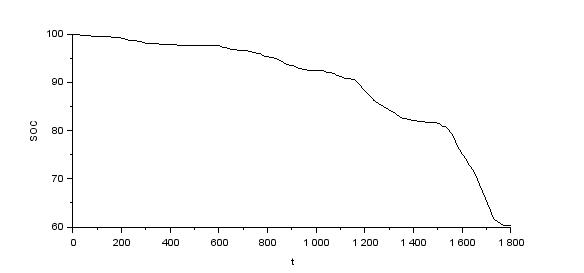
In this project, we successfully did the simulation of 2 wheeler electric vehicle using Sci lab. We selected a suitablemotoranddesignedarelevantbatterypackusing data of drive cycle which is validated using Sci lab model. The Battery pack design is also appropriate as SOC is decreasing to around 15% in NEDC. Every simulation has somelimitationwhichmightcauseinaccuracycomparedto real time results obtained from vehicle. However, these simulationsarebeneficialforselectionofcomponentsusing comparativestudybasedonperformanceofelectric bikeas doneinthisproject.
[1] https://youtu.be/c_eK0L1BEag
[2] https://youtu.be/1TIQ4ekaIwM
[3]https://www.scilab.org/ev design battery simulation
[4]EVdesign batterysimulation x engineer.org
Astudyonparametervariationeffectsonbatterypacksfor electricvehiclesScienceDirect
[5] A comparative study on battery thermal management usingphasechangematerial(PCM) ScienceDirect
[6]Batterythermalmanagementsystememployingphase changematerialwithcell to cellaircooling ScienceDirect
[7]Lifeexpectancycalculationforelectricvehicletraction motorsregardingdynamictemperatureanddrivingcycles| IEEEConferencePublication|IEEEXplore