International Research Journal of Engineering and Technology (IRJET) e ISSN: 2395 0056

Volume: 09 Issue: 07 | July 2022 www.irjet.net p ISSN: 2395 0072
International Research Journal of Engineering and Technology (IRJET) e ISSN: 2395 0056
Volume: 09 Issue: 07 | July 2022 www.irjet.net p ISSN: 2395 0072
Aiswarya A V 1, Aswani P R 2, Sayana Salam 3, Fahmi Banu 4, Jency Nadayil5
1,2,3,4Graduate Student, Department of Civil Engineering, Mar Athanasius College of Engineering, Kothamangalam, Kerala, India
5Assistant Professor, Department of Civil Engineering, Mar Athanasius College of Engineering, Kothamangalam, Kerala, India ***
Abstract A vital part of keeping us alive is water. 75% of the surface of the earth is covered by water. Only a very small portion, though, is fresh water that may be used by people, animals, and plants right away. Increasing population expansion causes a very rapid daily riseinwater consumption. A well designed network of pipes is necessary to provide a sufficient and consistent amount of water in order to satisfy the water needs of thecontinuouslyexpandingpopulation. The general characteristics of the area, such as knowledge of the primary water source, population, water consumption, need for pumps, distribution network, and water tanks, are necessary for the efficient design of the water supply system. A pipe network's analysis and design are difficult and time consuming There are several different pipe softwares available now for the analysis and layout of pipe networks. The road network survey is carried out using GEO Trackers, and the results are plottedusingQGISsoftware. UsingEPANET 2.0 software with additions, the current Study comprises the design and simulation of a water supply scheme. A computer software called EPANET 2.0 simulates hydraulic and water quality behaviour over a long length of time in pressurized networks.
Key Words: QGIS, GEOTRACKER, EPACAD, EPANET, WATERNETGEN, DESIGNForthegrowth,survivalanddevelopmentofhuman healthsafedrinkingwater,sanitationandgoodhygieneare inevitable. Watersupplysystemsarerequiredtomeetthe requirementsofpublic,commercialandindustrialactivities. The water supply system must be designed in such a way thatappropriatewaterpressureandflowcanbeachieved efficientlyandalsotoavoidcontaminationtopotablewater. A well planneddistribution system is used to Convey the waterfromthetreatmentfacilitytotheindividualhomes.
Theobjectiveofthisstudyistodesignandsimulate awatersupplysystemforEramalaPanchayatinKozhikode District,Kerala Thisparticularlocalityfaceswaterscarcity duringsummerseason,intrusionofsaltwateratthesource ,lackofsufficientdistributionnetwork,frequentbreakdown ofageingtransmissionmainsanddryingupofsourceduring
summerarethemajorproblemsfacedatpresent.Hencea newwatersupplyschemeisinevitableinthisareas.
Thestudystartsfromthepreliminarydatacollectionwhich includesthefielddataandofficedata.Aftercollectingthis thepopulationforecastandsurveyiscarriedout.Laterthe area is plotted using QGIS. Then propose the components andfinallythe designusing EPANETwith extensions. The methodology is sequentially described in the flow chart givenbelow:
Thestudystartsfromthepreliminarydatacollectionwhich includes the field data and office data. The field data
International Research Journal of Engineering and Technology (IRJET) e ISSN: 2395 0056
Volume: 09 Issue: 07 | July 2022 www.irjet.net p ISSN: 2395 0072
comprises of those datas collected from the study area including type of road whether NH or SH, profile of road, totallengthoftheroad,majorinstitutionsoranyobstacles, population distribution etc. In this study population is forecastedbasedonthecensusdatasofpreviousyearand projected to the next 30 years, hence office data includes population,censusdataandpresentdemandofthearea.
Thismethodisgenerallyapplicableinlargeandoldcities.In thismethodtheaverageincreaseofpopulationperdecadeis calculated from the past records and then added to the presentpopulationtofindoutthepopulationinnextdecade.
Year Population 2021 37987 2031 40866 2041 43970 2051 47074
Table1:ProjectedpopulationofEramala
After finding the population water demand is calculated, according to the CPHEEO Manual, the per capita demand adopted is 135lpcd. The losses 15% UFW and 5% other losses are taken into account when calculating the final demand.
Year WaterDemand[MLD]
2021 5.12 2031 5.51 2041 5.93 2051 6.35
Table2:Waterdemand
Thedesignofthecomponentsisbasedonthewaterdemand obtained in each year. In this study industrial demand is excluded.Alsothepopulationabove50,000isnotobserved inanyofthepanchayatandthusweneglectthefiredemand.
Watersupplynetworkrequiressurveyforseveralpurposes suchasestablishingwhetheraproposedwaterprojectcan supplytherequiredvolumeofwaterforitsintendedusers,if financially viable etc. Surveys can also provide datas like capacity of water source, to design the structures for constructingthewaterproject.
The GNU Public License governs Quantum Geographic Information System (QGIS), an open source GIS which is user friendly.DEMfilesthatcontaineitherrasterorvector dataareinsertedinordertoextractelevation.Inthisstudy,a raster created by CARTOSAT 2D by ISRO is employed. ThroughGEOTRACKERS,inputdatacanbeplottedusinga mobilephone,whichminimizesthedifficultiesofaresurvey.
OpentheQGISprogramme.
OpenQuickOpenStreetMap
Choosetheroadfromit
Accesshighwaydatawithpointandlinelayersby downloadingthem.
Toextractvertices,usetheQGISProcessingToolbox.
Addalayerofthedigitalelevationmodel.
UsingtheinformationfromtheQGISToolboxSample Raster,obtaintheElevationofVertices.
Fig2:Stepsforcomputationofelevation
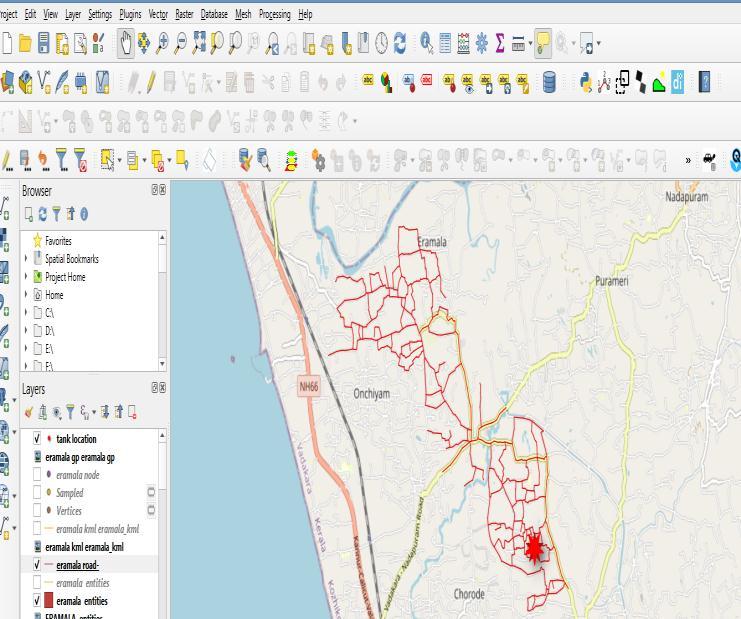
Fig3:StudyareaplottedusingQGIS
International Research Journal of Engineering and Technology (IRJET) e ISSN: 2395 0056
Volume: 09 Issue: 07 | July 2022 www.irjet.net p ISSN: 2395 0072
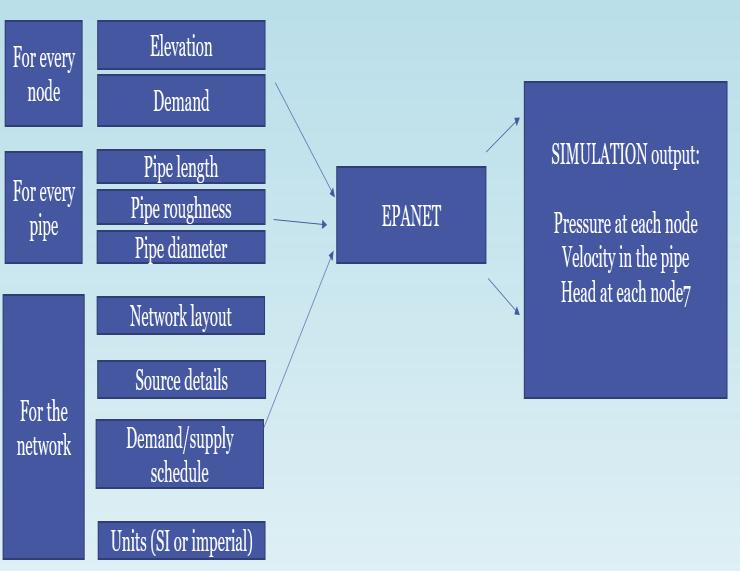
EPANETtrackstheflowofwaterineachpipes,pressureat eachnode,theheightofwatertank.Theflowineachlinkand pressureheadateachnodeisdeterminedbyEPANET.The mainprincipleofEPANETnetworkanalysisisbasedonthe continuityequationandconservationofenergytheory.The continuityequationimplies that thealgebraicsumofflow rates in the pipe meeting at a node together with any externalflowiszero.Theconservationofenergyimpliesthat forallpartsaroundcloseloopsandbetweenfixednodes,the energylossincludingminorlossesminusanyenergygainor headsgeneratedmustbezero.
ThealgorithmusedinEPANETsoftwaretosolvethe flowcontinuityandtheheadlossequationsthatcharacterize the hydraulic state of pipe network is based on Newton Raphson iteration method for solving simultaneous equationswhicharederivedfromtheflowandheadlossin thenetwork.
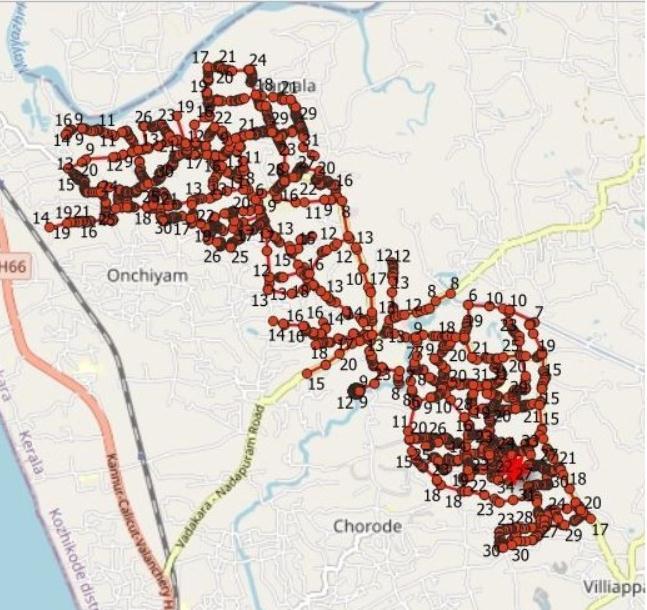
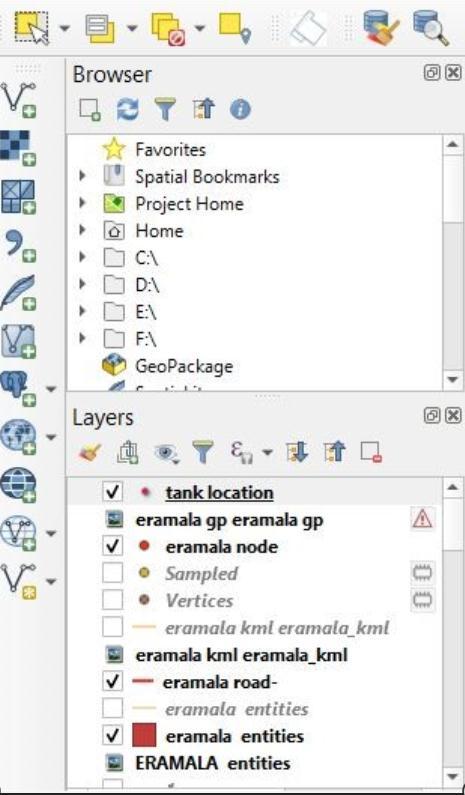
Fig4:BrowserpanelinQGIS
EPACAD developed by ITA is a free software which easily convertsanAutoCadfileintoanEPANETone. EPACADis able to automatically import the main properties of elements,largelyprovidingtherequiredinformationtobuild anetwork.ItisabletoreadXYcoordinatesofAutoCadfiles andelevationsofnodes.
WATERNETGEN is an EPANET extension for automatic WaterDistributionNetworkmodelsgenerationandcanalso allowdemanddrivenandpressuredrivensimulations.Itcan generate synthetic models of WDN with several hundred nodesandpipeswithinfew minutes.Thesizingcapability allowstheselectionofcommercialdiameterssuchthatthe final network designsatisfiescertainuserconstraintslike maximumvelocity(1m/s),minimumpressureetc.Thetotal waterdemandisallocatedtothepipestakingintoaccount theirlengthandademandcoefficient.
Designisthecomputationofparameterslikediameter,flow, velocity,discharge.WhereasSimulationisthecomputation offlow,discharge,velocityetc.withknowndiameter.Inthis
International Research Journal of Engineering and Technology (IRJET) e ISSN: 2395 0056
Volume: 09 Issue: 07 | July 2022 www.irjet.net p ISSN: 2395 0072
studythedesignofDistributionnetwork,transmissionmain andpumpingmain.Simulationiscarriedoutinthedesignof pumping main by simulating the values obtained in Excel withthatofEPANET.
In order to ensure the availability of sufficient water, it becomesimperativeinamodernsocietytoplananddesign sustainablewater.
Entire network of Eramala Panchayat is drawn and water demandisloaded.Thenthepipecatalogueisimported.For maximum velocity and minimum pressure pipe sizing is done.FinallyRuntheAnalysis.
Pressure check for Pressure above 7m
Thepressureacrosseachjunctionshouldbeabove7mas perCPHEEOManual.Ifnotthedesignshouldberechecked forpipe.
The velocity through the pipes should be less than the maximumvelocityie1m/s.
Thediameterofthepipeshouldbehigherinthestarting pointanditgetreducedwhenmovingthroughthenetwork. Alsothediameteralongthepipesinbetweenshouldnotbe more than the pipes adjacent to it. In order to check this, somemanualinterventionsarecarriedout.
Sinceallthedesignchecksaresatisfied,thedesignissafeto implement.Theresultsobtainedverifiedthatthepressures atalljunctionsandtheflowswiththeirvelocitiesatallpipes are feasible enough to provide adequate water to the networkofthestudyarea.
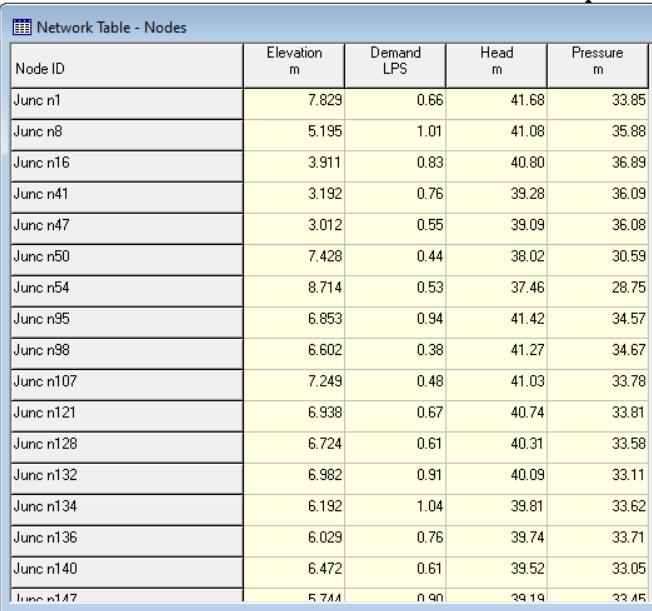
The network table for nodes is shown in table 3 with elevation,demand,head,andpressureateachnodes
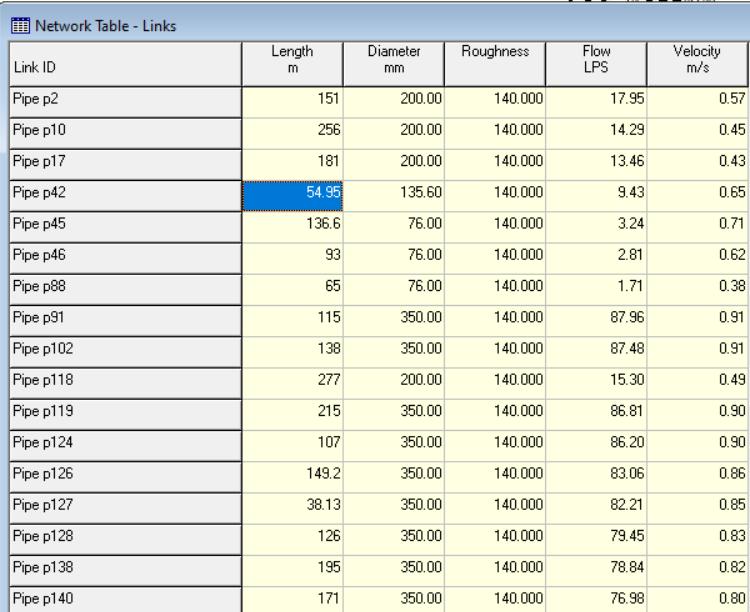
Network table for links is shown in table 4 with length, diameter,roughnes,flowandvelocityofeachnode.
Table3:Networktableofnodes
Table4:NetworktableofLinks
International Research Journal of Engineering and Technology (IRJET) e ISSN: 2395 0056 Volume: 09 Issue: 07 | July 2022 www.irjet.net p ISSN: 2395 0072
[1] Dr G Venkataraman, Ch.V S S Sudheer, B Rajashekhar, (2015), “NetworkAnalysisofWaterdistributionsystemin ruralareasusingEPANET,”Science Direct, 496 505.
[2] G Anisha, A Kumar, J Ashok Kumar,P Suvarna Raju, (2016),“AnalysisandDesignofWaterDistributionNetwork usingEPANETforChiralaMunicipalityinPrakasamdistrict ofAndra Pradesh,” International Journal of Engineering and Applied Science, Issue 4,Volume3.
[3] Manoj Nallanathel, B Ramesh, A P Santhosh,(2018),“WaterDistributionNetworkDesignusing EPANET,Acasestudy,” International Journal of Pure and Applied Mathematics, Volume119,Issue17,1165 1172.
[4]ShafatKhan,KhalidMohiuiddin,(2018),“Evaluatingthe parameters of Arc GIS and QGIS for GIS applications,” International Journal of Advance Research in Science and Engineering, Volume7,Issue3.
[5] Arjun Kumar, Kankesh Kumar, Bharanidharan B, Neha Matial,(2015), Design of Water Distribution System usingEPANET, International Journal of Advanced Research, Volume3,Issue9,789 812.
2022, IRJET | Impact Factor value: 7.529 | ISO 9001:2008 Certified Journal |