International Research Journal of Engineering and Technology (IRJET) e ISSN: 2395 0056

Volume: 09 Issue: 07 | July 2022 www.irjet.net p ISSN: 2395 0072
International Research Journal of Engineering and Technology (IRJET) e ISSN: 2395 0056
Volume: 09 Issue: 07 | July 2022 www.irjet.net p ISSN: 2395 0072
1M. Tech Student, Department of Civil Engineering, College of Engineering Pune, India 411005 Professor, Department of Civil Engineering, College of Engineering Pune, India 411005 ***
Abstract A drought is ‘a protracted period of deficient precipitationresultinginextensivedamagetocrops,resulting in loss of yield’. Drought always starts with the lack of precipitation, but may affect soil moisture, streams, groundwater,ecosystemsandhumanbeings.Thisleadstothe identification of different types of droughts (meteorological, agricultural, hydrological, socio economic), which reflect the perspectives of different sectors on water shortages. Geographic Information System (GIS) and Remote Sensing play an important role for near real time monitoring of droughtconditionoverlargeareas.Thisstudyshowstemporal variation of drought using temporal image of MODIS NDVI based Enhanced vegetation index (EVI), Vegetation health index (VHI), standard precipitation index (SPI) and Drought severity index (DSI) using software’slikeArc GIS,GoogleEarth Engine coder, RStudio, SWMM
Key Words: Drought, Geographic Information system, EVI, VHI, SPI, DSI.
TheeconomyofIndiaisdependentuponagriculture sector.Thus,agriculturecanbecalledasabackboneofIndia. Droughtisaninsidioushazardofnaturewhichisconsidered bymanytobethemostcomplexbutleastunderstoodofall natural hazards. Large historical datasets are required in order to study drought which involves complex inter relationshipbetweentheclimatologicalandmeteorological data. The way to advance in any field is to gain the knowledgeoftheadvancedtechnology.Remotesensingand GeographicalInformationSystemarewaystoenhanceinthe monitoringvegetation,determinationoflandchangesand planningwork.Thesatelliteimageryisusedforyieldand production forecasting, green cover inventory and assessment of drought like catastrophe. By studying the temporalandspatialvariationsinthevegetativestructure, monitoring and analysis can be performed. Vegetation indices are widely used in this field. There are numerous indices in use to study the changing pattern of the vegetation. These indices are the indicators of health and greenness of vegetation and a measure of density. To compute the vegetation indices the band combination is used which mainly comprises of red, green and infrared spectralbands.
One of the most widely used index is Normalized DifferenceVegetationIndex(NDVI)tomonitorvegetation stress. Normalized Difference Vegetation Index (NDVI) convertsmultispectraldataintosingleimagebandwhich displays vegetation distribution. To quantify the healthy greenvegetationbasedonsatelliteimages,NDVIagraphical indicator makes use of the differential reflection of green vegetation in the visible and near infrared portions (NIR) portion of the spectrum thus providing condition of the vegetation.Thevalue ofNDVIrangesfrom 1to +1,value leaning towards +1 denoting healthier vegetation. But enhancedvegetationindex(EVI)offersbetterresultsandis easytounderstandthevegetationchange.
Further, the remotely sensed data from satellite is used to analyze the drought risk and has become widespread these days. The way to mitigate drought effectivelyistomonitorsuchriskinadvancewiththehelpof remote sensing technology. Drought indices have been developedwhichcomprisesofspatialextentofvegetation, duration,intensityofmeteorologicalfactors.Althoughthere are many new indicesthat aretheoreticallymore reliable than the NDVI (such as soil adjusted, transformed soil adjusted,atmosphericallyresistant,andglobalenvironment monitoring indices), they are not yet widely used with satellite data. Among these indices, Enhanced vegetation index(EVI),Vegetationhealthindex(VHI)withlandsurface temperature (LST) delivers a strong correlation thus providing information about all types of droughts beforehand.
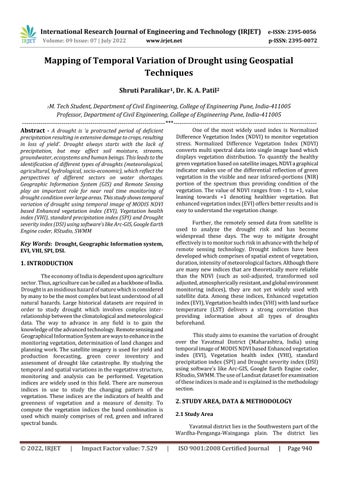
Thisstudyaimstoexaminethevariationofdrought over the Yavatmal District (Maharashtra, India) using temporalimageofMODISNDVIbasedEnhancedvegetation index (EVI), Vegetation health index (VHI), standard precipitationindex(SPI)andDroughtseverityindex(DSI) using software’s like Arc GIS, Google Earth Engine coder, RStudio,SWMM.TheuseofLandsatdatasetforexamination oftheseindicesismadeandisexplainedinthemethodology section.
YavatmaldistrictliesintheSouthwesternpartofthe Wardha Penganga Wainganga plain. The district lies
International Research Journal of Engineering and Technology (IRJET) e ISSN: 2395 0056
Volume: 09 Issue: 07 | July 2022 www.irjet.net p ISSN: 2395 0072
between 19°26’and 20°42’ north latitudes and 77°18’and 79°90’ east longitudes. It is surrounded by Amravati and Wardhadistrictinthenorth,Chandrapurdistrictintheeast, State of Telangana and Nanded district in the south and ParbhaniandAkoladistrictinthewest.Thedistricthasan areaof13,52,000hectareswhichis4.41%ofthetotalareaof Maharashtraandapopulationof20,77,144whichis2.63% ofthestate’spopulation
AccordingtoCGWB, 78.4% ofthedistrictsdomestic andagriculturewaterrequirementismetfromgroundwater sources,andtheremaining 21.6% ismetbysurfacewater sources.TotalWaterrequirementofDistrictisonly 14.267 % ofTotalrainfallavailable.ButMostofthedistrictwater demand is fulfilled by Ground Water Sources. Which are already5 16.2mbellowtheGroundlevelanddepletingday byday.
2.2
Sample Ground water data collected from Central Ground WaterBoard,India (cgwb.gov.in/) Ground Water Yearbook Of Maharashtra (2020 2021), Population data collected from Yavatmal District Municipal Corporation (yavatmal.gov.in/census) , Advanced Spaceborne Thermal Emission and Reflection Radiometer (asterDEM) was downloaded from Nasa earth data website (asterweb.jpl.nasa.gov/gdem.asp), NDVI data (modis.gsfc.nasa.gov/),bhuvan app3.nrsc.gov.in,LULC,Soil Fertility,Socio economiccondition,surfacerunoffmapsand all general data from Yavatmal District Municipal Corporation. Rainfall data over Yavatmal District is downloadedfrommahavedh
Rainfall in Yavatmal District Ranges from 750 1150 mmandannualAverageRainfallis886.4mm,thereforetotal avg. rainfall in district = 0.8864m X 13520 X 106 m2 = 11984.128Mm3/year
GroundwateravailabilityinPremonsoon(2019 20)is 1.00 to 16.60 m bgl (Fall: 0.01 to 0.93 m), Post monsoon DepthofWaterLevel(2019 20)is0.90to15.20mbgl(Fall: 0.009to0.91m).Totaldraft(Irrigation+Domestic):421.02 MCM. Projected Demand (Domestic + Industrial): 114.78 MCM StageofGroundWaterDevelopment:29.85%
Netannualgroundwateravailability:1410.45MCM
2.3.2
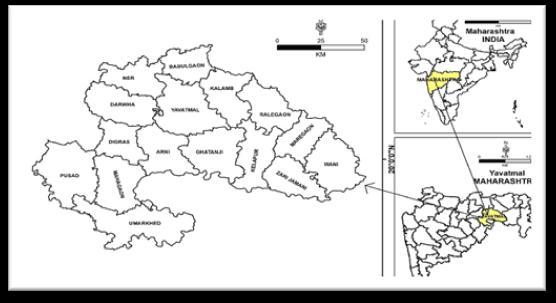
Monthlymeanof30 yearrainfallfromyear1990to 2020 is calculated by google earth engine coder using CHIRPSpentaddatasettoanalyzethemonthlybehaviorof rainfallineachongoingmonth.
Chart 1:MonthlyMeanRainfalloverYavatmalDistrict
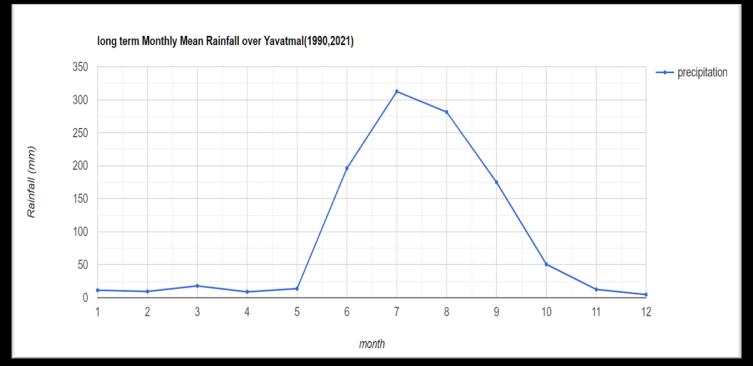
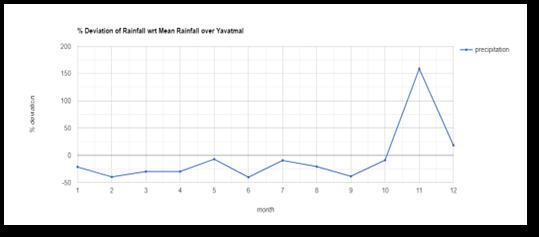
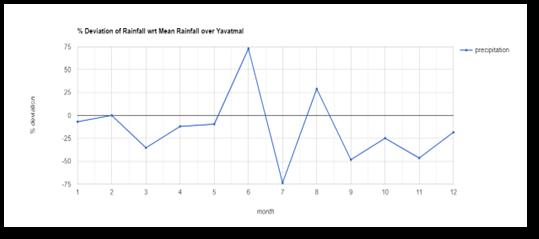
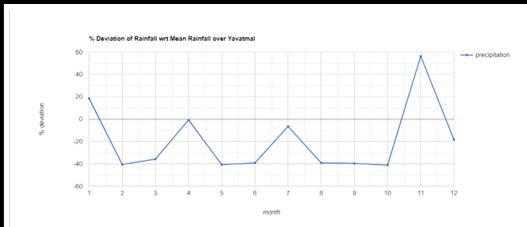
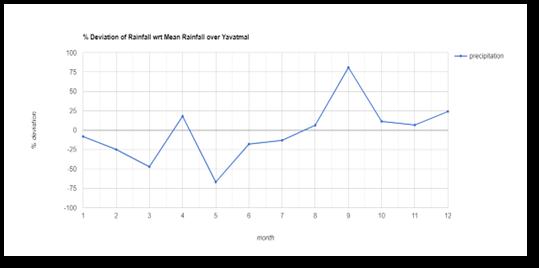
Chart 2:%deviationofRainfallwrtMeanrainfallover Yavatmaldistrictofyear2021
From above calculation if the percent deviation of rainfallispositiveinrainyseasonfromJun Septthenthereis less probability of drought in following year and if it is negativetherewillbemoreprobabilityofdroughtcondition infollowingyear.
The Standardized Precipitation Index (SPI) is an index used for measuring drought and is based only on precipitation.Thisindexisnegativefordroughtandpositive
2022, IRJET | Impact Factor value: 7.529 | ISO 9001:2008 Certified Journal |
International Research Journal of Engineering and Technology (IRJET) e ISSN: 2395 0056
for wet conditions. As the dry and wet conditions become more severe the index become more positive or negative. HereSPIoverYavatmalDistrictiscalculatedusingRStudio Software by using the datasets of daily rainfall from year 1981 2021providedbymahavedh.
2.3.4
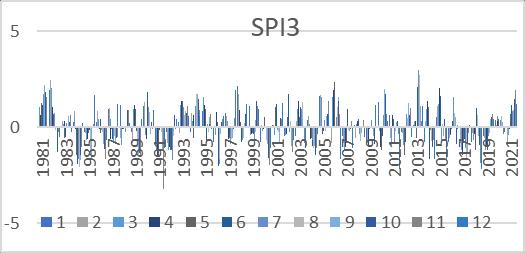
Chart 3:SPI3overYavatmalDistrict
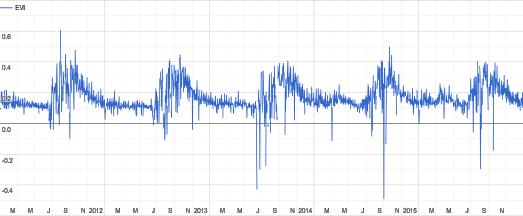
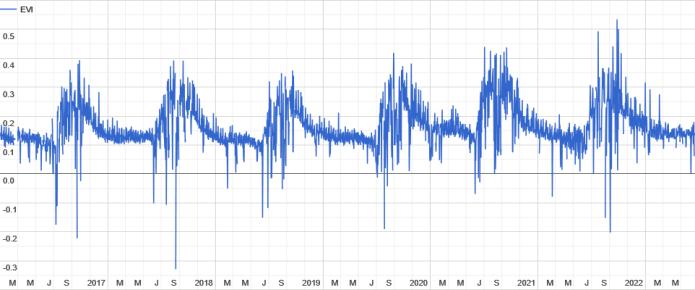
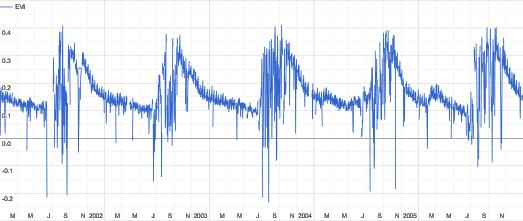
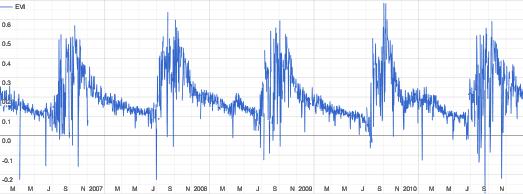
EnhancedVegetationIndex(EVI)islikeNormalized Difference Vegetation Index (NDVI) and can be used to quantify vegetation greenness. However, EVI corrects for someatmosphericconditionsandcanopybackgroundnoise. EVIhasavaluerangeof 1to+1.Droughtconditionoccurs whenEVIislessthan0.2.HereEVIoverYavatmalDistrictis calculated using Google Earth Engine Coder Software by using the datasets of MODIS EVI from year 2001 2022 providedbyunitedstatesgeologicalsurvey.
Chart 6:EVIoverYavatmalDistrict2011 2015
Chart 4:EVIoverYavatmalDistrict2001 2005
Chart -7:EVIoverYavatmalDistrict2016 2022
2.3.4 Calculation of VHI
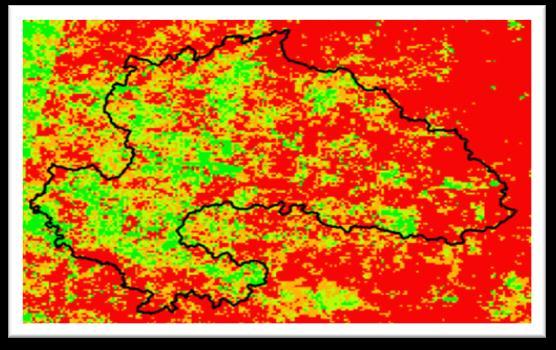
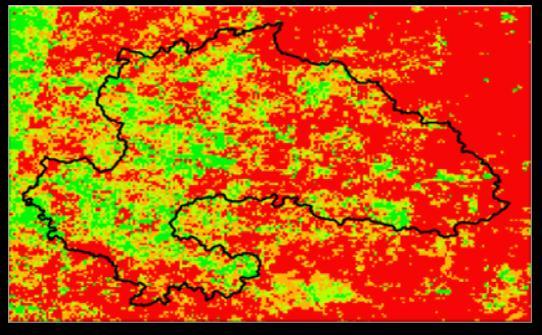
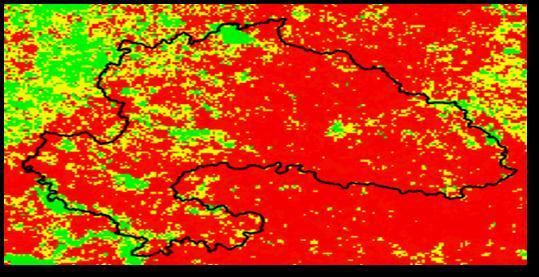
Thevegetationhealthindex(VHI)isoneofthemost popularsatellite basedindicesusedfordroughtmonitoring. TheVHIwasdevelopedforvegetationdroughtdetectionand is defined by two components: the Vegetation Condition Index(VCI)andtheThermalConditionIndex(TCI).Byusing VHIwecandirectpredictvegetationhealthbydoingsome band color correction in ArcGIS. Here VHI over Yavatmal District is calculated using Google Earth Engine Coder SoftwarebyusingthedatasetsofMODISEVIfromyear2001 2022providedbyunitedstatesgeologicalsurvey.
Chart 5:EVIoverYavatmalDistrict2006 2010
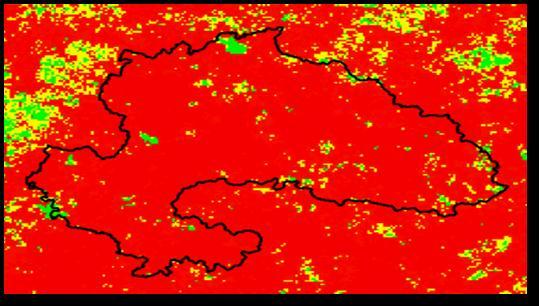
Fig -2:VHIoverYavatmalDistrict2003Drought 2.3.4 Calculation of SSM
SurfaceSoilMoisture(SSM)istherelativewater content of the top few centimeters soil (0 to 20 cm), describinghowwetordrythesoilisinitstopmostlayer.Itis
Volume: 09 Issue: 07 | July 2022 www.irjet.net p ISSN: 2395 0072 © 2022, IRJET | Impact Factor value: 7.529 | ISO 9001:2008 Certified Journal | Page942
International Research Journal of Engineering and Technology (IRJET) e ISSN: 2395 0056
Volume: 09 Issue: 07 | July 2022 www.irjet.net p ISSN: 2395 0072
measuredbySMAPsatelliteradarsensorsandallowsinsights inlocalprecipitationimpactsandsoilconditions.Itindirectly measurestheagriculturaldroughti.e.wateravailableinroot zone
Chart 8:SSMoverYavatmalDistrict2015 2022
2.3.4 Calculation of DSI
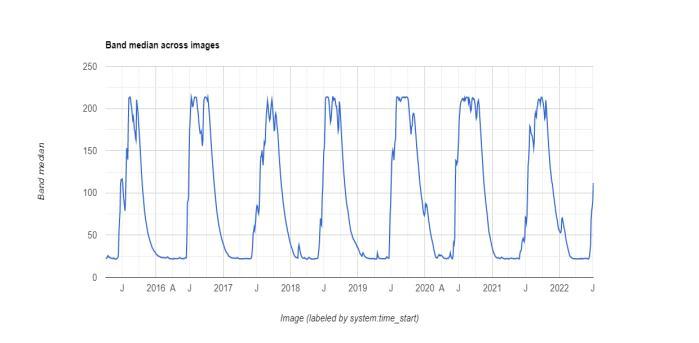
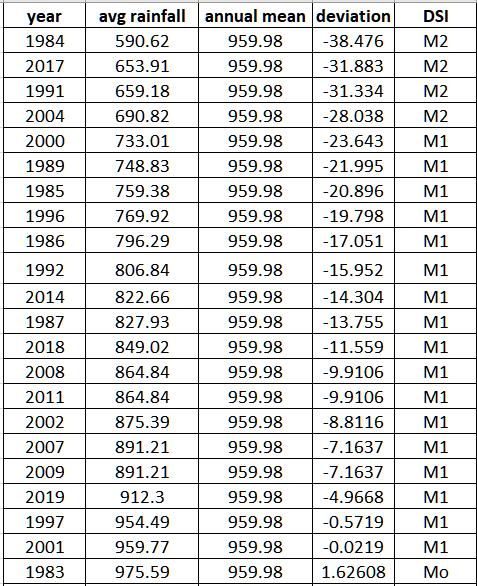
Chart 9:DSIusingdatasetofyear1981 2021
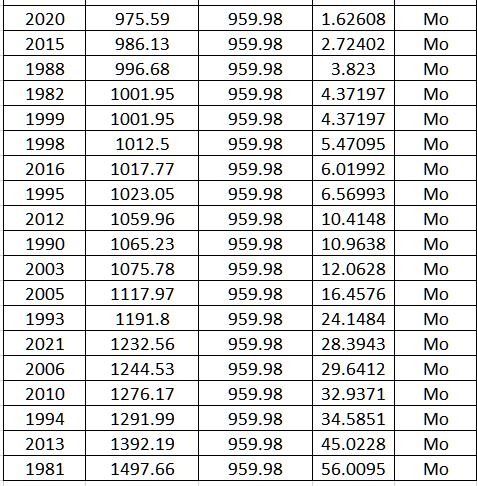
Drought severity index (DSI) is given by Indian meteorologicaldepartment(IMD)inthatdeviationofrainfall fromitsannalmeaniscalculated.Ifdeviationisgreaterthan +0%thenit’snodroughtcondition(Mo),ifitisbetween0to 25%thenitsmilddroughtcondition,whenitis 25%to 50%thenitsmoderatedroughtandfor 50%tolessthenits severe drought condition is there. It is totally based on rainfallcondition.
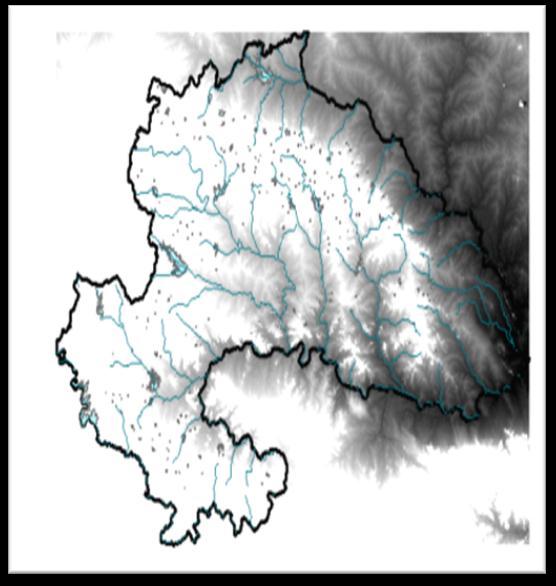
Fig 3 DEMandwaterbodiesofYavatmalDistrict
International Research Journal of Engineering and Technology (IRJET) e ISSN: 2395 0056
Volume: 09 Issue: 07 | July 2022 www.irjet.net p ISSN: 2395 0072
Temporal variation of Droughts can be easily identifiedwiththehelpofindicesSPI,EVI,VHI,SSMandDSI calculated in methodology. Some Major Droughts are mentioned bellow with percent deviation of rainfall of previousyearwhichcausesthedroughtinsubsequentyear.
Chart 11 %deviationofrainfallofyear2004
Fig 6 VHIofyear05.2005
Chart 10 %deviationofrainfallofyear2002
Chart –12 %deviationofrainfallofyear2009
Fig -5 VHIofyear05.2003
Fig 6 VHIofyear05.2010
International Research Journal of Engineering and Technology (IRJET) e ISSN: 2395 0056
Volume: 09 Issue: 07 | July 2022 www.irjet.net p ISSN: 2395 0072
drought but due to topographic and climatic condition Districtfacesfrequentdrought
Hence drought indices like Enhanced Vegetation Index(EVI), vegetationhealthindex(VHI)which isdefined by two components: the Vegetation Condition Index (VCI) and the Thermal Condition Index (TCI) considers both vegetationconditionandtemperatureconditionsshoulduse alongwiththeSPIandDSIwhichwillincreasetheprobability ofexactandeffectivedroughtprediction.
Chart 13 %deviationofrainfallofyear2018
[1] Shahzaman,M.;Zhu,W.;Bilal“RemoteSensingIndices forSpatialMonitoringofAgriculturalDroughtinSouth Asian Countries”. Remote sensing journal, MDPI Publications.May2021,Volume13,issue1,pp.34 36.
[2] Alahacoon, N.; Edirisinghe, M.; Ranagalage “ Satellite Based Meteorological and Agricultural Drought MonitoringforAgriculturalSustainabilityinSriLanka” SustainabilityJournal,MDPIPublications.March2021, Volume13,issue3,pp.23 24.
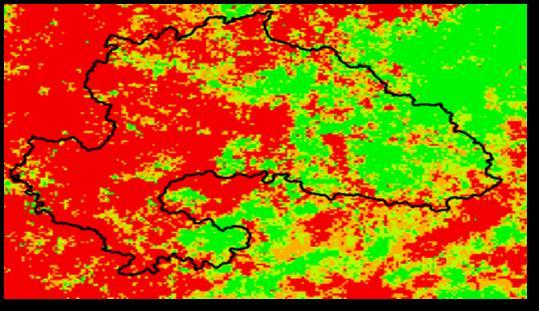
Here in VHI it is clearly proved that vegetation healthi.e.fromredtogreen,droughtprobabilitycondition varies as severe to no drought. The impact of negative deviation of rainfall of previous year directly affects the vegetationhealthinnextyear
ItwasseenfromresultthatmaximumvalueofEVI forYavatmalDistrictis0.83andminimumvalueis 0.47.As per water availability analysis Yavatmal District receives 959.98mmofaveragerainfalleachyearbutfromthedigital elevationmodelDEMtopographyofthedistrictissuchthat alltherainwaterflowsintotheriveranddrainsoutofstudy area.AccordingtoCGWB,78.4%ofthedistrictsdomesticand agriculture water requirement is met from groundwater sources, and the remaining21.6%is met bysurface water sources.TotalWaterrequirementofDistrictisonly14.267% of Total rainfall available. But Most of the district water demand is fulfilled by Ground Water Sources. Which are already5 16.2mbellowtheGroundlevelanddepletingday bydayanddistrictfacefrequentdroughtconditioninalmost 5timesadecade.
DroughtIndiceslikeSPIandDSIaretotallybasedon singletypeofdataseti.e.rainfalldatasetarenoteffectivein predicting rainfall. As per rainfall analysis of Yavatmal Districtwhichreceives959.98mmofaveragerainfalleach year,indiceslikeSPIandDSIdonotshowtheprobabilityof
[3] Abebe Sinamay, Solomon Addisu and K. V. Surya Bhagavan“Mappingthespatialandtemporalvariation ofagricultural andmeteorological drought using geospatialtechniques,Ethiopia”EnvironmentalSystems research,SpringeropenPublication,Feb2021,Volume 5,issue2,pp.45 47.
[4] A.K.Bhandaria,A.Kumara,andG.K.Singh. “Feature Extraction using Normalized Difference Vegetation Index (NDVI): a Case Study of Jabalpur City” 2nd InternationalConferenceonCommunication,Computing &Security[ICCCS 2012],pp.25 27.
[5] AnkitKumar,DerrickDenis,HimanshuMishra,Shashi Indwar.“ApplicationofNDVIinvegetationmonitoring anddroughtdetectionusingremotesensingforlower Rajghat canal command area.” International Research Journal of Engineering and Technology (IRJET) Jan 2019,Volume6,issue4,pp.36 39.
[6] Meera Gandhi. G, S. Parthiban, Nagaraj Thummalu Christy. “Vegetation change detection using remote sensing and GIS A case study of Vellore District.” International Conference on Recent Trends in Computing,2015,Volume3,issue1,pp.53 56.
[7] Sruthi.S,M.A.MohammedAslam.“AgriculturalDrought AnalysisUsingtheNDVIandLandSurfaceTemperature Data; a Case Study of Raichur District” International conference on water resources, coastal and ocean engineering(ICWRCOE2015),Volume4,issue2,pp.31 34.
International Research Journal of Engineering and Technology (IRJET) e ISSN: 2395 0056
[8] Simon Kloos, Ye Yuan, Mariapina Castelli and Annette Menzel. “Agricultural Drought Detection with MODIS BasedVegetationHealthIndicesinSoutheastGermany”
Remote Sensing Journal MDPI Publication, Sept 2021, Volume13,issue4,pp. 46 48.
[9] Harry West, Nevil Quinn, Michael Horswell. “Remote sensingfor drought monitoring &impactassessment: Progress, past challenges and future opportunities”
Remote sensing of environment journal, Elsevier Publication, 2019,Volume8,issue3,pp.48 50.
Volume: 09 Issue: 07 | July 2022 www.irjet.net p ISSN: 2395 0072 © 2022, IRJET | Impact Factor value: 7.529 | ISO 9001:2008 Certified Journal |