International Research Journal of Engineering and Technology (IRJET) e ISSN: 2395 0056

International Research Journal of Engineering and Technology (IRJET) e ISSN: 2395 0056
1Student, Dept. of Civil Engineering, Mar Athanasius College of Engineering, Kerala, India
2Professor, Dept. of Civil Engineering, Mar Athanasius College of Engineering, Kerala, India ***
Abstract A Dam break analysis is performed to model the flowoffloodwavesdownstreamofadamintheeventofadam break. It involves field data collection and computer simulationtoevaluatethe damfailure andthe impactofdam break on downstream area.
Studiesconductedtoanalyzethefloodzoningandinundation mapping of different dams such as Idukki, Hidkal, Pulichinathala[1] [3] etc., prove to be crucial for disaster managementintheeventofadambreach.Aftertheliterature review, we identified that Peringalkuthu Dam in Thrissur district hasn't been considered for such studies, despite being an aged dam (65+ years) whose safety has come under question during the August 2018 floods.
The aim of this project is to conduct a Dam Break Analysis of Peringalkuthu Dam using HEC RAS to find inundation maps showingdepth,velocityandwaterstageelevationintheevent of a dam breach. Input parameters like Design Flood Hydrograph, Manning's Roughness Coefficient, breach Parameters, and Elevation Storage relationship to draw results. The population under risk is also identified. Dam breach studies and inundation maps are important in preparing Emergency Action Plans and proper warning systems
Key Words: Dam breach, HEC RAS RAS (Hydrologic Engineering Centre’s River Analysis System), Disaster management, Flood zoning, Inundation mapping, 2D Unsteadyflow
Damsarebuiltforavarietyofreasons,includingelectricity generation, irrigation, and flood control. Despite all of the advantages, dam failure might result in massive losses by causing unforeseen floods in the downstream area. To mitigate these risks, dam break analysis is required to forecast inundation levels and flood prone zones in the Dam'sdownstreamarea.
The recent unpredictable rainfall (Oct 2020, Aug 2018) opened up discussions regarding the safety of this Dam. AccordingtotheKSEB,Peringalkuthuisadamwithastorage capacity of only 32 million cubic metres(MCM), while the upstreamdamsarehuge.TheUpperSholayarDam, Tamil Nadu, has a storage capacity of 153 MCM, while Lower Sholayar also has a similar storage capacity. The Parambikkulam Dam has a storage capacity of 505 MCM,
whilethemaximumstorageofThoonakkadavuis15MCM.If thesethreedamsareopened,thequantityofwaterreaching Peringalkuthu will be 3,882 cubic metres per second. The discharge capacity of Peringalkuthu is only 2,265 cubic metres per second, and the Dam will start overflowing within two hours. Heavy inflow from upstream dams will leadtoasituationsimilartothe2018mid Augustflood,and Chalakudywillbeinundatedwithinthreehours.Toensure the protection of life and property of people living in Chalakudy, Peringalkuthu Dam should be reviewed and studied.
This project involves conducting Dam Break Analysis for Peringalkuthu Dam, Thrissur. It covers the prediction of breach parameters and the Dam break model setup in general.ImplementationofDambreakanalysiscanbenefit thepeoplelivingdownstreamoftheDamagainstfloodswith the help of inundation maps which can be generated by incorporatingresultsfromdambreakanalysiswithGIS.
To perform dam break analysis of Peringalkuthu dam using HEC RAS (Hydrologic Engineering Center’s River Analysis System) software and preparation of flood inundationmap.
•Predictvelocity,flowdepthandwaterstageelevationof floodwavesintheeventofdamfailure.
• Predict peak of flood waves downstream between pointsofinterest,timeoftravelofpeakflood,andmaximum waterstageatpointofinterest.
• Predict dam break flood for planning purposes and controllingdownstreamdevelopment.
ThePeringalkuthureservoirwascreatedbybuildingadam over the Chalakudyriver in Kerala'sThrissurdistrict.The Dam's construction was completed in 1957. The Dam is a masonry gravity dam. The spillway has seven falling type gatesmeasuring11.58metresby5.94metreseachandfour sluicegatesmeasuring2.44metresby5.77metreseach.To generatehydropower,waterfromthereservoirisdiverted viaatunnel.Thetotalinstalledcapacityoftheprojectis48 MW.Theaverageannualgenerationofthepowerstationis
Volume: 09 Issue: 07 | July 2022 www.irjet.net p ISSN: 2395 0072 © 2022, IRJET | Impact Factor value: 7.529 | ISO 9001:2008 Certified Journal |
International Research Journal of Engineering and Technology (IRJET) e ISSN: 2395 0056
Volume: 09 Issue: 07 | July 2022 www.irjet.net p ISSN: 2395 0072
around 244 MU. The amount of water used to generate electricity is 36 cumec. When the reservoir's WL is at EL 422.40 m, a diversion to the Idamalayar reservoir with a dischargecapacityof39.43cumecsissupplied.Theoverall catchmentareaatthePeringalkuthudamsiteis1007sqkm, outofwhich512sq.kmisconsideredafreecatchment.
Using HEC RAS to perform 2D modelling or combined 2D modellingisverystraightforward.Thefollowingarethebasic stepsperformedin2DmodellingwithinHEC RAS[4]:
1.In HEC RASMappera Horizontal Coordinate Projection wascreated,usingaprojectionfilefromanESRIshapefile.
2.Aterrainmodel,whichisnecessaryfor2Dmodellingwas created. For executing any inundation mapping in RAS Mapper,aterrainmodelisneeded.
3.Addedanadditionalmappinglayer,forvisualization
4.Drewaboundarypolygonforeachofthe2DFlowAreasto be modelled in the HEC RAS Mapper. Created the 2D computationalmeshforeach2DFlowAreausingthe2DFlow Areaeditor.
5.UsingtheSA/2DAreaHydraulicConnectionfeature,added internal hydraulic structures, a dam as the connection betweenthe2DflowareaandtheStorageArea.
6. Connected the 2DFlow Areas to 1D Hydraulic elements (StorageArea)
7. Drew external boundary condition lines along the perimeter of the 2D flow areas using the Geometric Data editor.
8.Filledalloftheboundaryandinitialconditiondataforthe 2DflowareasintheUnsteadyFlowdataeditor.Setnecessary computationalchoicesandsettingsforthe2Dflowareasin theUnsteadyFlowSimulationwindow.
9.Ranthesimulationofunsteadyflow.
10.OutputistakenasmaplayersincludingDepth,velocity, andwatersurfaceelevation.
11.Foundaffectedareasandinundationareaisfound
12.Populationofmostaffectedareasisfound
13.Rehabilitation cost is calculated based on the previous dataavailable.
Itisimportanttoknowanelevation storagerelationship forthereservoirinordertoanticipatethefloodhydrograph. TheinputdatareceivedfromDamSafetyAuthority,Pallom, andKottayamisshownin Table 1.Thestorageelevation curvecanbedrawnfromthedata.
Table 1: Storage ElevationData
Storage Elevation
399.4 0 401.73 230 404.77 1100 407.82 2720 410.87 5470 413.92 9490 416.97 14730 420.01 21410 423.06 29420 423.98 32000
Digital Elevation Model was created by obtaining a shapefileoftheinterestedareafromGoogleEarthPro.The shapefilewasuploadedintoUSGSEarthExplorerinorderto obtain the Digital Elevation Model of the proposed river basin.TheDEMwasinputintothesoftwaretogettheterrain featuresandStorage Elevationrelationship.
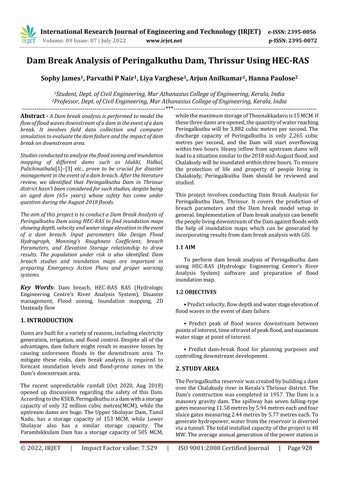
The construction of a concrete gravity dam involves a number of concrete monoliths Peringalkuthu being a concrete dam, USACE suggests using an average breach widthofmultiplemonoliths(2007),whileFERC(1988)and NWS(Fread,2006)suggestusinganaveragebreachwidthof less than or equal to half of the entire length of the Dam. USACE,FERC,andNWSallsuggestusinga vertical breach sideslopesincemonolithsaretypicallyrectangularinshape and therefore have vertical sides. Figure 1 illustrates the monolith failure width (B), the breach depth (H), and the verticalsideslopeof0:1(Fig 1)[5].Therangeofpossible failure times for modelling purposes is 0.1 hours to 0.5 hours.
International Research Journal of Engineering and Technology (IRJET) e ISSN: 2395 0056
Volume: 09 Issue: 07 | July 2022 www.irjet.net p ISSN: 2395 0072
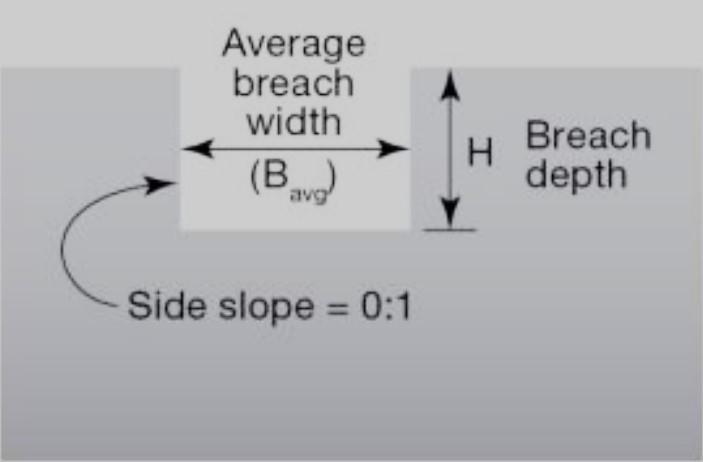
Fig 1:BreachmechanismofaconcretedamfromFEMA Guidelines[5]
Therearefourtypesofexternalboundaryconditionsthat can be linked directly to the boundary of 2D Flow Areas; theseare:
• FlowHydrograph
• StageHydrograph
• NormalDepth
• RatingCurve
Flood inundated areas in the event of a breach of Peringalkuthu Dam were considered and maps showing Depth,velocityandwaterstageelevationatvariousaffected areas were obtained. Time plot series for any point downstream of the dam for the above mentioned parameters was also obtained incorporating results from dambreakanalysiswithGIS.
The maximum depth of water is around 15 18 m representedinthemapindarkbluecolorandisobservedin theimmediatedownstreamoftheDamaswellasinother areas further downstream, as shown (Fig 2) in the inundationmap.
Fig 2:Depthmaplayer
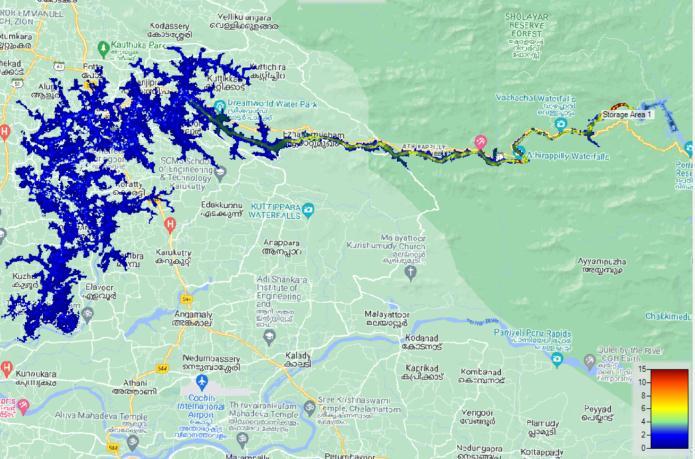
Velocityvariesfrom10 15m/s,andmaximumvelocityis observedattheimmediatedownstreamoftheriverreach, whichisshowninred.Velocityreducesaswemovefurther downstreamwiththelowervelocitiesrepresentedbyblue (Fig 3).
Fig -3:Velocitymaplayer
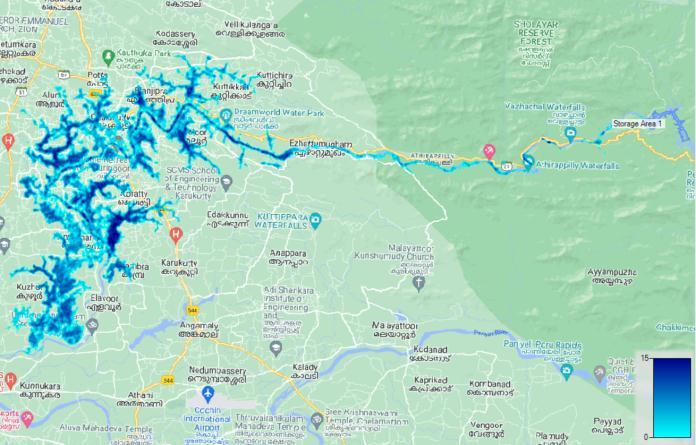
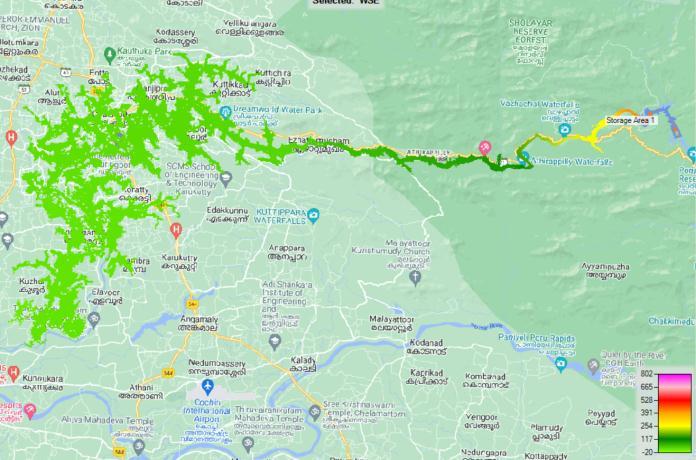
Themaximumobservedwaterstageelevationof412mis observed at the immediate downstream of the Dam, represented by orange (Fig 4). The WSE reduces further downstream.
International Research Journal of Engineering and Technology (IRJET) e ISSN: 2395 0056
Table -3: Area Populationtable
Area Population
Fig 4:Watersurfaceelevationmaplayer
5.4 OBSERVATION
Table 2: Resulttable
Places most affected Depth max m) Velocity max(m/s)
Poringalkuthu 44.96 15.93 Athirappilly 8.17 2.96 Konnakuzhi 13.45 0.5 Kuttikkadu 10.37 0.38 Melur 16.32 0.62 Elanjipra 16.8 0.87 Potta 11.36 0.11 Chalakkudi 12.41 1.17 Mampra 11.56 0.29 Valoor 18.22 0.30 Muringoor 15.01 0.5 Aloor 11.55 0.26 Kottatt 13.76 0.41 Koratti 17.43 0.26 Thruthiparambu 16.91 1.6 Annalloor 22.28 0.25 Cheruvaloor 18.12 0.23 Vynthala 12.26 0.33 Annamanada 8.59 0.19
TotalAreaunderrisk:160squarekm.
Chalakudy 49525 Melur 22678 Annamanada 1925 Potta 17876 Elanjipra 3883 Koratty 17463 Muringoor 6683 Annalloor 6254 Athirappilly 9216
TotalPopulationunderrisk:196503
Thepopulation ofthevillagesaforementionedisobtained fromtheinternet.Averageno.ofpeopleinatypicalfamilyin Keralaisassumedtobe4.Therefore,thetotalno.offamilies affectedis49,125.Basedonthehistoryoffloodinundation, thecompensationgiventoeachfamilyforland,construction andinfrastructureis5lakhsbythegovernment.Therefore, the total cost for rehabilitation comes up to 2000 crore rupees. Thus, periodic inspection must be done in major damssituatedinhazard proneareasin ordertoavoidsuch occurrences. However, the value of the emotional and psychological damages caused to people living near dam sitesisimmeasurable.Unsteadyflow
HEC RAS is an updated software which gives the flood inundationmapofapotentialdambreach.Italsofacilitates routingtheresultantfloodthroughdownstreamvalleysto getthetimeseriesofdischargeandwaterlevelatdifferent locations of the valley. For the purpose of this analysis, overtoppingmodeoffailureofthestructureisconsidered.
The parameters of breach selected based on already establishedresearchisreasonableforthedambreakflood generation.Thedepthofflowatdifferentlocationswithin theriverreachof50.1km,variesfrom66.91m(justbelow Peringalkuthudamsite)to0.61mattheendofthereach. Thetotalareaofinundationis160squarekilometres.The detailsofwatersurfaceelevationsandvelocityofmaximum flowatdifferentlocationsofthevalleygivesanideaabout theextentofflooding.Theauthoritiesshouldgivesufficient warnings to the downstream inhabitants as it is observed thatabout1,90,000inhabitantsareatrisk.
Volume: 09 Issue: 07 | July 2022 www.irjet.net p ISSN: 2395 0072 © 2022, IRJET | Impact Factor value: 7.529 | ISO 9001:2008 Certified Journal |
[1] G. Vijayaraj, R. T. V, and A. Professor, “Dam Break Analysis of Idukki Dam using HEC RAS,” International Research Journal of Engineering and Technology,2017,[Online].Available:www.irjet.net
[2] A. Bharath, A. v Shivapur, C. G. Hiremath, and R. Maddamsetty,“DambreakanalysisusingHEC RAS and HEC GeoRAS: A case study of Hidkal dam, Karnataka state, India,” Environmental Challenges, vol. 5, p. 100401, Dec. 2021, doi: 10.1016/j.envc.2021.100401.
[3] M.Ramola,P.C.Nayak,andV.Basappa,“DamBreak Analysis using HEC RAS and Flood Inundation ModellingforPulichinatalaDaminAndhraPradesh, India Impact of LU/LC and catchment characteristics on Runoff and Groundwater DynamicsofWesternGhats,KarnatakaViewproject Spatio Temporal Variation of Drought Characteristics in Bearma Basin of Bundelkhand RegioninMadhyaPradeshViewproject.”[Online]. Available: https://www.researchgate.net/publication/350995 254
[4] “HEC RASRiverAnalysisSystemHEC RAS2DUser’s Manual.”
[5] Fema,“FedearlGuidelinesforInundationMapping ofFloodRisksAssociatedwithDamIncidentsand Failures,FirstEdition,FEMAP 946/July2013.”
International Research Journal of Engineering and Technology (IRJET) e ISSN: 2395 0056 Volume: 09 Issue: 07 | July 2022 www.irjet.net p ISSN: 2395 0072 © 2022, IRJET | Impact Factor value: 7.529 | ISO 9001:2008 Certified Journal | Page932