International Research Journal of Engineering and Technology (IRJET) e ISSN: 2395 0056

Volume: 09 Issue: 07 | July 2022 www.irjet.net p ISSN: 2395 0072
International Research Journal of Engineering and Technology (IRJET) e ISSN: 2395 0056
Volume: 09 Issue: 07 | July 2022 www.irjet.net p ISSN: 2395 0072
1 ,
Jadhav M.L.2
1Post Graduate Student, Department of Mechanical Engineering, Deogiri College of Engineering and Management Studies, Aurangabad, Maharashtra, India 2Professor, Department of Mechanical Engineering, Deogiri College of Engineering and Management Studies, Aurangabad, Maharashtra, India ***
Abstract - The present study is carried for the optimization of the process parameters in order to reduce the monthly In House Rejection Rate and for quality and enhancement of production thereby minimizing the consumer complaints. For the enhancement of the final product correlation of the effect of process parameters on SAE8620 was carried out. Taguchi methodology was adopted for the optimization. Analysis was repeated thrice for three different output parameters namely, surface roughness, internal diameter shift and internal diameter oversize. From the output cutting speed is observed as the major input parameter as compared to the other two parameters i.e. feed and depth of cut. In case of internal diameter shift number of passes had major contribution whereas in case of internal diameter oversize feed is the dominant parameter. The optimum levels were independently determined with reference to the output parameters.
Key Words: SAE8620, Optimization, In house rejection, Honing,Milling,TaguchiMethod
Intheworldofmanufacturingindustries,productionplaysa majorroleformingitasoneofthekeymeasuresofsuccess. Secondly, efficiency is one of the factors which come into account for maximizing output from optimum input. However, for finding a balance between production and efficiency investigation in the improvement of process parameters of any material may lead to gain higher profit withsuccessfuloutcomefortheindustries.Also,thereisa needforselectionofappropriatetoolsalongwith optimal machiningconditionsfordimensionalaccuracyandsurface finishofthematerial.Inordertoreducetherejectionrateof the material various machining operations can be done. Statisticalexperimentationcanbedoneforthevalidationof theresults.
InthestudyofRajenderKumaretal[1]adoptionofTaguchi Methodforrejectioncostofflexiblehoseassembly.ANOVA technique was used to analyze the results of orthogonal array experiment for determination of major influencing factor. The contribution of all the factors related for characterization of general trends was obtained. It
concludedthatimprovedqualitywithcostreductioncanbe obtained from Taguchi Method. S. Tariq et al [2] high pressure dia casting production process of an automotive industrywith7AIwascarriedoutforoptimumcombination ofprocessparametersinordertomaximizeproductivityof the process and minimize casting defects. Design of Experiment(DOE)approachwascarriedoutwhichhelpedin cost saving. R. Nivedha et al [3] six sigma DMAIC phases technique was adopted for experimentation on wheel cylinder to improve the rejection rate of manufacturing industry. With the Process flow, Pareto diagram and Fish bonediagramthedeterminationofcriticalfactorsrequired for controlling and improving the expected zero rate rejectionwasdone.Pimpalgaonkaretal[4]optimizationof processparametersonhoningmachinewascarriedoutby usingTaguchiMethodforoptimization.Theoutputreveled thatstrokepressurehasgreatesteffectonMaterialRemoval Rate (MRR) whereas feed pressure has greatest effect on surfaceroughness.Shahadathasanetal[5]Optimizationof processparametersonEN8steelwascarriedoutwiththe helpofmillingmachineoperation.Theoutputreveledthat S/N ratio is useful in deriving optimum conditions and ANOVA technique is useful for defining the level of importanceofvariousparametersonmaterialremovalrate andsurfaceroughness.
SAE8620 (FORK) SAE8620 is a low carbon alloy steel havinghardenability,toughnessandwereresistancesurface rendering it extensively useful for all industrial sectors havingautomotivepartsnamely,shafts,crankshafts,gears andgearings.
Honing Machine - Honingisamethodofinternalgrinding used to achieve precise geometry and surface finish for a particularmetalworkpiece.
Milling Machine Millingisamethodofmachiningwhich usesrotarycuttersfortheremovalofmaterialbyadvancing cutterintoaworkpiece.
Hole Mill Cutter A Hole mill is normally an undersized reamerwithaboringgeometryi.e.thesizeofthehole millis normally0.2 0.6mmmorethanthesizeofthedrillsothat
International Research Journal of Engineering and Technology (IRJET) e ISSN: 2395 0056
there are no drill marks on the hole plus the hole axis is correctedforsubsequentreamingoperation.
Inthepresentstudy,themajorinput(process)parameters namelyworkspeed,feedrate,depthofcutandnumberof passesinfluencetheoutput(response)parametersnamely surfaceroughness,internaldiametershift,internaldiameter oversizeofaworkpieceareconsidered
To conduct this research, an automotive company was selectedwhichhasbeenmanufacturingvariousautomotive parts from last 25 years. The company was consistently facingproblemofpartrejectionatmachiningstageoftheir productionline.Toidentifytheproblemcauseeffectstudy wasdoneandfromtheobservationsitwasidentifiedthat internal diameter shift, internal diameter oversize and surfaceroughnesswerethemajorcauseofpartrejection.To propose a solution for the same statistical analysis using Taguchimethodhasbeencarriedout.
Taguchi Method TaguchiMethodofqualitycontrolisan optimisticapproachthatemphasizestheroleofresearchand developmentindesignandprocessparametersresultingin reduction of defects and failures in manufactured goods. Stepsperformedareasfollows:
1. Selectionofresponse(variables)parameters.
2. Identification and selection of input (variables) parameters.
3. Assigning of levels for the factors. Conduction of experiment.
4. AnalyzingthedataforS/NratioandANOVA.
5. Defineoptimumlevelsofprocessparameters.
6. Validationofresults.
Inputparametersandtheirlevels
Process Parameter’s
CuttingSpeed(Rpm) 350 650 950 FeedRate(mm/rev) 50 80 120 DepthofCut(mm) 0.25 0.50 1.0
Designofexperiments(DOE)forselectedinputparameters experiments are designed using Taguchi L9 orthogonal standardarray.ForthispurposesoftwareMinitab17isused
Sr.No Speed (Rpm ) Feed (mm/Rev) Depth of Cut (mm )
1 350 50 0.25 2 350 80 0.5 3 350 120 1 4 650 50 0.25 5 650 80 0.5 6 650 120 1 7 950 50 0.25 8 950 80 0.5 9 950 120 1
Afterdesignofexperiment,9experimentsarecarriedoutin vertical milling Machine. After each experiment surface roughnessiscalculated.Aqualitycharacteristicforsurface roughnessis“Smalleristhebetter”.
Job No Speed (Rpm ) Feed (mm/Rev) Depth of Cut (mm ) Surface Finish ( Ra)
1 350 50 0.25 1.25 2 350 80 0.5 1.53 3 350 120 1 1.96 4 650 50 0.25 2.62 5 650 80 0.5 2.34 6 650 120 1 3.26 7 950 50 0.25 4.02 8 950 80 0.5 3.54 9 950 120 1 4.35
4.1.2:
The Taguchi method can be used to determine the experimental condition having the least variability as the optimal condition. This variability can be expressed by signal to noise ratio (S/N ratio, denoted by η). The experimentalconditionthathasthemaximumS/Nratio is
Volume: 09 Issue: 07 | July 2022 www.irjet.net p ISSN: 2395 0072 © 2022, IRJET | Impact Factor value: 7.529 | ISO 9001:2008 Certified Journal | Page682
International Research Journal of Engineering and Technology (IRJET) e ISSN: 2395 0056
consideredastheoptimalconditionbecausethevariability ofthecharacteristicsisinverselyproportionaltoS/Nratio [6].Theexperimentswereconductedatrandomasperthe principlesofdesignofexperiments.Theobjectivefunction describedinthisinvestigationisfindingofsmallerSurface FinishValues.So,theS/Nratioswerecalculatedusingthe “Smallerthebetter”approach.
Cutting Speed Feed Rate DOC Surface Finish SNRA MEAN
350 50 0.25 1.25 1.938 1.25
350 80 0.5 1.53 3.694 1.53
350 120 1 1.96 5.845 1.96
650 50 0.5 2.62 8.366 2.62
650 80 1 2.34 7.384 2.34
650 120 0.25 3.26 10.264 3.26
950 50 1 4.02 12.085 4.02
950 80 0.25 3.54 10.980 3.54
950 120 0.5 4.35 12.770 4.35
Table 1.4: Results Table of Surface Finish
Theanalysisofvariance(ANOVA)givesaclearpictureofthe extenttowhichaparticularprocessparameteraffectsthe response.HenceANOVAwasusedtostatisticallydistinguish thesignificantfactorsfrominsignificantones.TheANOVA formeansofsurfaceRoughnessandareshowninTable
Source DO F SS MS F P % Contrib ution
Speed 2 8.57 06 4.285 3 60.96 0.016 89.2491 9296
Feed 2 0.85 76 0.428 8 6.1 0.141 8.93054 2539
DOC 2 0.03 42 0.017 1 0.24 0.804 0.35613 8707
Residua lError 2 0.14 06 0.070 3
Total 8 9.60 3
Table 1.6: ANNOVA Table for Means of (Ra Values)
F Testwascarriedoutforcheckingthesignificanceofthe process parameters. It was found out that Speed having contributionof89.29%wasthemostsignificantparameters. Whileothertwofactors wereinsignificant.
AfterdoingtheANOVAinMinitab15thevalueofR2&R2 (Adj)areobtained,theyareasfollows,
S=0.2651,R2=98.54.0%,R2(Adj)=94.14%
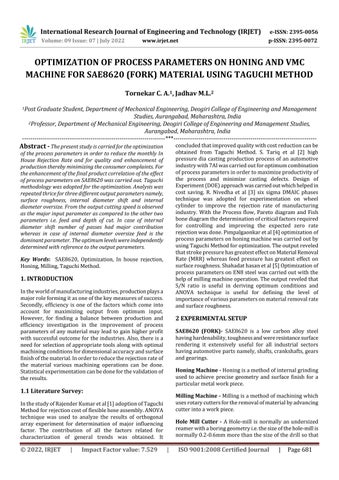
Graph1.1: Effect of Signal to Noise Ratio
Level Speed Feed DOC
1 3.826 7.463 7.728
2 8.672 7.353 8.277
3 11.945 9.626 8.438
Table 1.5: Response Table of Signal to Noise Ratios
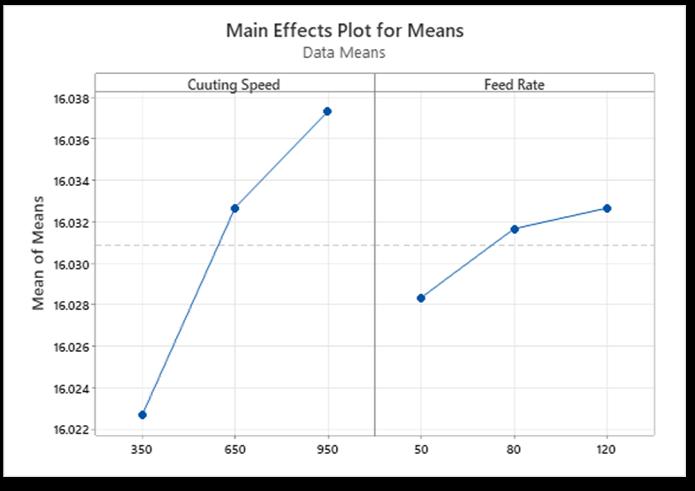
To get better Surface finish the optimal parameters are SpindleSpeedat350rpm,feedat80mm/rev&depthofcut at0.25
Inaddition,anumericalmodelbydesignexpert hasbeendevelopedandtheanalysisofvariance(ANOVA)by design expert is presented inTable. The R2coefficient indicatesthegoodnessoffitforthemodel.Inthiscase,the valueofthecoefficient(R2=0.99854)indicatesthat98.54% of the total variability is explained by the model after consideringthesignificantfactors..Thedifferencebetween R2&R2(Adj)was3.2%anditshowsthatpresenceofless numberofinsignificantfactorsinthemodel.Effectswiththe valueofPislessthan0.05sothataresignificant95%
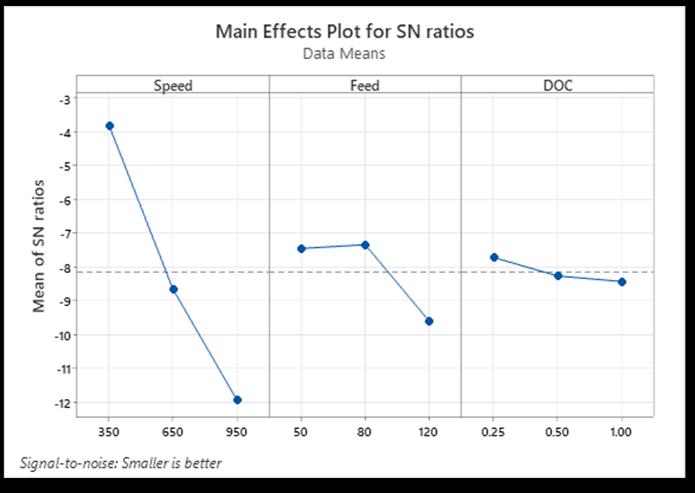
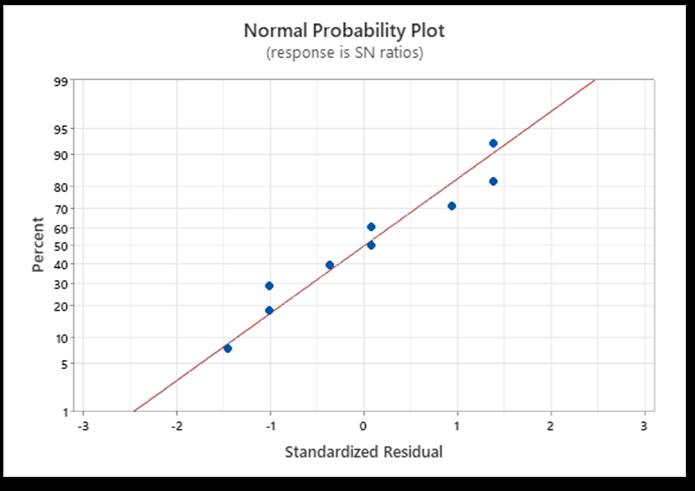
Graphicaltoolscanbeusedforvalidationofthemodels.The graphicalmethodcharacterizesthenatureofresidualsofthe models. Graph 1.2 shows the residual plots for Ra. In the normalprobabilityplotoftheresidualsshowningraph1.2 the data were plotted against a theoretical normal distribution in such a way that the points should form an approximatestraightline,andadeparturefromthisstraight linewouldindicateadeparturefromanormaldistribution,
Volume: 09 Issue: 07 | July 2022 www.irjet.net p ISSN: 2395 0072 © 2022, IRJET | Impact Factor value: 7.529 | ISO 9001:2008 Certified Journal | Page683
International Research Journal of Engineering and Technology (IRJET) e ISSN: 2395 0056
whichwasusedtocheck thenormalitydistributionofthe residuals. In graph 1.2 the first residual plot is Normal Probability plot, it shows all the points are close to the straightlinewhichmeansresidualsarenormallydistributed.
Afterdesignofexperiment,9experimentsarecarriedoutin verticalmillingMachine.AftereachexperimentI.DShiftis calculated.AqualitycharacteristicforI.DShift is“Smalleris thebetter”.
Job No Speed (Rpm ) Feed (mm/Rev) Depth of Cut (mm) I.D Shift
1 350 50 1 0.005
2 350 80 2 0.010
3 350 120 3 0.014
4 650 50 2 0.011
5 650 80 3 0.016
6 650 120 1 0.008
Graph No. 1.2: Residual Plots for Ra Value
4.2) I.D Shift: Inputparametersandtheirlevels
Process Parameter’s LEVEL 1 LEVEL 2 LEVEL 3
CuttingSpeed(Rpm) 350 650 950 FeedRate(mm/rev) 50 80 120 NoofPasses 1 2 3
Table 2.1: Experiment Process Parameters
Designofexperiments(DOE)forselectedinputparameters experiments are designed using Taguchi L9 orthogonal standardarray.ForthispurposesoftwareMinitab17isused
Job No Speed (Rpm ) Feed (mm/Rev) Depth of Cut (mm ) 1 350 50 1 2 350 80 2 3 350 120 3 4 650 50 2 5 650 80 3 6 650 120 1 7 950 50 3 8 950 80 1 9 950 120 2
Table 2.2: Experiment Process Parameters
7 950 50 3 0.015 8 950 80 1 0.009 9 950 120 2 0.013
Table 2.3: I.D Shift Values against Input process Parameter’s
4.2.2 Results and Discussions
Cutting Speed Feed Rate No of Passes I.D shift SNRA1 MEAN 1
350 50 1 0.005 46.021 0.005
350 80 2 0.010 40.000 0.01
350 120 3 0.014 37.077 0.014
650 50 2 0.011 39.172 0.011
650 80 3 0.016 35.918 0.016
650 120 1 0.008 41.938 0.008
950 50 3 0.015 36.478 0.015
950 80 1 0.009 40.915 0.009 950 120 2 0.013 37.721 0.013
Table 2.4: Results Table of I.D Shift Values
Volume: 09 Issue: 07 | July 2022 www.irjet.net p ISSN: 2395 0072 © 2022, IRJET | Impact Factor value: 7.529 | ISO 9001:2008 Certified Journal | Page684
International Research Journal of Engineering and Technology (IRJET) e ISSN: 2395 0056
Volume: 09 Issue: 07 | July 2022 www.irjet.net p ISSN: 2395 0072
F Testwascarriedoutforcheckingthesignificanceofthe process parameters. It was found out that Speed having contribution of 894.64% was the most significant parameters.Whileothertwofactors wereinsignificant.
AfterdoingtheANOVAinMinitab15thevalueofR2&R2 (Adj)areobtained,theyareasfollows,
S=0.7201,R2=98.73%,R2(Adj)=94.93%
The difference between R2 & R2 (Adj) was 3.2 % and it showsthatpresenceoflessnumberofinsignificantfactorsin themodel.EffectswiththevalueofPislessthan0.05sothat aresignificant95%
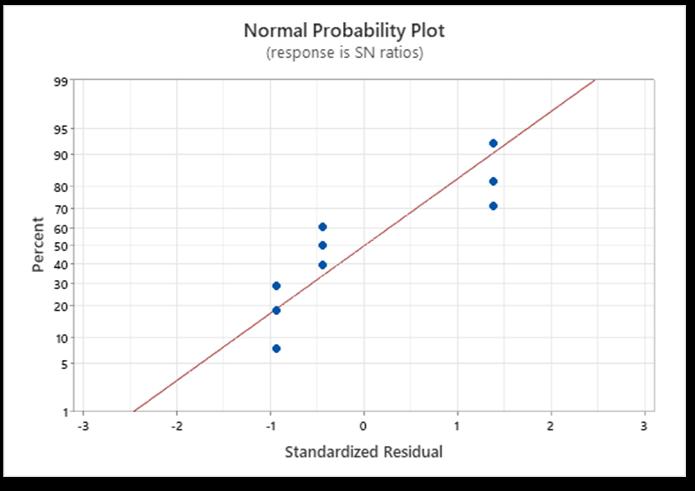
Graph 2.1: Effect of Signal to Noise Ratio
Level Speed Feed No of Passes
1 41.03 40.56 42.96 2 39.01 38.94 38.96 3 38.37 38.91 36.49 Delta 2.66 1.64 6.47 Rank 2 3 1
Table 2.5: Response Table of Signal to Noise Ratios
TogetminimizeI.DShift theoptimalparametersareSpindle Speedat950rpm,feedat80mm/rev&NoofPass1.
Theanalysisofvariance(ANOVA)givesaclearpictureofthe extenttowhichaparticularprocessparameteraffectsthe response.HenceANOVAwasusedtostatisticallydistinguish thesignificantfactorsfrominsignificantones.TheANOVA formeansofsurfaceRoughnessandareshowninTable
4.2.4
Ingraph2.2thefirstresidualplotisNormalProbabilityplot, it shows all the points are close to the straight line which meansresidualsarenormallydistributed.
Source D O F
SS MS F P % Contribu tion Speed 2 0.000 012 0.000 006 52 0.019 11.53846 15 Feed 2 0.000 004 0.000 002 16 0.059 3.846153 85
Noof Passes 2 0.000 088 0.000 044 39 7 0.003 84.61538 46 Residual Error 2 0 0
Total 8 0.000 104
Table 2.6: ANOVA Table for Means of (I.D Shift)
4.3) I.D Over Size: Inputparametersandtheirlevels Process Parameter’s LEVEL 1 LEVEL 2 LEVEL 3 CuttingSpeed(Rpm) 350 650 950 FeedRate(mm/rev) 50 80 120
Designofexperiments(DOE)forselectedinputparameters experiments are designed using Taguchi L9 orthogonal standardarray.ForthispurposesoftwareMinitab17isused.
Job No Speed (Rpm ) Feed (mm/Rev) 1 350 50 2 350 80 3 350 120 4 650 50
International Research Journal of Engineering and Technology (IRJET) e ISSN: 2395 0056
5 650 80 6 650 120 7 950 50 8 950 80 9 950 120
Table 3.2: Experiment Process Parameters
Afterdesignofexperiment,9experimentsarecarriedoutin verticalmillingMachine.AftereachexperimentI.DOver Size is calculated. A quality characteristic for I.D Over Size is “Smalleristhebetter”.
Job No Speed (Rpm ) Feed (mm/Rev) I.D OverSize
1 350 50 16.020
2 350 80 16.025
3 350 120 16.023 4 650 50 16.028
5 650 80 16.034 6 650 120 16.036
7 950 50 16.037 8 950 80 16.036 9 950 120 16.039
Table 3.3: I.D O/S Values against Input process Parameter’s
Cutting Speed Feed Rate Internal Dia oversize
SNRA MEAN
Graph
Level Speed Feed
1 24.09 24.10 2 24.10 24.11 3 24.10 24.11 Delta 0.01 0 Rank 1 2
Table 3.5: Response Table of Signal to Noise Ratios
Toget minimizeI.D Over Sizethe optimal parametersare SpindleSpeedat350rpm,feedat80mm/rev.
4.3.3. Analysis of Variance (ANOVA)
Theanalysisofvariance(ANOVA)givesaclearpictureofthe extenttowhichaparticularprocessparameteraffectsthe response.HenceANOVAwasusedtostatisticallydistinguish thesignificantfactorsfrominsignificantones.TheANOVA formeansofsurfaceRoughnessandareshowninTable.
350 50 16.02 24.093 16.02
350 80 16.025 24.096 16.025
350 120 16.023 24.095 16.023
650 50 16.028 24.098 16.028
650 80 16.034 24.101 16.034
650 120 16.036 24.102 16.036
950 50 16.037 24.102 16.037
950 80 16.036 24.102 16.036
950 120 16.039 24.104 16.039
Table 3.4: Results Table of I.D over Size
Source D O F
SS MS F P % Contribu tion Speed 2 0.0003 37 0.0001 68 31.9 2 0.00 3 86.63239 07 Feed 2 0.0000 31 0.0000 15 2.93 0.16 5 7.969151 67 Residua lError 4 0.0000 21 0.0000 05 Total 8 0.0003 89
Table 3.6: ANNOVA Table for Means of (I.D over Size)
F Testwascarriedoutforcheckingthesignificanceofthe process parameters. It was found out that Speed having contributionof86.63%wasthemostsignificantparameters. Whileotherfactorswereinsignificant.
Volume: 09 Issue: 07 | July 2022 www.irjet.net p ISSN: 2395 0072 © 2022, IRJET | Impact Factor value: 7.529 | ISO 9001:2008 Certified Journal | Page686
International Research Journal of Engineering and Technology (IRJET) e ISSN: 2395 0056
Volume: 09 Issue: 07 | July 2022 www.irjet.net p ISSN: 2395 0072
AfterdoingtheANOVAinMinitab15thevalueofR2&R2 (Adj)areobtained,theyareasfollows,
S=0.023,R2=94.75%,R2(Adj)=89.14%
The difference between R2 & R2 (Adj) was 5.61 % and it showsthatpresenceoflessnumberofinsignificantfactorsin themodel.EffectswiththevalueofPislessthan0.05sothat aresignificant95%
5. ThesehelpedtominimizethecustomerComplaints, to minimize the defects, to maximize the productivity andforsmoothprocessFlow.
1. 1.RajenderKumar,Dr.D.R.Prajapati,SukhrajSingh. Implementationoftaguchimethodologyfordefect reductioninmanufacturingindustry"acasestudy" (2011), International Journal of Industrial EngineeringResearchandDevelopment(IJIERD).
2. 2.S. Tariqa, A. Tariqa’, M. Masudb, and Z. Rehmanc. Minimizing the casting defects in high pressurediecastingusingTaguchianalysis.(2022), ScientiaIranicaB.
3. 3.R. Nivedha, E. Subash, V. Venkadesh, S. Vignesh andP.Vinothkumar,S.Nallusamy.Minimizationof RejectionRateusingLeanSixSigmaToolinMedium ScaleManufacturingIndustry.2018,International JournalofMechanicalEngineeringandTechnology (IJMET).
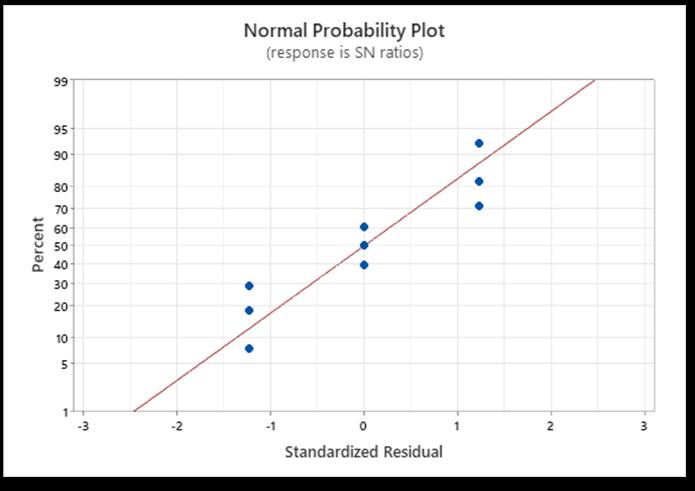
Ingraph3.2thefirstresidualplotisNormalProbabilityplot, it shows all the points are close to the straight line which meansresidualsarenormallydistribute
1. TheLevelsoftheparameterswereoptimizedwith RespecttoSurfaceFinish,I.DShift&I.Doversize.
2. ANOVA Predicted that the Cutting Speed contributes dominantly among other two factors towards surface Roughness (Ra). It was inferred from Taguchi Analysis that to get better Surface finishtheoptimalparametersareSpindleSpeedat 350rpm,feedat80mm/rev&depthofcutat0.25.
3. InCaseofI.Dshiftvalues,ANOVAPredictedthatNo. ofPassesofHoningToolcontributedsignificantly compared to the other two parameters It was inferred from Taguchi Analysis that to get better Surfacefinish theoptimal parametersare Spindle Speedat950rpm,feedat80mm/rev&NoofPass 1.
4. InCaseofI.DOversizevalues,ANOVAPredictedthat CuttingSpeedcontributedsignificantlycomparedto theFeed.
4. 4.1Pimpalgaonkar M.H., 2Ghuge Ranjesh Laxmanrao,3AdeSantoshLaxmanrao.Areviewof optimization process parameters on honing machine.2013,InternationalJournalofMechanical andProductionEngineering.
5. 5.1Shahadat hasan, 2Mohd Saif. Optimization of verticalmillingmachineprocessparametersofEN8 steelforMRRUsingTaguchiMethod.2020,Journal OfImergingTechnologiesandInovativeResearch.
2022, IRJET | Impact Factor value: 7.529 | ISO 9001:2008 Certified Journal