International Research Journal of Engineering and Technology (IRJET) e-ISSN: 2395-0056

Volume: 09 Issue: 07 | July 2022 www.irjet.net p-ISSN: 2395-0072
Hybrid Renewable Energy System
***
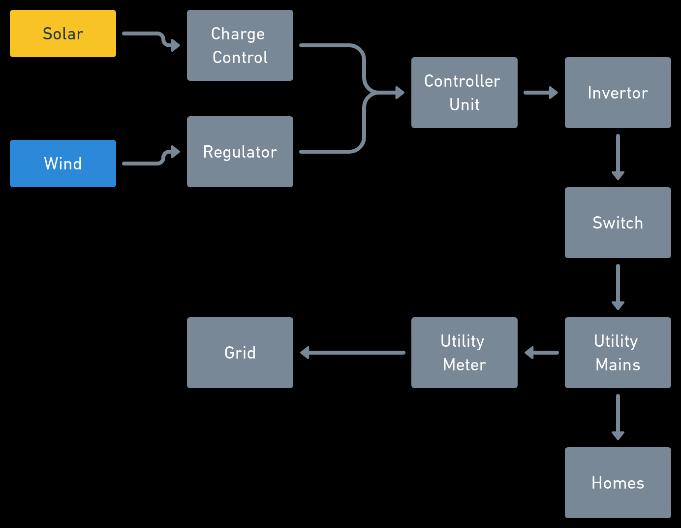
ABSTRACT: Power demand is on the rise for some time now and with climate change, depleting fossil fuels and increasing global warming the use of renewable energy sources, like solar, wind, geothermal, ocean etc., to meet the escalating power demand in a sustainable, cost effective, and environment friendly way is inevitable. However, the stability and availability of a single renewable source is not guaranteed.
Combination of different sources making a hybrid renewable system are now being explored to overcome this problem. Wind turbine system combined with solar photovoltaic (PV), as a hybrid system, can play a significant role to overcome our future energy demands with a cost effective energy system. This paper presents a hybrid system that uses both solar as well as wind energy to give a stable power supply all roundthe year.
Key Words: Solar, Wind energy, Hybrid Power, Renewable, Cooling, Vertical Axis windturbine etc.
I. INTRODUCTION:
Better Health care, enhanced education, better transportation, superior communications systems, higher standard of living and economic stability are some of the major benefits of having usable electric power. However, many parts of the world still do not haveastablesourceofusableelectricitywithmostnon electrifiedareasbeinginthedevelopingnations.
Acknowledging this, many governments have undertaken huge electrification campaigns for rural regions. Renewable sources are being explored to overcome this demand. Wind turbine system combined with solar photovoltaic systems are becoming popular for standalone power generation applications. This is being seen as a good opportunity to reduce the dependence on fossil fuels and move towards a sustainable power supply. This system can be deployed inresidential aswellascommercialcomplexesasstand alone power generation systems with great benefits even though, research and development are required to increasetheefficiencyofthesolarpanelandtherebythe entirehybridsystem.
In this paper a hybrid solar wind power generation system is proposed for a residential complex with 60 apartments.ThemainobjectiveoftheHybridRenewable PowerGenerationSystem(HRPGS)istheproductionand utilization of the electrical energy coming from multiple
sources, given that at least one of them is renewable (Gupta, 2008). Residential generating systems harnessing wind and solar energies are seen as a potential answer to individual energy concerns. The integrationofrenewablesourcessuchassolarandwind aretheisviewedasananswerforfeedingthemini grids andisolatedloads
II. DESIGN OF SOLAR ENERGY SYSTEM
The planet Earth has copious supply of sunlight. The amount of solar energy that the earth receives in one hour is over and above the planet’s total energy requirements for a whole year. But the amount of solar energy that can used depends upon varies factors like, thetimeofdayandtheseasonoftheyearaswell as the geographical location. Solar power systems, such as Photovoltaic (PV) systems, that convert the incident solar energy to electricity by using semiconductor devices like solar electric cells, are now being used to generateelectricalpowerforhouseholdstocountertheir everyday energy necessity. Individual PV cells are arranged into panels of varying electricity producing capacities. PV systems range from single PV cells for powering calculators to large power plants with hundreds of modules to generate large amount of electricity.
A. Determining Power Consumption Demands
Monthly power requirement for one house was recorded. Average units consumed were observed to be 137.66 and daily unit consumed were on an average 4.588.
Table 1
:Monthly Power Requirements of one house
Month UnitsConsumed
Jan 105 Feb 98 Mar 102 Apr 110 May 200 Jun 135 Jul 130 Aug 175 Sep 160 Oct 164 Nov 143 Dec 130 Avg 137.6666667 Daily 4.588888889
© 2022, IRJET | Impact Factor value: 7.529 | ISO 9001:2008 Certified Journal | Page64
Soham Joshi1, Atharva Joshi2, Jayendra Patil3, Suyog Jare4, Rojince Thomas5 Student, Dept. of Mechanical engineering, Vishwakarma institute of Technology, Pune.International Research Journal of Engineering and Technology (IRJET) e ISSN: 2395 0056
Powerrequirementfor60houseswasthencalculated.
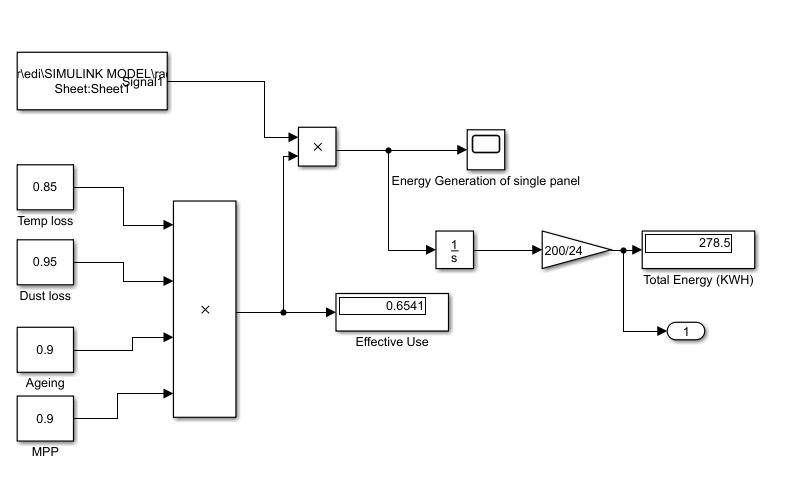
B. CALCULATING PANEL GENERATION FACTOR
Panel Generation Factor is required for calculating the size of the solar PV cells. It depends on various factors like heclimateof the site location (depending upon globalgeographiclocation)etc.
Table 2: Panel GenerationFactor
AvgSolRad 5.41 Losscalfortemp 0.85 Daylightloss 0.95
MPP 0.9 Dustloss 0.95 Ageing 0.9 Totalpower 0.62137125 PGF 3.36161846
The month wise Solar Radiation is shown in table given below:
Table3Monthwisesolarradiation
Month SolarRadiation (MJ/day/m2) SolarRadiation (kWh/day/m2)
January 17.29 4.802778162
February 20.58 5.716667124
March 23.11 6.419444958
April 24.49 6.802778322
May 25.18 6.994445004
June 19.32 5.366667096
July 16.1 4.47222258
August 15.68 4.355555904
September 18.73 5.202778194
October 19.25 5.34722265
November 17.64 4.900000392 December 16.45 4.56944481
Total 233.82 64.9500052
Average 19.485 5.412500433
Average solar radiation (kWh/day/m2) is found to be 5.41.Supposethelowestmonthsolarhasadailyaverage of5.412.Thatisequivalentto5.41hoursof1000W/m2 sunlighteveryday.Losscalculationfortemperaturewill be 15%, daylight not arresting the panel will be nearly 5%,MPPlosswillbenearlyabout10%,anddustwilladd up loss of 5%, ageing effect will have loss of 10% (J.Barad,2017). Hence total overall power was 0.621 of originalpanelrating.Panelgenerationfactorcameoutto be3.361.
C. CALCULATION OF PANEL REQUIREMENT
The total number of PV panels is obtained by dividing thetotalwattpeakratingbyratedoutputofwattpeakof thePVmodulesavailable.
P
Table 4:Number ofpanels required.
Watt Number ofpanels Price Aream2 106476.5 40 2662 3825294 775.8399 106476.5 50 2130 3544320 725.8795 106476.5 60 1775 3216300 755.1738 106476.5 75 1420 3453440 746.849 106476.5 100 1065 3067200 738.5243 106476.5 160 666 4330332 660.4056 106476.5 320 333 2813850 556.1017 106476.5 330 323 2882775 632.5038 106476.5 340 314 3120218 526.22
D. CALCULATION FOR FIX TILT ANGLE
Tocalculatefixtilt angle, usebelowgiven methodstofind thefinestanglefromtheplaneatwhichthemoduleshould betilted:
Table 5: Latitude andfix tilt angle relation
Latitude
FixTiltAngle
Latitude<25 Latitude*0.87 25<Latitude<50 (Latitudex0.76)+3.1°
E. Battery Selection
Averagedailyuseis4.60kWofallappliances.
Butwewouldnotconsider4.6kWaswewillnotrunall appliancesduringa powercut,wewill consider310kW whichincludes:
Table 6: Power Requirement
Totalrequiredpower kWh/day
For60houses 275.3333333 WithF.S 357.9333333
`Total Wp of PV panel Cap needed 106.4764896
Table 7: Modeling of householdapplications
F. PERFORMANCE ENHANCING OF PHOTOVOLTAIC PANELS BY WATER COOLING.
Sunlight incident on a solar panelgeneratesheatand electricity. For a typical commercial PV module operating at its maximum power point, only 15 to 20%
Volume: 09 Issue: 07 | July 2022 www.irjet.net p ISSN: 2395 0072 © 2022, IRJET | Impact Factor value: 7.529 | ISO 9001:2008 Certified Journal | Page65
International Research Journal of Engineering and Technology (IRJET) e ISSN: 2395 0056
Volume: 09 Issue: 07 | July 2022 www.irjet.net p ISSN: 2395 0072
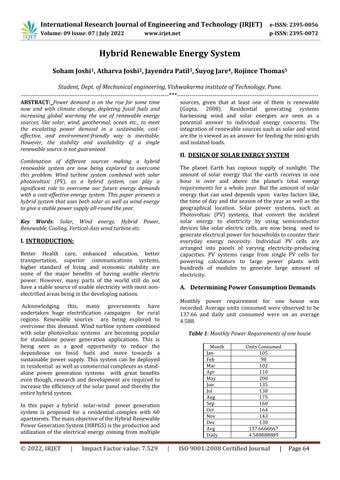
of the incident sunlight is converted into electricity, while most of the rest is converted into heat. One of the main obstacles that face the operation of photovoltaic panels (PV) is overheating due to excessive solar radiation and high ambient temperatures. Overheating reduces the efficiency of the panels dramatically. The idealP Vcharacteristicsofasolarcellforatemperature variationbetween0oCand75oCareshowninFig.TheP V characteristic is the relation between the electrical power output P of the solar cell and the output voltage, V,whilethesolarirradiance,E,andmoduletemperature, Tm,arekeptconstant.Ifanyofthosetwofactors,namely Tm and E, are changed the whole characteristics change. The maximum power output from the solar cells decreases as the cell temperature increases, as can be seeninFig.ThetemperaturecoefficientofthePVpanels used is 0.5%/oC, which indicates that every 1oC of temperature risecorrespondstoa drop inthe efficiency by0.5%.ThisindicatesthatheatingofthePVpanelscan affecttheoutputofthepanelssignificantly.
combined system as cooling agents. The water based cooling system was found to increase the solar cells performance higher than the air based cooling system. Withwaterascoolingagent,itwasfoundthatcoolingthe solar photovoltaic panel it increases the solar cells outputpowerbyalmost50%.
Another study shows, a design of novel micro heat pipe array for solar panels cooling. The cooling system consists of an evaporator section and a condenser section.Theinputheatfromthesunvaporizestheliquid inside the evaporator section and then the vapor passes through the condenser section, and finally, the condenser section is cooled down using either air or water. Hence, the heat pipe can transfer the heat from solar panel to air or water depending on the system. Using air as a coolant was found to decrease the solar cellstemperatureby4.7 oCandincreasesthesolarpanel efficiency by 2.6%, while using water as a coolant was foundtodecreasethesolarcellstemperatureby8 oCand thepanelefficiencyby3%.
From the above study wecan conclude that using water asacoolantisfoundtobemoreeffectivethanusingair.
Thecoolingratemodelisdevelopedto:
1. Minimizetheenergyinput.
2. Minimizetheamountofwater.
3. Optimizetimeofcooling.
G. MATHEMATICAL MODELING
i. Heating Rate Model
Fig 1: P Vcharacteristicsasafunctionofthemodule temperatureTm
In order to avoid this overheating, cooling technique is the solution for it. Hybrid Photovoltaic/Thermal (PV/T) solar system is one of the most popular methods for cooling the photovoltaic panels nowadays. The hybrid system consists of a solar photovoltaic panel combined with a cooling system. The cooling agent, i.e., water or air, is circulated around the PV panels for cooling the solar cells, such that the warm water or air leaving the panels may be used for domestic applications such as domesticheating.Itwasalsofoundthatcoolingthesolar photovoltaic panel does not allow the solar cells surface temperature to rise above 46oC when exposed to solar radiationforaperiodof4hours.
A study shows, hybrid PV/T solar system was designed where water and air were both investigated in the
Cooling frequency is function of heating rate of panels.
Objective was to find the module temperature as a functionoftime.
The module temperature is calculated using the followingequation:
Tm = Tamb +
Where Tm = Module Temperature, Tamb = Ambient Temperature, NOCT = Nominal Operating Cell Temperature, E=SolarIrradiance
TheNOCTisafunctionoftheambientairtemperatureat thesunrisetimeTrise asfollows:
NOCT=20o+Trise
TherateofheatingofthePVpanel, ,isdependenton the following: (i) the ambient temperature, (ii) the irradiance, and (iii) the NOCT. The NOCT has a constant value,whiletheirradianceandtheambienttemperature arefunctionsoftime.Therefore,themoduletemperature willbefunctionoftimebetweensunriseandsunset.
International Research Journal of Engineering and Technology (IRJET) e ISSN: 2395 0056
In general, this heating rate comes out to be 6oC/hr. or 0.1oC/min. (These are the values observed experimentallyandsouseddirectly)
ii. Cooling Rate Model
Coolingrateisfoundbyenergybalance. Criticalfromthepointofenergyconsumption
The cooling time t is determined from the following energybalance: Qgainedbycoolingwater =QdissipatedfromPVpanels w ×t×cw ×ΔTw =mg ×cg ×ΔTg t=
Where w=massflowrateofwater, mg=massofglass, cw=specificheatcapacityofwater, cg=heatcapacityofglass, ΔTw=watertemperaturerise , ΔTg=glasstemperaturechangesduetowatercooling
The mass flow rate of water w is calculated from the equation: w = ,where isthewaterdensityand is the volume flow rate. The mass of glass mg is calculated from the equation: mg = Ag xg, where is the density of tempered glass, Ag is the surface area of the PV panel, and the xg is the thickness of the glass coveringthePVpanel.Theheatcapacityofwater,cw,and theheatcapacityofglass,cg,areassumedtobeconstant since the variation in the water and the PV panel temperatureisnotlarge.
III. ANALYSIS AND OPTIMIZATION OF VAWT
Wind is plentiful source of clean energy. To harness electricityfromwindenergy,windturbinesusebladesto collect the wind’s kinetic energy. Wind flows over the bladescreatinglift,whichcausesthebladestoturn. The blades are connected to a drive shaft that turns an electric generator, which produces electricity. Wind turbines can be classified in a first approximation according to its rotor axis orientation and the type of aerodynamic forces used to take energy from wind. There are several other features like power rating, dimensions, number of blades, power control, etc. that are discussed further along the design process and can also be used to classify the turbines in more specific categories.
A. ROTOR AXIS ORIENTATION
Themajorclassificationofwindturbinesisrelatedtothe rotatingaxispositioninrespecttothewind;careshould betakentoavoidconfusionwiththeplaneofrotation:
i. Horizontal Axis Wind Turbines (HAWT):
The rotational axis of this turbine must be oriented parallel to the wind in order to produce power. Numeroussourcesclaimamajorefficiencypersame swept area and the majority of wind turbines are of thistype.
ii. Vertical Axis Wind Turbines (VAWT):
The rotational axis is perpendicular to the wind direction or the mounting surface. The main advantageisthatthegeneratorisongroundlevel,so theyaremoreaccessible,andtheydonotneedayaw system. Because of its proximity to ground, wind speedsavailablearelower
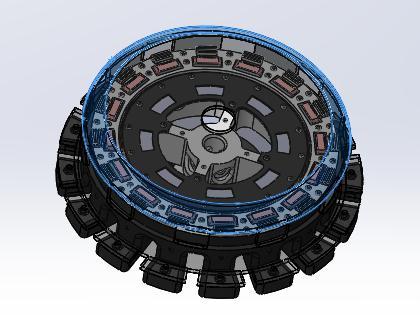
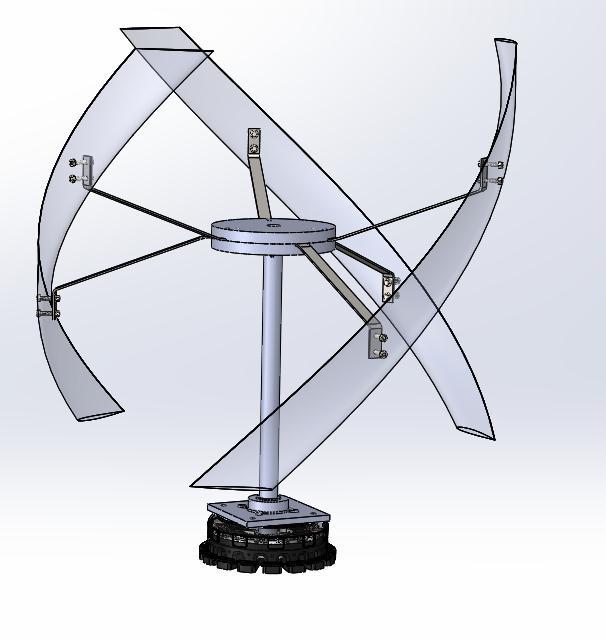
B. DESIGN OF 600W HELICAL BLADE VERTICAL AXIS WIND TURBINE
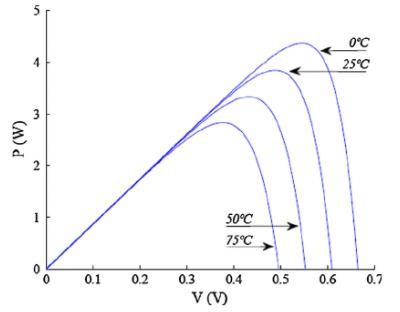
Fig 2: Coolingtimetversusvolumeflowrate
Temperatureofsolarpanelbeforecooling=45oC
Temperatureofsolarpanelaftercooling=35oC
Temperatureofwateratinlet=25oC
Temperature of water at outlet = 35o C (assumed that waterleavesatsometemperature) ΔTg=ΔTw =10oC
In the case of a horizontal axis wind turbine, a large numberofdevicesarerequired,suchasayawingdevice and a pitching device. While the generation efficiency is relatively high, the blade shape is complicated. There is alsoa disadvantageinthatthewinddirection islimited. In the case of a vertical axis wind turbine, the structure issimple,anditis advantageous forinstallationina city center because there is no restriction of the wind direction.
Typical blade types of vertical axis wind turbines are Darrieus, gyro mill, Savonius, and helical blades. The helicaltypeisadvantageousinthatthefluctuationrange
Volume: 09 Issue: 07 | July 2022 www.irjet.net p ISSN: 2395 0072 © 2022, IRJET | Impact Factor value: 7.529 | ISO 9001:2008 Certified Journal | Page67
International Research Journal of Engineering and Technology (IRJET) e ISSN: 2395 0056
Volume: 09 Issue: 07 | July 2022 www.irjet.net p ISSN: 2395 0072
of the output is smaller than that of the conventional Darrieus or gyro mill blades, and the self starting performance is better. It also has less mechanical load andlessnoisethanaSavoniusrotor,whichisadrag type rotor.
P= ρAωV3 (1)
Fig 3: Basic designparameters ofthe vertical wind turbine
Equation (2) is the mechanical power output generated bytherotationofthewindturbinerotor.
P=Tω (2)
The ratio of the power converted from the rotor power tothewindpowerflowingiscalledthepowercoefficient, which is a concept of aerodynamic energy conversion efficiency. Theoretically, the maximum value of the power coefficient is 0.593 in a horizontal axis wind turbine,whichisknownastheBetzlimit.TheBetzlimit is derived from actuator disk momentum theory and is the theoretical maximum assuming that the flow is steady state, inviscid, and irrotational. The Darrieus turbine is a typical lift type vertical axis wind turbine and has a maximum power coefficient of about 0.4 at a tipspeedratioof5.
Equation (3) shows the power output (P) of the wind turbine considering the power coefficient (CP) and power transmission efficiency (η) A ω is the rotor sweptarea(seeEquation(5))
P= ρAωV3ηCp (3)
The tip speed ratio (λ) is closely related to the power coefficient. The tip speed ratio is defined as the ratio of the blade tip speed and the wind speed at which the bladetipmoveswithrotation,asshowninEquation(4).
λ= (4)
Allwindturbinerotorshaveanoptimumtipspeedratio withmaximumpower.Theoptimalratioisrelatedtothe changeoftheincomingwindspeed.Therotorsweptarea (Aω)isdeterminedbytheradiusandheightofthewind turbine.
Aω=2RH (5)
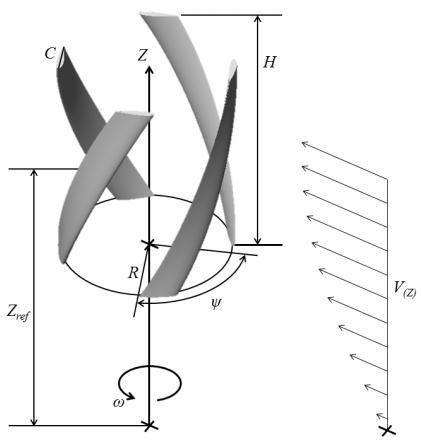
The wind swept area should consider the height of the rotor(H)andtheaspectratiowithrespecttotheradius (R).Thelongertherotorradius,thehigherthegenerated torque, but the longer the strut length, the lower the structural stability. However, when the rotor height is greater,thegeneratedtorqueislower,andtherotational speed of the rotor should be increased to obtain the same power output. The aspect ratio (AR) can be expressedas
AR= H=AR×2R (6)
Solidity(ς)isanimportantvariablethatdeterminesthe performance of wind turbines. Solidity is defined as the ratioofthetotalprojectedarea(NC)oftherotorbladeto the rotational area of the wind turbine rotor. The projectedarea istheprojectioninthevertical section of therotatingshaftandcanbeexpressedas
Σ= (7)
The blade chord length (C) can be calculated using the solidity. The chord length is the length of the airfoil and is an important design variable because the generated torquechangesaccordingtothechordlength.
Urban wind power generators should operate at low speedwithlownoise.ASavoniuswindturbinecanrotate withatipspeedratiooflessthan1,butthevibrationand noisearesevereduetothecharacteristicsofadrag type rotor. Among the lift type vertical axis wind turbines, helical blade wind turbines have a narrower range of output fluctuation compared to Darrieus and gyro mill wind turbines, and their efficiency is higher due to the largerwind sweptarea.
The purpose of this study is to design a low speed vertical axiswindturbinebladewithatipspeedratioof 1.1ata ratedwindspeedof 10m/s.Thedesign of wind turbinewiththedesigner definedClassSaftermodifying Class1identifiedinIEC61400 2;Figureshowsapicture ofthebasicparametersofthesmallwindturbinesystem. The selected rated wind speed was 10 m/s, which is lowerthanthe rated windspeedcorresponding toClass 1. The height of the rotor hub is 8 m. Wind shear is
© 2022, IRJET | Impact Factor value: 7.529 | ISO 9001:2008 Certified Journal | Page68
International Research Journal of Engineering and Technology (IRJET) e ISSN: 2395 0056
considered, and the velocity profile (V(Z)) is shown in Equation(8).
V(Z)=Vref (Z/Zref)a (8)
Fig 4:Force andvelocities acting onthe vertical wind turbine for various azimuth angles.
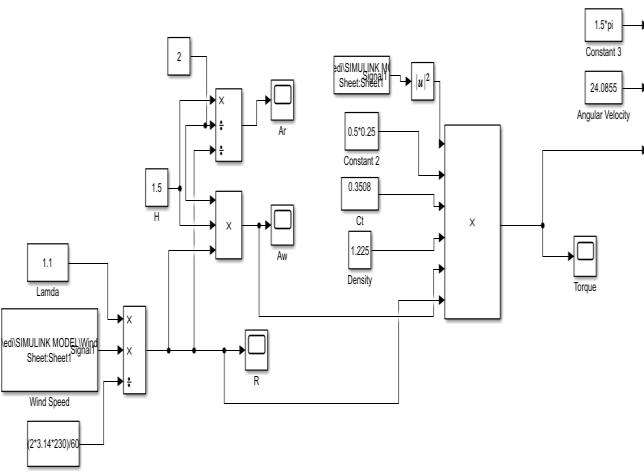
Thewindshearpowerindex(a)canbevariedaccording tothesurfaceroughnessoftheterrain.Inthisstudy,0.23 was selected for the condition of a forest or a small number of buildings. Table summarizes the design parameters applied in this study. The maximum wind speed,turbulenceintensity,anddimensionlessslopeare thesameasClass1.Thetargetoutput is600W,andthe air density is 1.225 kg/m3, as specified in IEC 61400 2. The power transmission efficiency was assumed to be 95%, and the average power coefficient turbine was set as 0.15. The design output, air density, design wind speed,andefficiencyaredefinedinEquation(3).
Equation (9) is used for calculating the radius of the windturbinerotorthroughtherelationshipbetweenthe wind sweptareaandtheaspectratio.Aradiusof0.55m andheightof1.43mwerethuschosen.
R=√ (9)
A tip speed ratio of 1.1 was chosen. In the case of a Darrieus type wind turbine, the maximum power coefficientcanbeachievedattipspeedratiosbetween4 and6.Atthedesignedwindspeedof10m/switharotor radius of 0.45 m, the rotational speed is between 230 and500rpm,whichisinadequateforuseinacitycenter. A rotational speed of 230 rpm was derived by applying the radius, design wind speed, and tip speed ratio in Equation(4).Thenumberofbladeswaschosenas3,and the solidity was set as 0.3, which was substituted into Equation(7)todeterminethechordlengthof0.25m.
Inthisstudy,theaerodynamicpowerofthewindturbine rotor was investigated by applying a NACA 0018 airfoil
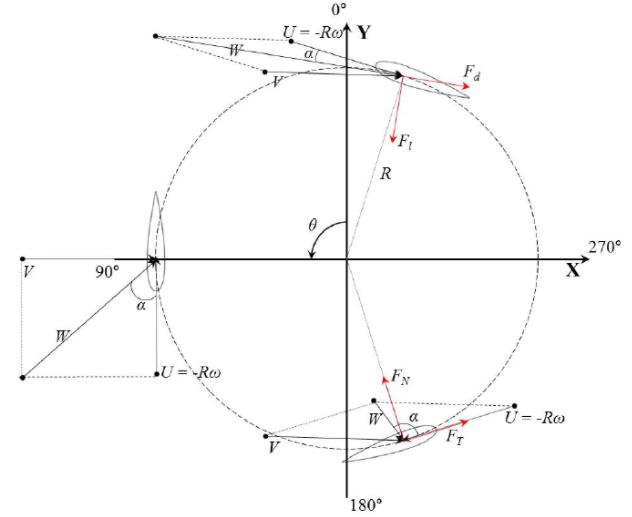
and a mathematical model using the lift and drag forces of the airfoil according to the angle of attack. Unlike the bladeofahorizontal axiswindturbine,whichhasafixed angle of attack, the angle of attack varies for a vertical axiswindturbinedependingontherotationangleofthe rotor.
Table 8: Bladespecifications
Item Description
Rotortype Helical
Ratedpoweroutput 600W
Ratedwindspeed 10m/s
Transmissionefficiency 0.95 Sweptarea 1.37m2
Aspectratio 1.64 Rotorradius 0.45m Rotorheight 1.5m
Rotationalspeed 230rpm Solidity 0.3 Chordlength 0.25m Numberofblades 3 Airfoil NACA0018
Figure presents the tip velocity vector and the lift, and thedragvectorsgeneratedbytherotationoftheturbine blade. The angle of attack changes with the blade tip velocity vector and the influx wind velocity vector. The vector sum (W) of the tip velocity vector and incoming wind velocity vector (V) is calculated by Equation (10). The maximum value occurs at θ = 0o, and the minimum valueoccursatθ=180
W=√ [ ] = √ (10)
The angle of attack (α) is the angle between the vector sum and the direction of the chord length. As the vector sum changes, the angle of attack has a positive value in theupstreamregionofthe rotoranda negativevaluein the downstream region. The angle of attack can be expressedasEquation(11)
α= ( ) (11)
As shown in the equation, the dominant variable that affects the angle of attack is the tip speed ratio. Figure shows the angle of attack as the blade rotates according to the tip speed ratio. The larger the tip speed ratio, the smaller the range of the angle of attack the airfoil receivesduringrotation.Thelargerthebladetipvelocity vector is, the larger the tip speed ratio is. This occurs because the vector sum direction approaches the direction of the blade’s forward velocity vector, and the angle of attack becomes smaller. The range of the angle
Volume: 09 Issue: 07 | July 2022 www.irjet.net p ISSN: 2395 0072 © 2022, IRJET | Impact Factor value: 7.529 | ISO 9001:2008 Certified Journal | Page69
International Research Journal of Engineering and Technology (IRJET) e ISSN: 2395 0056
of attack of the airfoil is about 66.5o in one rotation of therotor.
-100