International Research Journal of Engineering and Technology
(IRJET) e-ISSN: 2395-0056

Volume: 09 Issue: 07 | July 2022 www.irjet.net p-ISSN: 2395-0072
(IRJET) e-ISSN: 2395-0056
Volume: 09 Issue: 07 | July 2022 www.irjet.net p-ISSN: 2395-0072
Prof. Dr. M. N. Shelar1 , Pratik Deepak Bhadane2 , Harshal Jaywant Patil3 , Om Sunil Tajane4,Nakul Anil Wagh5
1Associate Professor, Department of Mechanical Engineering, K.K.W.I.E.E.R., Nashik. 2,3,4,5 Department of Mechanical Engineering, K.K.W.I.E.E.R., Nashik ***
Abstract In tribal village of Kharwal, water scarcity has been one of the major issues for several decades. Villagers travel long distances just to obtain few litres of water from the well. The objective of our study was to understand the water scarcity problems of villagers and how we can eradicate their day to day complexities of travelling long miles to obtain water. For this purpose, different methods and processes were used. Forecasting water demand which will meet daily requirements of villagers is a very first aspect we started with. Then, by understanding the topography of village helped us in planning an efficient water distribution system for the village in WATERGEMS. Consequently, pump selection was done which remains crucial as it would help deliver water from source using distribution network to the overhead tank in the village. Cost estimation of the plan was also done. This paper presents the glimpses of our experience and gives analysis of different sectors.
Key Words: Water Distribution System, WATERGEMS, PumpSelection,CostEstimation.
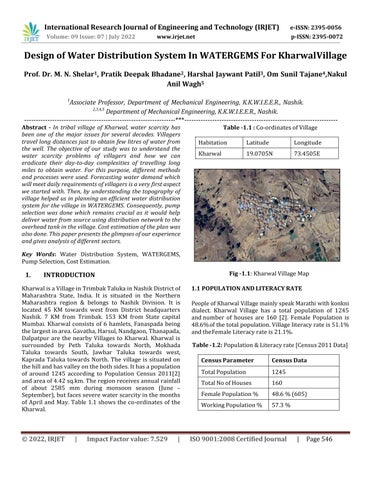
KharwalisaVillageinTrimbakTalukainNashikDistrictof Maharashtra State, India. It is situated in the Northern Maharashtra region & belongs to Nashik Division. It is located 45 KM towards west from District headquarters Nashik. 7 KM from Trimbak. 153 KM from State capital Mumbai. Kharwal consists of 6 hamlets, Fanaspada being thelargestinarea.Gavatha,Harsul,Nandgaon,Thanapada, Dalpatpur are the nearby Villages to Kharwal. Kharwal is surrounded by Peth Taluka towards North, Mokhada Taluka towards South, Jawhar Taluka towards west, Kaprada Taluka towards North. The village is situated on thehillandhasvalleyonthebothsides.Ithasapopulation of around 1245 according to Population Census 2011[2] andareaof4.42sq.km.Theregionreceivesannualrainfall of about 2585 mm during monsoon season (June September),butfacesseverewaterscarcityinthemonths of April and May. Table 1.1 shows the co ordinates of the Kharwal.
Table 1.1 : Co ordinatesofVillage Habitation Latitude Longitude Kharwal 19.0705N 73.4505E
Fig -1.1:KharwalVillageMap
PeopleofKharwalVillagemainlyspeakMarathiwithkonkni dialect. Kharwal Village has a total population of 1245 andnumber of houses are 160 [2]. Female Population is 48.6%ofthetotalpopulation.Villageliteracyrateis51.1% andtheFemaleLiteracyrateis21.1%.
Table -1.2: Population&Literacyrate[Census2011Data]
Census Parameter Census Data
TotalPopulation 1245
TotalNoofHouses 160
FemalePopulation% 486%(605)
WorkingPopulation% 57.3%
International Research Journal of Engineering and Technology (IRJET) e ISSN: 2395 0056
Volume: 09 Issue: 07 | July 2022 www.irjet.net p ISSN: 2395 0072
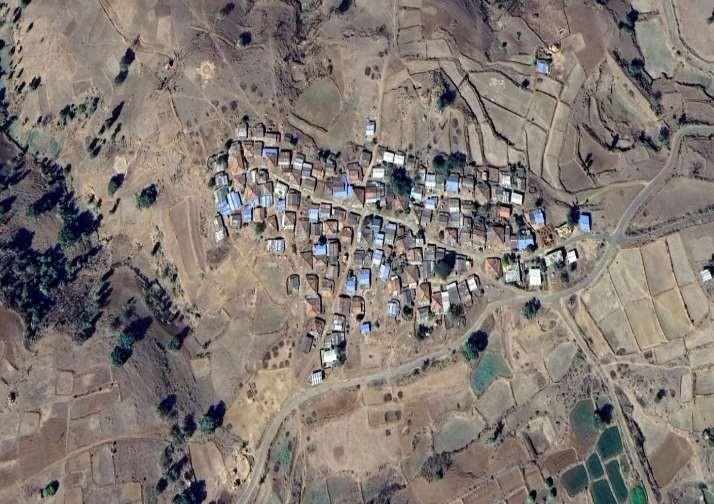
The major sources of water in the village are water supply through wells. Kharwal does not have a perennial surfacewatersourceintermsoflakesorrivers.Ithowever istransgressedbyanetworkofstreams.Themajor water resource for Kharwal is ground water. Water for agriculture in Kharwal is majorly obtained through rainfall. The water needs and availability in a region dictate the croppingpatternfollowedbythecultivatorsintheregion. Insummerswaterisveryscarcethuspeoplemostlyprefer tofetchwaterfromwell.
season.Theirsourceofwatersupplyisawellsituated2kms south of target region which comprises of 637 people (536of Talwadi and 101 of Morewadi). The geology and geography of the region is such that the groundwater therewas not abundant despite of receiving high rainfall during the monsoon season because of the typical nature of the Deccantraps. The paper explained the faults inthe ongoingpipedwaterschemessuchasthepeoplewerenot willing to pay regular tariff. The paper also listed the technical issues such as the GSR (Ground service reservoir) which was supposed to distribute water by gravity to Talwadi and Morewadi but failed because it was slightly lower inelevationthantheMorewadi’sstand post. Irregular electric supply and irregularity of the operator were also some of the reasons responsible for failureoftheimplementedschemes.
Amit Kumar et al. [7] The paper we have referred to tells us about different problems faced by people of Juwi village situated in Gadchiroli District which is located in state of Maharashtra. Parched lands, seasonal availability of water, agricultural issues, educational problems. The issue which mainly pertains to our project is water scarcity problems. In, Juwi village it was solved by using GSDA’s Dual Pump Scheme, the scheme is designed for existing well only. The package consists of overhead reservoir,steelframe,D.C submersiblemotor,Solarpanel withframe,watersupplypipesandtaps.Thedisadvantages ofthisschemeareduringrainyandwinterseason,sunlight islowandpaneliscoldthensystemefficiencydecreases.
Vidyaetal.[5]studiedhowa structuredformsurvey was conducted in the Chondwade Bk tribal village, Dhadgaon Tehsil, Nandurbar district, Maharashtra. Their main aim wastostudyandunderstandthevillageecosystemandthe daily problems they faced. PRA Technique was used to collectDatabyHouseholdsurvey,WaterResourcesSurvey, Health Survey, Livelihood Survey etc. They had closely interactedwiththevillagersandconcernofficialsofGram PanchayatandtheGovt.AuthoritieslikeGramsevak,Talathi, and Agriculture Officers to have comprehensive understand ofvillage.Havingvariousdifficultiesinvillagetheytriedto implement solutions like solar household lighting system, CSRproposalformalnutritionprogram&manymore.
Hemant et al. [6] Investigated the single village drinking water scheme and understand the reasons for its failure fromtechnicalandsocialperspectives.Thevillagereceives annual rainfall of about 3500mm during monsoon season butfacesseveredrinkingwaterscarcityduringthesummer
Pravinkumar et al. [8] Studied the hydraulic analysis of ShivajiNagarofPanvelCity.Thesteadystateanalysishas been carried out for calculation of hydraulic parameter suchasheadpressureanddischargeflow.Intheirproject WaterGEMSsoftwareisusedforobtainingoptimaldesign of water supply network they calculated different alternative optimal design solution considering pipe diameterandpipematerial.
This section discusses the various methods and tools we adopted for the collection of primary and secondary data for the village. This is important to understand about thebehaviorandmindsetsofpeople.
TheVillageReportmethodologyincludes,
I.Primarydatacollection.
II.Secondarydatacollection.
III.Otherfieldworkactivities.
International Research Journal of Engineering and Technology (IRJET) e ISSN: 2395 0056
Volume: 09 Issue: 07 | July 2022 www.irjet.net p ISSN: 2395 0072
We adopted standard practices of understanding the basicgeographyoftheregion,conducting villagesurveys & transect walk. During the process we understoodhow toextractinformationfrompeople.Sometimesitisdifficult to get out information, in such case we need to extract information through indirect means like through informal talks, activities, each of which is discussed in thefollowingsub section.
Methodsofcollectingprimarydata
• BasicGeographyoftheRegion
• VillageSurvey
Eachofthesemethodsisdescribedbelow:-
ThemapofKharwalGramPanchayatareawasstudiedto get more information about the land use pattern and vegetation cover near the village. Kharwal village consists of 12 small hamlets which are located on a top ofahillsurroundedbyforest;hencetheagriculturalland is very less when compared to the forest cover. Apart from this a satellite map had been used as a reference. The maphelpedto understand the topography of village and helped us to understand the land use pattern and vegetationcoverofthevillage.Basemapgivesapictureof different land usages like forest, agricultural land, water bodiesandroads.
seasonal and feeds the well itself. This activity had given us a glance of whole village and helped us to know how much variations are there in the village in all aspects like social,economic,physical,etc.
To understand the administrational setup, it is very necessary to look at the secondary data related to the village. Table 3.1 describes the list of secondary data collectedduringthevisit.
Table -3.1: SecondaryDataCollection
Outcome Source of Secondary Data bodies,Wells,Agricultural produce,etc.
GramSevak’s Office ofhouseholds,noof water
Detaileddataoftotalpopulation,no DetailPartitionofLand utilization
Talathi Office DetailPartition of Agricultural/Nonagriculturallands
4.1 Domestic need of water per day in Kharwal
We with other local people helped in observation of thingsaround and walk with consistent steps and make note of various things like slope, type of soil and trees, hills, habitations, infrastructure. Though walk in and around thevillage we have gather important document and observations, documented the living and non living thingsthat surround. Transect walk is such a tool which helpsusunderstandabovesaidaspects.
Eachofthesemethodsisdescribedbelow:a small valley where houses are on both the sides of the valley at upper elevations. It was about 50 m height and all the villagespread roundthe top of valley.Around 500 m walk down the slope we got to the village community
Daily water demands for per person per day is taken 20 litresperpersonperday,whichincludeswaterfordrinking and cooking. The system is designed considering the 40 yearsoftheservice.Populationestimationfornext40years is done considering the decadal growth rate of 8.4% for ruralIndia.
Table -4.1: PresentandForecastedPopulation Year Population 2020 1245 2060 1650
Table -4.2: Totalwaterrequirementperday
Transect walk is focused to cover all types of resources of the village. We started from top of the hill which is towardsthesouthofthevillage. Thevillageislocated on
PerCapita WaterNeed (liter)
Detail Partition of ForestlandResourcemap well which was the only source for drinking water for village apart from the small stream flowing by which is
Total Population DailyWater Req.forVillage A B A*B 20 1,650 29,330liters
International Research Journal of Engineering and Technology (IRJET) e ISSN: 2395 0056
Volume: 09 Issue: 07 | July 2022 www.irjet.net p ISSN: 2395 0072

Ground Service Reservoir (GSR): GSR is ground level or plinth level storage tank. The plinth level is generally not more than 3 m. Storage capacity of the service reservoirs isestimated based on pumping hours, demand and hours of supply, electricity available for pumping. Systems with higher pumpinghoursrequirelessstoragecapacity.
Considering The water needof village for40 years Tank ofcapacityof30,000literisselected.
Aftersurveyingthevillagewatersourcewhichcancaterthe need of village for over 40 years, all existing sources were found inadequate. New potential aquifer source was foundusing ERT (Electrical Resistivity Test method. The Well 12m deep and 7m wide was proposed in surveyed area. Which is located in a valley South of the village.
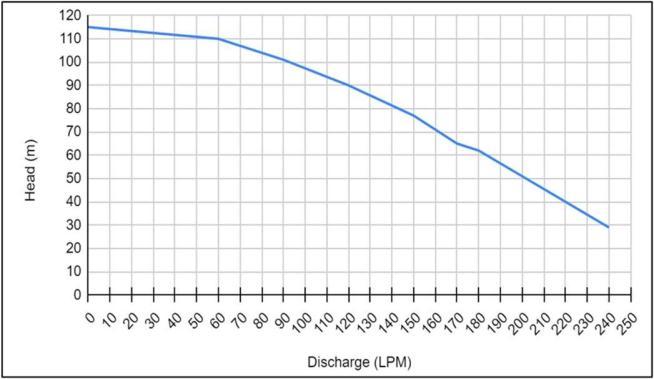
A pump is a device which converts mechanical energy intohydraulicenergy.Itliftswaterfromalowertoahigher level and delivers it at high pressure. Proposed schematicdiagramofwaterpumpingforKharwalvillage is shown in the chart 1. Pump Capacity calculation is essential for selection of pump and Energy requirement. All the required input parameters for pumpselection are listedinTable4.3
Hf=0.04339m
Hf= 0.04339 m @150LPM
Total dynamic Head (HT) -Totaldynamicheadistotalsum
ofsuctionhead,deliveryheadandfrictionhead.
HT =Hf +hf +HS
HT=0.04339+9.173+55.5HT =64.7163m
HT≈ 80 m
(Consideringunaccountedlossesduetotemperature change,scaleformationinsidepipe,workingcondition)
HydraulicPower Hydraulicpoweristheamountofwork done to lift the water to a certain height and discharge. Hydraulicpoweriscalculatedusingequation
Ph = (ρxQxHTx9.81)/1000
Ph= (1000x0.0025x80x9.81)/1000Ph =1962W
Ph =1.962KW
Assuming60%efficiency,
TotalHydraulicPowerneeded=(1.962)/0.6 =3.27KW
HydraulicPowerinHP=3.27*1.34102(1KW=1.34102 HP)
Static Head (HS) Staticheadisthetotalvertical distancethatapumphastoraiseswater.
HS=12+38+1.5+4HS= 55.5 m
Friction Head (Hf ) In fluid flow it is the head loss that occursin a containment such as a pipeor ductdue to the effect of the fluid's viscosity near the surface of the containment. Friction head is calculated by the Hazen William’sequation(1)
Hf= 10.67/D^4.8704 〖.(Q/C)〗^1.852*L
Hf = 10.67/60^4.8704 〖.(0.0025/140)〗^1.852* 678Hf =9.173m
Hf= 9.173 m @150LPM
Loses in Fittings (hf) Pipe fittings, valves and bends havesome associated K factor or local loss coefficient. Manufacturersofpipeworkfittings and valves publisha fitting'sassociated'K'factor.For900bendKis0.54.
International Research Journal of Engineering and Technology (IRJET) e ISSN: 2395 0056 Volume: 09 Issue: 07 | July 2022 www.irjet.net p ISSN: 2395 0072
Hf=(K*V^2)/2g Hf=(0.54*0.78841)/9.81 (K=0.54for900bend) =4.385HP ≈ 5 HP Therefore,5HPpumpdeliver150LPMat80mhead.
FromKirloskar’scatalogue, KS4G 5017wasselectedwhichwas100mm/4”Borewell SubmersiblePump
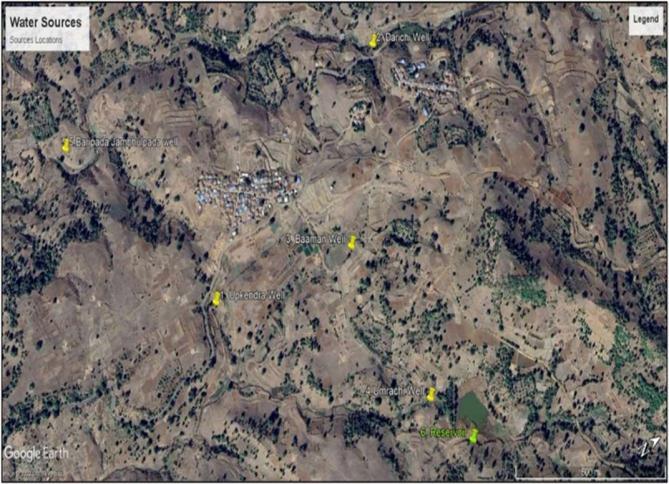
Theselectedpumpis220VSinglePhase Table 4.4: PumpPerformance Chart Discharge Head LPM m3/s (m) 0 0 115 60 0.001000002 110 90 0.001500003 101 120 0.002000004 90 150 0.002500005 77 170 0.002833339 65 180 0.003000006 62 240 0.004000008 29 Chart- 1:PumpCurves
Factorsconsideredwhileselectionofpipe:1. TypeofFluid 2. FlowRate 3. PipeSize 4. Pressurelossduetofrictionaldrag 5. Surfaceroughnessofpipeinterior(K) 6. Lengthofflowpath
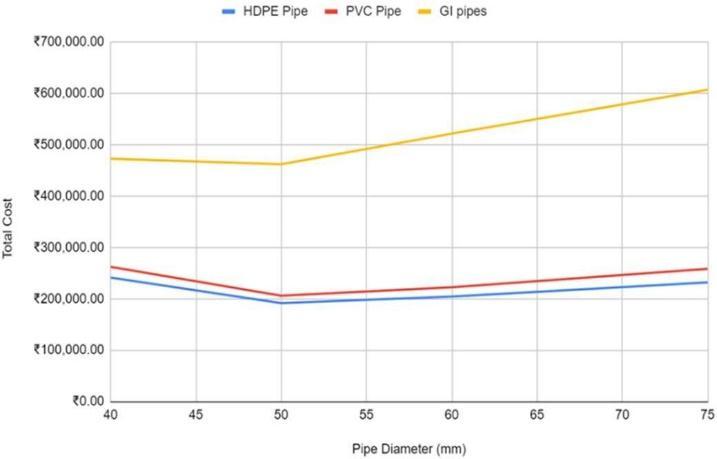
From a purely economic standpoint involving pressurized flow, the optimum pipe size diameter is the factor that minimizes the life cycle cost of a piping system. The installation cost and the recurring costs associated with operation and maintenance are the components which were examined using the concept of time-valueofmoneyinthisstudy.
Table -4.5: Head&DischargeofVariousPipeDiameter
Discharge Head Pump Curve 40mm 50mm 60mm 75mm 0 115 55 5 55 5 55 5 55 5 60 110 67 545 59 599 57 199 56 078 90 101 81 023 64 186 59 100 56 725 120 90 98 983 70 299 61 634 57 587 150 77 121.23 77.873 64.774 58.656 180 62 147 63 86 859 68 499 59 924 210 45 5 178 08 97 221 72 794 61 386 240 29 212 47 108 92 77 646 63 037
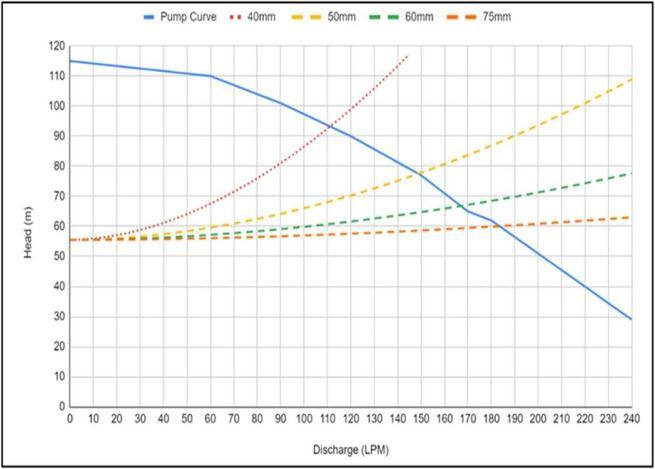
Chart-2:Head&DischargeCurves
International Research Journal of Engineering and Technology (IRJET) e-ISSN: 2395-0056
Volume: 09 Issue: 07 | July 2022 www.irjet.net p-ISSN: 2395-0072
HDPE Pipe Pipe Dia (mm)
kWh perday Rs/Ye ar Running Costfor 10Years
Total Fixed Cost
Total Cost
40 55.446 20237 202378 38900 241278 50 35.614 12999 129993 61528 191521 60 29.623 10812 108127 96106 204233 75 26.887 9791 97915 133996 231911
PVC Pipe Pip Dia (m
Ru in T tal
Thepurposeofdistributionsystemistodeliverwaterto consumer with appropriate quality, quantity and pressure. Distribution system is used to describe collectively the facilities used to supply water from its sourcetothepointofusage.Allthedesign&modellingis doneinWaterGEMSSoftware.
GI Pipe Pipe Dia (mm) kWh perday Rs/Ye ar Running Cost for 10 Years
Total Fixed Cost Total Cost
40 65 444 23887 238873 442951 472951 50 39 034 14247 142475 431981 461981 60 31 056 11335 113356 491680 521680 75 27 330 9975 99755 577067 607067

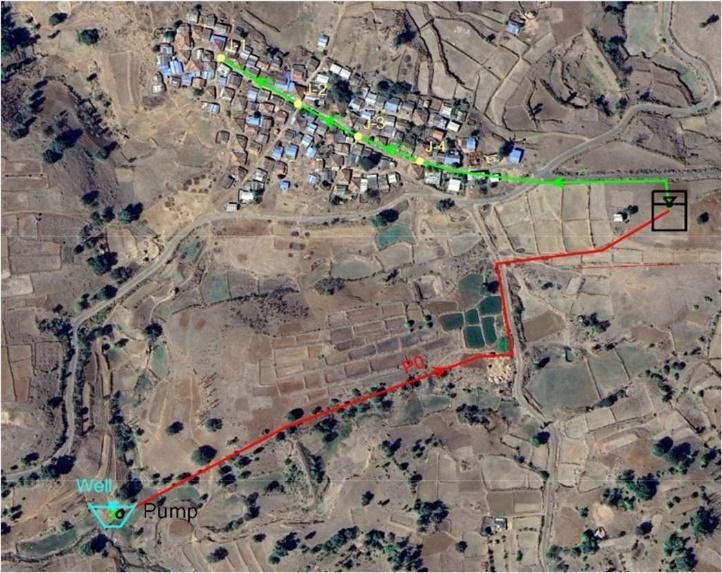
Fig -5.1:ProposedPipelineLayout
Table -5.1: WaterDemand
From this study, HDPE pipe of 50mm diameter was found to be best suited for the application with most economicalpipesizeandmaterial.
International Research Journal of Engineering and Technology (IRJET) e-ISSN: 2395-0056
Table -5.2:
Type Dia Lengt h Mater ial
Flow (L/m in)
Numb er of Stand Post
Main Line 50mm 674m HDPE 181 0
Branch 1 50mm 86m PVC 18 1
Branch 2 50mm 65m PVC 36 1
Branch 3 50mm 64m PVC 54 1
Branch 4 50mm 266m PVC 72 1
Colo r Code
Water Distribution system modelling in WaterGEMS software-
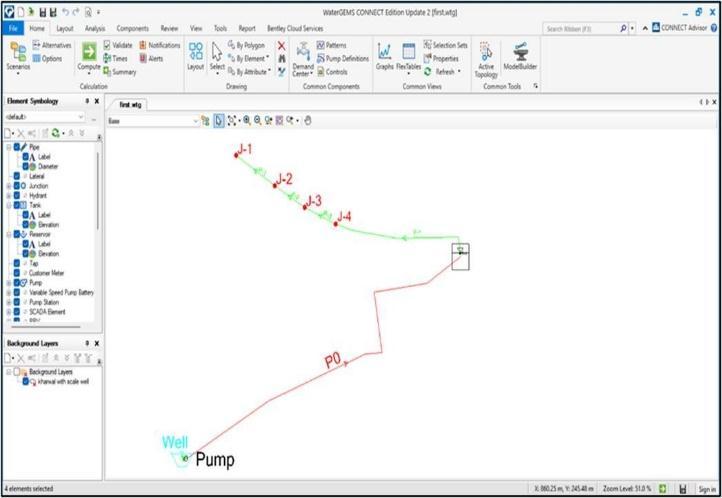
WaterGEMS software: The ever increasing demand of Continuous water with increase in population can be fulfilled by designing efficient water distribution networksbased on advance computing systems include modern hydraulic modeling. In present study water distribution network of Kharwal village, Nasik, Maharashtra, India. Forthe design of water distribution network, study of present population, daily water demand, flow characteristics and also survey of the villageisdonewithhelpofdigitalGPS. Waterdistribution network for the villages is analyzed and designed with help of Bentleys WATERGEMS software. The schematic layout is shown in fig 5.2. This software helped in designing Water distribution network systems to deliver
NetworkLength water from a source in the adequate quantity, quality andatsatisfactorypressuretoallindividualconsumers.
Water distribution network is designed with an objective of minimizing the overall cost while meeting the water demand requirements at adequate pressures. The systemis a pipeline network consisting of one source node and several demand nodes is considered to find its optimal geometrical layout which delivers to required demands from source to destination. The software uses hydraulic model results which help in optimizing the design of complex water distribution systems and utilize built-in scenario management features to keep track of design
alternatives.Waterdemandpeakfactoristaken3asper
GOI guidelines [14]. Considering this, the demandat each node is taken as 30 Litres/min. Also, foreach Junction (node) elevation value was assigned asshownin table5.2accordingtothevillagetopography.
Fig -5.2:PipelinenetworkdiagraminWaterGEMS software
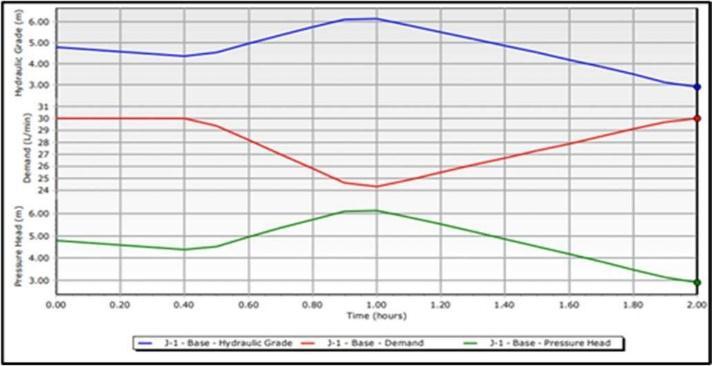
For each Junction the value of hydraulic Grade (Hydraulic Head) is calculated. Simulation Results are showninthetable5.3.Thedataisarrangedinascending of Hydraulic grade. Such as Junction 1 has the least hydraulic grade of4.77 m and Junction 4 has maximum grade of 6.14 m at30L/mindemand.
Table -5.3: PipelineJunction
Label Demand (L/min) Hydraulic Grade(m) Pressure (kPa)
Junction 1 30 4.77 47 Junction 2 30 4 92 48 Junction 3 30 5 31 52 Junction 4 30 6 14 60
Chart 4 :WaterQualityatJunction
Volume: 09 Issue: 07 | July 2022 www.irjet.net p-ISSN: 2395-0072 © 2022, IRJET | Impact Factor value: 7.529 | ISO 9001:2008 Certified Journal
International Research Journal of Engineering and Technology (IRJET) e ISSN: 2395 0056
Volume: 09 Issue: 07 | July 2022 www.irjet.net p ISSN: 2395 0072
Chart- 5:WaterflowandLosses
Chart 6: PipelinenetworkdiagraminWaterGEMS software
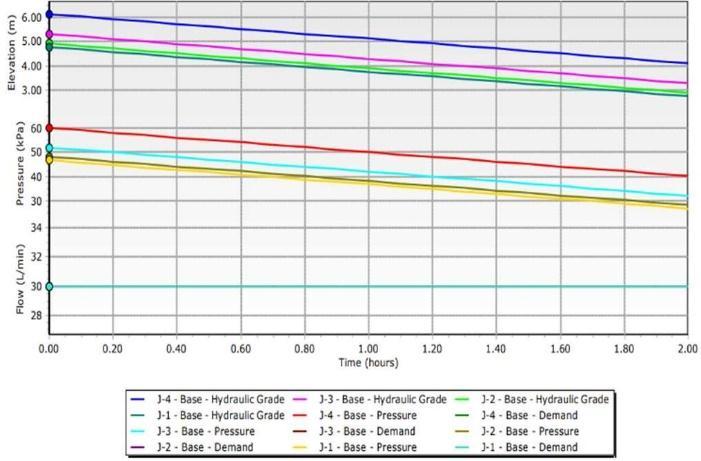
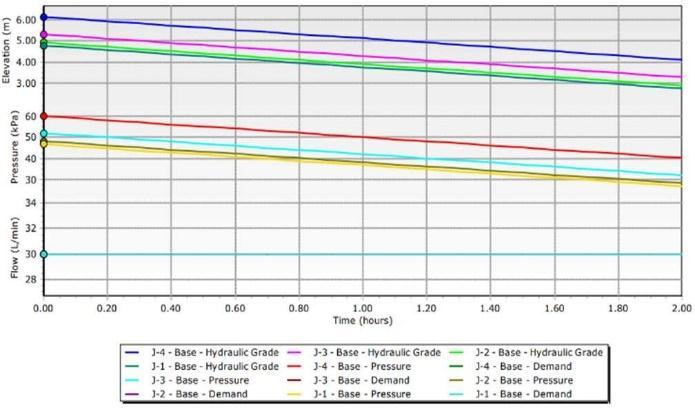

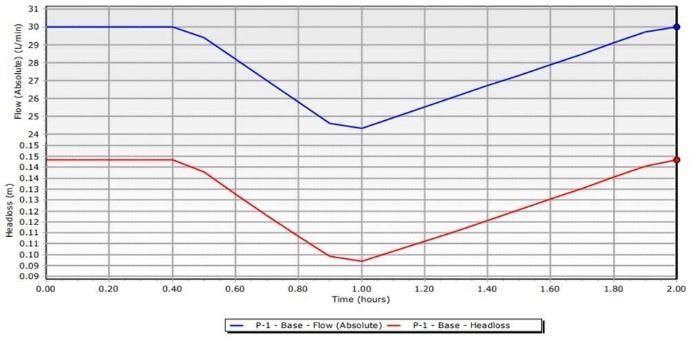
Chart- 7:Timetakentofillthetankatflowrateof150
LPM
Table -5.4: CostEstimation
The purpose of cost estimation was to predict the Capital & Resources required to check the financial feasibility of project. For cost estimation we approachedlocal contractorswhohavebeenworkingin the area for past few years & got the following data as shownintable5.4. No Amount
From several group discussions carried out with villagers of Kharwal we were able to understand water scenario of village in summer season and how it has affected the lives of the people. We carried out various surveys to understand the topography and potential aquifers which would help tofulfill the water needs of people. After finding potential water source, water distribution system was designed andcost estimation of entire project was calculated. With the effective use of water from structures like network of Wells and ponds, willimprovetheoverallwateravailabilityof village.This willfacilitatepercolation andrechargethegroundwater tableandhencecontributetotheoverall developmentof village.
International Research Journal of Engineering and Technology (IRJET) e ISSN: 2395 0056
Volume: 09 Issue: 07 | July 2022 www.irjet.net p ISSN: 2395 0072
[1] https://pib.gov.in/newsite/PrintRelease.aspx?relid=1 95635
[2] https://www.census2011.co.in/data/village/550887 kharwal maharashtra.html
[3] Satellite Map of Kharwal Village Source Google Earth. https://earth.google.com/web/@20.06124401,73.43 499503,523.3951873a,433.5617497d,35y,306.64118 108h,0t,0r
[4] http://www.onefivenine.com/india/villages/Nashik/ Trimbak/Kharwal
[5] Vidya et al, “Chondwade village profile and Directed research”CentreforTechnologyAlternativesforRural Areas,IITBombay(2016)
[6] Hemant et al, “Tadwadi Morewadi Piped Drinking Water Scheme Failure Analysis”, Centre for Technology Alternatives for Rural Areas, IIT Bombay (2011)
[7] Amit Kumar et al, “‘Juwi Village Profile & Directed Research at Lok Biradari Prakalp”, Centre for TechnologyAlternativesforRuralAreas,IITBombay (Aug2016)
[8] Pravinkumar et al. “Design and Analysis of Water Distribution Network Using Water GEMS”, International Journal forAdvancedResearchin Science andEngineering.(2018).
[9] Mithileshetal.KopurliBudruk,Nashik, https://drive.google.com/uc?export=download&id=0 B57Hn0ViEcm7SWl4NGltVU1jdk0
[10] https://www.google.com/maps/place/Kharwal,+Mah arashtra+422204/@20.0662998,73.4248202,15z/dat a=!4m5!3m4!1s0x3be7585bda949a3b:0xea7055d785 65d06c!8m2!3d20.0684965!4d73.4327538!5m1!1e4
[11] Global Health Flemming Konradsen, University of Copenhagen.
https://www.worldwaterweek.org/event/9590-20litres-per-person-per-day---interactive
[12] https://thewire.in/government/india-populationgrowth-government-report-2036-projections-urbanmigration
[13] https://goo.gl/maps/C9efg57XtbnnfHtz
[14] ManualonWaterSupplyandTreatment-3rdEdition. Central Public Health and Environmental EngineeringOrganization(CPHEEO).(1999)
[15] Aquifer mapping and management of ground water resources,MinistryofJalShaktiGovernmentofIndia. http://cgwb.gov.in/AQM/NAQUIM_REPORT/Maharsh tra/Nashik.pdf.