International Research Journal of Engineering and Technology (IRJET) e ISSN: 2395 0056

Volume: 09 Issue: 06 | Jun 2022 www.irjet.net p ISSN: 2395 0072
International Research Journal of Engineering and Technology (IRJET) e ISSN: 2395 0056
Volume: 09 Issue: 06 | Jun 2022 www.irjet.net p ISSN: 2395 0072
Sanjana Ramesh1, Bhoomika SM Bhatt2, S Manjunatha3, Deeksha KC4
1,2,3,4 Dept. of Electronics and Communication, Jyothy Institute of Technology, Bangalore, India ***
Abstract - The term Industry 4.0 stands for the fourth industrial revolution which is defined as a new level of organizationandcontrolovertheentirevaluechainofthelife cycle of products. This paper presents a new approach for Data acquisition and Alert systems to facilitate industry 4.0. The paper proposes a system that comprises of Node MCU development kit interfaced with physical sensors which provide information to communicate within the network of machines. C programming is used to program the microcontrollerandthedataproducedisthenanalyzedonan IoT platform. IoT platform plays a vital role in quickly analyzing huge amounts of machine data and making quick decisions in real time.
Key Words: Data acquisition system (DAS), Thermocouple, Proximity sensor, Node MCU, IoT, Blynk
Industrial Internet of Things or IIoT is a technology that deals with bringing control of physical devices over the internet.Theautomationsystemallowsuserstoefficiently control industrial machines over the internet. Acquiring machinedataplaysavitalroleinincreasingtheefficiencyof production in any industry. All industries in the fourth revolution are driven by data. Every machine on a productionlineoranassemblylineisnowcontrolledwith no or minimal human intervention. It is only logical that their output is tapped wireless using a data acquisition system. Data acquisition system refers to the collection of machine data in digital form as accurately, rapidly, and economically as necessary. This paper describes Data AcquisitionandAlertsystem.Dataiscollectedfromsensors and actuators. Apart from sensors, DAS includes communication links, signal processors, computers, databases,dataacquisitionsoftware,etc.Thesesystemsare generally used to collect data from the sensors and take correctivemeasures.Reportsgeneratedaftercollectingthe datahelpustostudyhowthedata isvaryingandtomake preventivedecisionsbasedonthatwhichiscarriedoutwith thehelpoftheIoTplatform"Blynk".
Thescopefordigitalinformationhasgainedhugeimportance astheuseoftheinternetinday to dayapplicationsgrows every day. With the aid of internet based information technology,theprocessofdataacquisition,computation,and delivery of information can be completely automatic. DAS
Factor value:
(Dataacquisitionsystem)referstothecollectionofsoftware andhardwarethatallowsustomeasurephysicalparameters inreal time.Themainprocessinvolvessamplingthesignals that convert the analog value of the sensors installed to a digital value that computers can manipulate. To initiate collecting data from sensors, a microcontroller with the ability to connect to a wireless network is needed. The conceptofInternetofThings(IoT)isusedastheframework todevelopanintegratedinformationsystemthatcancarry outthisentireprocess.Theproposedprojectmakesuseofa thermocouple sensor and proximity sensors which are mountedonanextrudermachinetocollectmachinedata.An extruder machine produces continuous lengths of plastic sections out of a selected ratio of plastic resin. (Extrusion Processisasemi continuousorcontinuousprocessthatcan bedonewithhotorcoldmaterial.Commonmaterialswhich canbeextrudedareceramics,polymers,metals,concrete,and foodstuff).
Proximity sensors detect a metallic object that causes a disruptionintheelectromagneticfieldemanatingfromthe body of the sensor. As the sensor comes in contact with a metal piece attached to annealing rollers, it detects the presence of the electromagnetic field and detects the presenceofmetal.InductiveProximitySensorsworkonthe principleofdetectionofmagneticlossduetoeddycurrents that are produced on a conductive surface by an external magneticfield.Amagneticfieldisgeneratedonthedetection coil, and any changes in the impedance due to the developmentofeddycurrentsgeneratedonametallicobject aredetectedandvaluesarereturned.Theyareveryreliable andhaveahighswitchingratewhichensuresalongerservice life.Thepaperaimstopresenttheapplicationofaninductive proximity sensor in a polymer industry to calculate the productionperhourandthelinespeedoftherollers.This helpsinidentifyingtheproblemareas.Thesensingrangeof inductive proximity is around 1mm 5mm. The authors Christoph Kluser b and Roger Bischofberger Reference[1] describe various parameters that affect the output of proximity sensors such as temperature variations.
Temperaturevariationintherangeof100degreesinfluences theoutputoftheproximitysensor.Becauseproximitysensor worksontheprincipleofmagneticfieldandmagneticfields are influenced by temperature. To overcome this temperature variation, the principle of fully integrated temperature compensation can be used. It is a method of correctinganundesiredinfluenceoftemperature.Ideally,the temperaturecompensationmethodwilleliminatealleffects ofachangeintemperatureonthemeasuredvaluedelivered byasensor.
International Research Journal of Engineering and Technology (IRJET) e ISSN: 2395 0056
Volume: 09 Issue: 06 | Jun 2022 www.irjet.net p ISSN: 2395 0072
Inthisproject,anIIOTsystemisimplementedtomonitor sensor data using the mobile/web based platform named Blynk, which is integrated with the Node MCU micro controllerdevice.Byvalidatingtheresultsofimplementation andtesting,theconceptofdataacquisitionanddataalerting can work well where temperature and rpm (rotations per minute)datacanbeobtainedandprocessedautomaticallyin real timewhenconnectedtotheinternet.UsingtheBLYNK application,onecanaggregate,visualizeandanalyzelivedata streamsonthecloud.Blynkisaplatformwiththeflexibility to run many hardware modules like Arduino, Node MCU, Raspberry Pi, etc. Blynk application is supported on both AndroidandIOSdevices.Thesustainedchoiceofconnection betweenthemicro controllerisWi Fi,cellularnetwork,or Ethernet.Onceaconnectionhasbeenestablishedusingany ofthemodesmentionedbefore,allthedatacanbeviewedon theBlynkapplication.
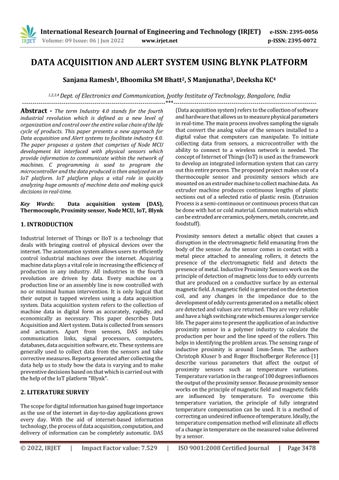
TheBlockdiagraminfigure1explainstheproposedmethod. Therearefivemainunitsintheproposedsystem. Theyare PowerModule,SensingUnit,NodeMCU,IoTPlatform,and MQTT. The power module is used to power the entire system. The project uses SMPS (switching mode power supply)whichcontainsACtoDCconverter,transformer,and bridgerectifiertogetlinearsteady stateoutputvoltage.The sensingunitcontainsmultiplesensorstosensetemperature and rotations. Two K Type thermocouple sensors and an inductive proximity sensor are mounted on the extruder machine. The output of the sensing unit is sent to the microcontroller development board for signal processing anddata visualization. Node MCUisa development board consisting of an ESP8266 micro controller Wi Fi enabled chip. The ESP8266 is a low cost Wi Fi chip developed by EspressifSystems.Itcollectsthesignaldatafromthesensors andprocessesthemasprogrammed.Oncesignalprocessing iscomplete,thedataissenttotheIoTplatformtostoreand visualizeit.NodeMCUtriggersanalertwhencertainvalues arereceivedfromthesensors,thesevaluesareanindication ofimportantinformationaboutthemachinerythatrequires immediateattention.MQTTisamessagingprotocolthatis used to send alerts. MQTT is a lightweight subscriber messaging protocol designed for applications in low bandwidth, high latency, unreliable networks. MQTT's features make it an excellent option for sending high volumesofsensormessagestoanalyticsplatformsandcloud solutions.
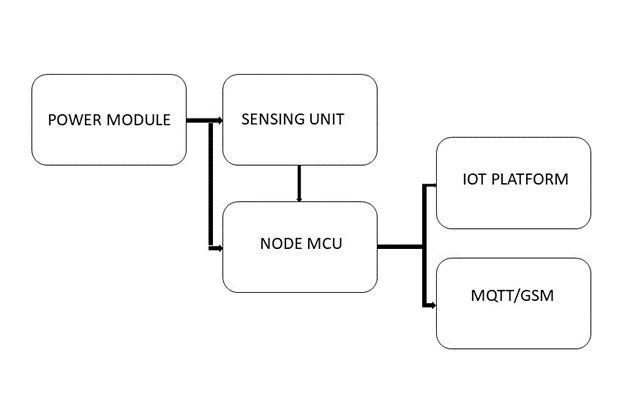
Theflowchartbeginswithtakingtheinputsfromtheuser (denierandnumberoftapes)andinitializingavariable"i"to 0. The microcontroller then reads the values from the proximityandtemperaturesensor.Thecodeflowsfurtherto start the timer followed by a counter. Every time the proximity sensor detects the target the counter is incremented.Ifthetimerexceeds60000mstheproduction perminuteiscalculatedusingacountervalueandaformula thatisdesignedtocalculateproduction.Thisisaddedtothe variable"finalproduction"everyminute.Thevariable“i”is incrementedandthecounterisreset.Ifvariable"i"exceeds 59, “i” is reset to 0, final production is sent to the BLYNK platform and then final production is reset. Similarly, the microcontrollerreadstemperatureatthebarrelzone and annealing rollers with the help of a thermocouple. Temperaturedata issentto BLYNK.Blynkisusedtosend alertsintheformofpushnotificationsandSMSbasedon
International Research Journal of Engineering and Technology (IRJET) e ISSN: 2395 0056
Volume: 09 Issue: 06 | Jun 2022 www.irjet.net p ISSN: 2395 0072
triggerconditionswhenthemachinereachesnon optimum temperatureconditions.
The areas of interest in the machinery for this experimentation are the heating barrel zones and the annealing rollers placed at the initial and end unit of the extruder machine respectively. Solid raw materials are pouredinapredefinedratiointotheheatingbarrelzones,a thermocoupleisplacedinthebarrel zonestomonitorthe temperaturerequiredtoturnthesolidrawmaterialsintoa liquidstate.Variationoftemperatureintheheatingcoilsof the barrel zone greatly affects the quality of polymers produced.Itisaconventionalpracticetoattaintheoptimal temperaturebypreheatingthebarrelsandthenallowingthe inflow of raw materials. Having a 6' K type thermocouple installed at this unit allows constant monitoring of temperaturedirectlyfromtheBlynkcloudplatform.Having anadditionaladd oninstalledtothisplatformprovidedthe scopetosendimportantalertsinformingaboutimportant temperature data. Similarly, a second thermocouple is installedattheannealingrollerspresentattheendunit,the polymersarestretchedduetotheconstanttensionprovided bycontinuouslyrotatingontherollers.Therollersarefilled with hot oil which aids the stretching of the fibers of the polymer.Itisofforemostimportancethatthetemperatureis uniformly maintained in these rollers, thus a 12' thermocouple was placed to observe the oil temperature inside these rollers. The setup continuously monitors the above saidparametersandcollectsalltheproductiondata automatically.Datacollectedcanbeviewedandanalyzedat any given point, this gives a great opportunity for the industrytounderstandtheareasinwhichtheycanimprove.
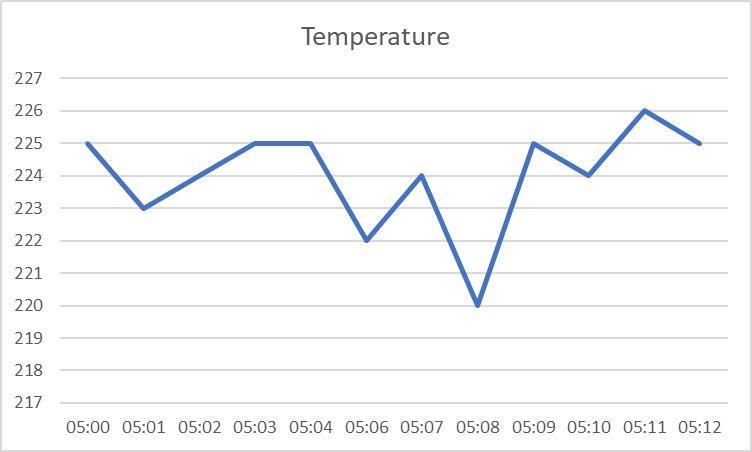
Figure 3 depicts the temperature vs time graph. The temperature varies according to the temperature of the barrelzone.Asseeninthefigure,fromtime5:00pmto5:11 pm the temperatures are varied only plus or minus 2 degrees, this tells us that there is not much variation in temperaturesatboththebarrelzoneandannealingrollers oftheextrudermachine Butwhenthistemperatureexceeds theoperatingrange,analertissenttotheclient.
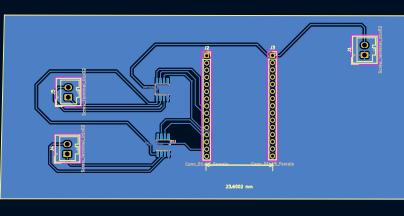
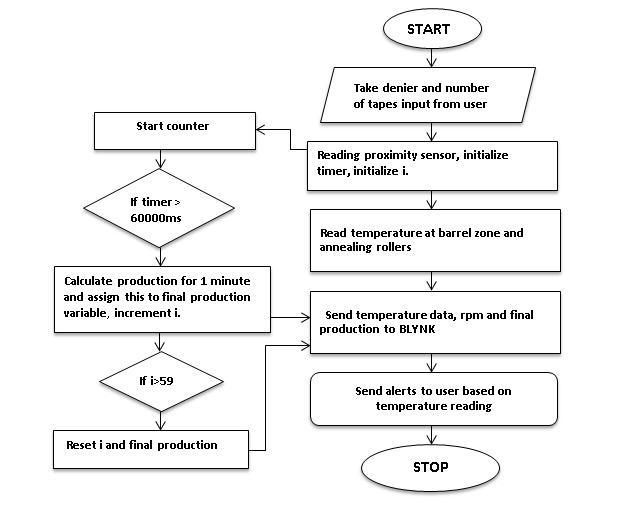
PCBdesigningisonemoresegmentoftheproject.Aprinted circuit board design brings all the electronic components togetherusedintheimplementationoftheproject.APCB designwaschosentoeliminatethepoint to pointwiringand prevent short circuits. It can be designed in a way to mechanically support and electrically connect all the components.Whennoactivedevicessuchascapacitorsand resistorsareincludedontheboardandtheboardconsists only of copper tracks and features manufactured on the substrateboard,itisreferredtoasaPrintedWiringBoard (PWB).FordesigningthePCB,KiCADsoftwareisused.The PCB design feature with Node MCU microcontroller incorporates the MAX6675 modules with two thermocouples. AnOLEDdisplayisincludedtodisplaythe value of temperature and if this value is higher than a set limit,analertissenttothefactoryworkertoswitchoffthe machine.Asmentionedinsection4,thisisdoneusingthe BLYNKplatform.
International Research Journal of Engineering and Technology (IRJET) e ISSN: 2395 0056
Volume: 09 Issue: 06 | Jun 2022 www.irjet.net p ISSN: 2395 0072
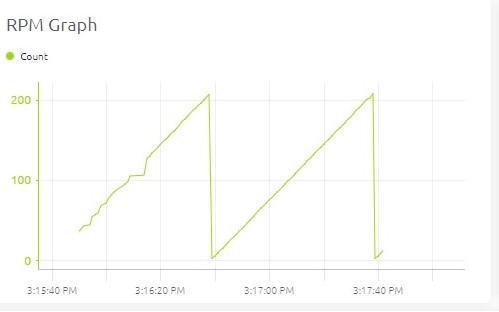
Table 1: RelationshipbetweenRPMandProductionper minute
Timestamp (pm) RPM Production per minute (in Kg)
5:00 193
5:01 197 2.34
5:02 200 2.38
5:03 220 2.62
5:04 220 2.62
5:05 220 2.62
5:06 220 2.62
5:07 219 2.60
5:08 220 2.62
5:09 220 2.62
5:10 220 2.62
5:11 222
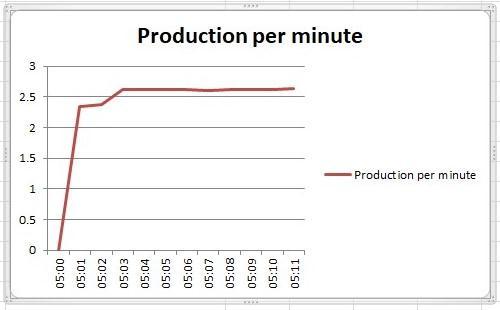
Table1describestherelationshipbetweentherotationsper minute(rpm)oftheannealingrollersandtheproductionper minute.Therpmisvariedbytheoperatorsinthecompany according to the physical parameters of the raw materials used for production and this value will not be constant throughout,hencerpmiscalculatedconstantly.Production per minute is calculated according to changes in rpm, this productionperminuteforonehourisaddedupwhichgives productionperhour.Intheabovegraph,thetimestamptaken isfrom5:00pmto5:11pm,tocalculatetheproductionper minuteforaperiodof10minutes.Theproductionperminute remainsconstantthroughout.Thisiscollectedforonehour andaddeduptogetproductionperhour.
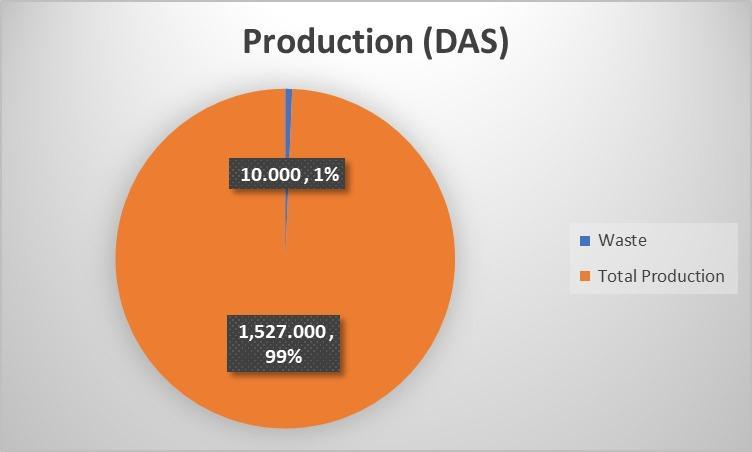
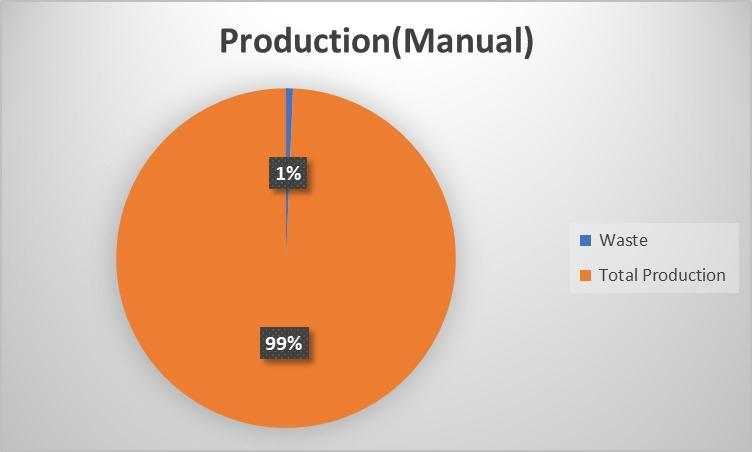
Abetatestwasconductedontheplant.ThegraphsinFigures 6 and 7 describe the accuracy of the DAS system when compared to the manual calculation system. The piechart depicts the net production including the wastage as calculatedmanuallyandfromthedataacquisitionsystem. The orange portion of the pie chart depicts the net productionandtheblueportionindicatesthetotalwastage ascalculatedfromthefactory.
It is seen that the data acquisition system (DAS) has an accuracy of 98 percent with a total production of 1527 kg whencalculatedfor9hoursand36minutes.Thebetatestis successful indeterminingtheproductionperhourandthe Data Acquisition System (DAS) will be an effective way to calculatetheproductiondailyinsteadofmanuallycalculating theproductionperhourvaluesandthetotalproduction.The projectaimstoautomatethissectionofcalculatingthenet production.
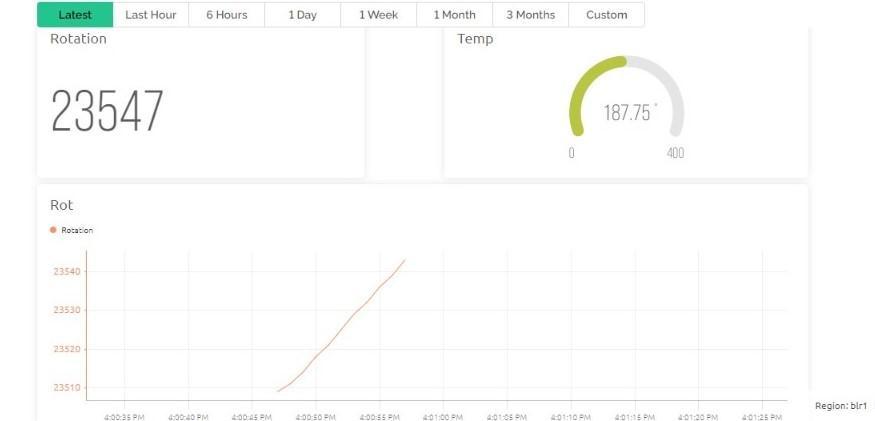
Anotherobjectiveoftheprojectistosendalertstothefactory workerwhenanoptimumtemperatureisreached.Usingthe BLYNKeventsectionapushnotification/SMS(shortmessage service)canbesenttotheworkeralertinghimwithacustom message.
Thefigure6showstheoutputofthetemperaturesensor.The thermocouple placed in the annealing rollers shows a temperatureof187.75degrees.Ifthetemperaturereaches above250degrees,pushnotificationoranSMSissenttothe factoryworker.
International Research Journal of Engineering and Technology (IRJET) e ISSN: 2395 0056
Volume: 09 Issue: 06 | Jun 2022 www.irjet.net p ISSN: 2395 0072
Theerrorsinthemeasurementsareavoidedasthereisno humanintervention.Thesystemiscost effectivewithagood amountofaccuracy.
We would like to show our gratitude to Kalyani Polymers PrivateLimited,forprovidingthisopportunitytoworkon the project and for funding the project. We would like to thank our HOD Dr. K Chandrasekhar and our guide Mr. ChandrashekarBMfortheirconstantsupportandguidance.
[1] PavelKej´ıka,ChristophKluserb,RogerBischofberger c, Rade S.M. Young, “A low cost inductive proximity sensor for industrial applications”, The Technical Writer’sHandbook.MillValley,CA:UniversityScience, 1989.
[2] Hongyu Pei Breivold, Kristian SandströmK. Elissa, “Internet of Things for Industrial Automation ChallengesandTechnicalSolutions”,unpublished.
[3] V.AlcácerV.Cruz Machado,”ScanningtheIndustry4.0: ALiteratureReviewonTechnologiesforManufacturing Systems”
[4] DavidNettikadan1andSubodhRaj,“SmartCommunity Monitoring System using BLYNK IoT Platform” Internation journal of applied engineering research, 2018
[5] D.MourtzisE.VlachouN.Milas, “Industrial Big Data as a resultofIoTadoptioninManufacturing”,2016,Elsevier.
[6] Vishal Anand; Varsha Singh; Vinay Kumar Ladwal, “StudyonPCBDesigningProblemsandtheirSolutions” , ICPECA,Nov.2019
[7] HughBoyes,BilHallaq,JoeCunningham,TimWatson,” The industrial internet of things (IIoT): An analysis framework”.October2018,Elsevier
The Data Acquisition system using the Blynk platform is successfully implemented on the extruder machine. DAS captures the rotation count of rollers and also the temperatures at two different locations. The count along withotherparameterslikedenierandnumberoftapeswhen applied to the industry formula gives us the production. TemperaturesensorsalongwiththeBLYNKplatformalert theclientiftheoptimumtemperatureexceedsthelimitso theycantakenecessarycorrectivemeasures.
Thesystemstoresandanalysesthedata.Italsoservesthe purpose of real time data plotting that helps analyze productionandtakeprecautionarymeasures.
[8] JacquesJansen&AltavanderMerwe,“AFrameworkfor IndustrialInternetofThings”
[9] MohdMuntjir,MohdRahul,HeshamA.Alhumyani,”An AnalysisofInternetofThings(IoT):NovelArchitectures, ModernApplications,SecurityAspectsandFutureScope with Latest Case Studies” . International Journal of Engineering Research & Technology (IJERT), June 2017
[10] Keisuke Koyama; Makoto Shimojo; Taku Senoo; Masatoshi Ishikawa, “High Speed High Precision Proximity Sensor for Detection of Tilt, Distance, and Contact”.June2018,IEEEroboticsautomationandletter