International Research Journal of Engineering and Technology (IRJET) e ISSN: 2395 0056

International Research Journal of Engineering and Technology (IRJET) e ISSN: 2395 0056
1 Assistant Professor,Department of Environmental Science, Deogiri College, Aurangabad
2 Assistant Professor, Department of Environmental Science, Deogiri College, Aurangabad. 3 PG Student,Department of Environmental Science, Deogiri College, Aurangabad. ***
Abstract - Groundwater is a significant water resource accounts for 30% of the globes freshwater. 97% of extracted groundwater is useful for drinking and human consumption. The aim of present study is to analyze the scientific production which deals with the study of groundwater. The maximum value of pH was observed in the month of February and minimum value was from June month and the average value was 7.5. The maximum value of temperature was observed in the month of May was 28.3 0C and minimum value was 25.3 0C from March month and the average value was 26.9 0C. The maximum value of Electrical conductivity was observed in the month of February was 75.6 µS/cm and minimum value was 56.9 µS/cm from March month and the average value of Electrical conductivity was 67.83 µS/cm. The maximum value of DO was observed in the month of January i.e. 13.6 mg/litre and minimum value was from May month and the average value was 11.56 mg/litre. The maximum value of BOD was observed in the month of January i.e. 27.9 and minimum value was 16.3mg/litre from April month and the average value was 22.53mg/litre. The maximum value of COD was observed in the month of April was.13.2andminimumvalue was9.2fromJanuarymonthand the average value was 11.2 mg/litre. The maximum value of TDS was observed in the month of January was 358 and minimum value was 289 mg/litre from May month and the average value was 327 mg/litre. The maximum value of Turbidity was observed in the month of June i.e. 6.1 and minimum value was from February month and the average valuewas3.6NTU. Thepresentresearchstudyaimstoidentify the proper areas of water pumping for drinking as well as agriculturalharvestinthestudyregion. Industrializationand Urbanization, other manmade activities which affect the quality of groundwater.
Key Words: groundwater, physicochemical,parameters, water,quality
Groundwateristhemostimportantnaturalresourceforthe human consumption and support of habitat and for maintainingthefeatureofbaseflowtorivercourses,while itsqualityisnecessarytoensuresustainablesafeexploitof theresourcesforallthepurposes.Surfacewateristhemain resource for drinking and domestic purposes, its scarcity
becauseofindustrialdevelopmentandpopulationgrowth;it makespeoplebyforcingtousegroundwaterfortheportable anddomesticusesinurbanareasinAurangabad.Waterhave many applications and every organism need it, a study of water from different the aspects which becomes essential (Potadar et al., 2021; Padalkar and Kumar, 2018).The groundwaterqualityistheimportanceofeveryoneofthose proceduresandresponsesthatfollowonwaterfromthetiny itisprimarilygathereduntil thetimewhichisstoredin a well that is regularly controlled by numerous physicochemical attributes. Groundwater plays a very importantroleinpublicwatersuppliesaroundtheworld. Universally,morethantwobillionpeoplesaredependonthe groundwaterfortheirdailyneedofwatersupplyandmore than half of the world’s population depends on the groundwaterfordrinkingpurpose(Anthony;2006).Atthe same time the amount of groundwater consumption has been rapidly increasing may achieving sustainable development of groundwater resources is one of the significantobjectivesforthefutureofnations.Groundwater is the universal largest distributed house of fresh water which is central to sustaining the ecological systems and human alteration to the climate change. Sustainability management of the groundwater resources is particularly important,with50%oftheglobaldrinkingwaterand43% ofirrigationsourcedfromtheaquifers.Duetotherigorous groundwater exploitation, saltwater interference and the land subsidence may become serious concerns in some of the areas among the other environmental threats and the geological hazards.Wateristhelargestuniversal liquidof theEarth,itisveryimportanttoallthelifeforms.Itisbest dispersionmediumforallthebiochemicalreactionsofthe living process on the earth. Water is an essential nutrient andisanessentialcomponentofeverycell,tissue,andthe organ. Water has ability to dissolve organic as well as inorganiccompoundsinit;hencewateriscalledasuniversal solvent(Potadar et al.,2021;JadhavandJadhav,2017).Due totheseveredestructionof waterquality,availablewater resourcesaremoreandmorebecomingnotsuitableoreven harmfulforthehumanconsumption(Saraswat et al.2016; Vorosmartyetal.2000).Groundwaterpollutionisfoundina rangeofaquifersofunconsolidatedsedimentedregionsto bedrocks (Kumar et al. 2010; Smedley and Kinniburgh 2002). Groundwater ontamination by trace elements has turnedrecentlyoutasamainconcernforthepolicyplanners inthecountrieslikeIndiaandinthesubcontinentalzones
Volume: 09 Issue: 06 | Jun 2022 www.irjet.net p ISSN: 2395 0072 © 2022, IRJET | Impact Factor value: 7.529 | ISO 9001:2008 Certified Journal | Page3291
International Research Journal of Engineering and Technology (IRJET) e ISSN: 2395 0056
Volume: 09 Issue: 06 | Jun 2022 www.irjet.net p ISSN: 2395 0072
(Mahanta et al. 2015; Meliker et al.2008).Therefore the establishmentofnumbersillegalwellsandthelackofmeans toprotectthegroundwaterwellsfromdifferentpollutants leadtoreduceofgroundwaterstorageanditspollutionby pollutants and contaminations which coming from the varioussourceslikeindustrialeffluentandsewagewaterof householdbeforeuseofgroundwaterwehavetoassessits quality to decide that the water suitable for drinking and domesticuses,sowehavebeenselectedrandomlysamples from Aurangabad city. Physicochemical parameters and comparingtheobtainedvalueswiththestandardvalueon thebasisofWHO,BISandICMR guidelines.Ground water becomepollutedduetotheindustrialactivitiesandhuman uses and pollutants discharge into ground Water and mix withitthereforethecharacteristicsandpropertiesofwater change and water become unsuitable for Drinking water (Bishnoi,andMalik(2008).Groundwaterisoneofthemost important sources of water for drinking, irrigation and national purposes in urban areas as well as city. Groundwater pollution is the main environmental and ecological issues in the current era of globe (Vodela etal. 1997;KanakMohariretal.2017).
In the present study, Total eight samples were collected randomlyfromthevariouslocationsinAurangabadcityin thestudyarea,inlastNovember2021(winterseason)and followed by all recommendations for sampling and preservationofsamples(NEERI,2007;APHA.,2000),forthe sampling, bore well samples were taken by a pump which found in citizens buildings and from the public bore well whichisfoundnearthehousestoflowthewaterforatleast fiveminutes.Therequiredvolumesofwaterwerecollectedin theplasticcontainerdirectly.
Materials and methods for physico- chemical analysis of groundwater samples accredited in the study work are according to APHA (2000), WHO (1996 Manual),
Temperature (T) has taken by the mercury thermometer (APHA,2000).ThevalueofpHwasmeasuredatthetimeof samplecollectionatlocationsbyportablepHmeteroperated bybatteryandbyuseofreadybuffersolutiontocalibratepH meterandotherparameterswereanalyzedinthelaboratory within the 24 hours to 8 days. Electrical conductivity (EC) measurement (Saxena,1987) gives the rapidandpractical estimationofthevarianceindissolvedmineralcontentsofa waterbody(NEERI,2007).Itismeasuredwiththehelpofa conductivity meter having a conductance cell which containing electrodes of platinum coated with carbon. Dissolved Oxygen (DO) analyzed by winklerazide modification titrimetric (APHA,2000) Chemical Oxygen Demand (COD) analyzed by the open reflux method Total dissolvedsolid(TDS)contentdeterminedastheresidueleft aftertheevaporationoffilteredsample,TDSalsocalculated by the summation of total suspended solid TSS with total solid.ThechemicalsmaterialswerepreparedwithARgrade and Equivalent grade. Glassware and the instruments that usedforwaterqualityparameterlikeflamephotometerand spectrophotometerwerecalibratedatroomtemperature.
Table -1: Figure-1: Estimation of Groundwater
from study
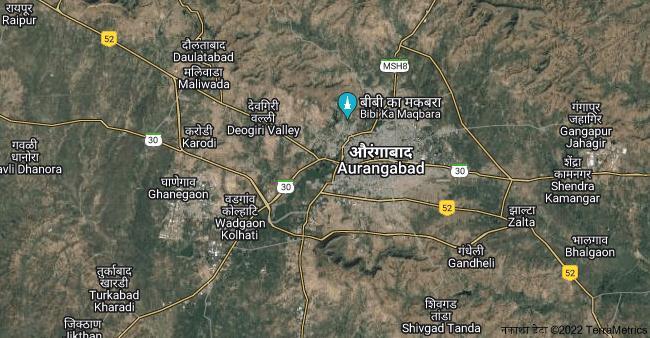
Fig.1: Showing Study area map.
Theanalysisofgroundwaterprovidestheinformationabout sourceandareaofgroundwaterpollutionanddetermines the utility for a variety of purposes. Depends upon some specific standards of the groundwater quality may be
International Research Journal of Engineering and Technology (IRJET) e ISSN: 2395 0056
Volume: 09 Issue: 06 | Jun 2022 www.irjet.net p ISSN: 2395 0072
determined for its suitability for various purposes. In present study the standards of WHO (Choi et.al, 2005), is utilized to decide the potability of the groundwater for drinking purpose (Abhay et.al; 2018). Various parameter
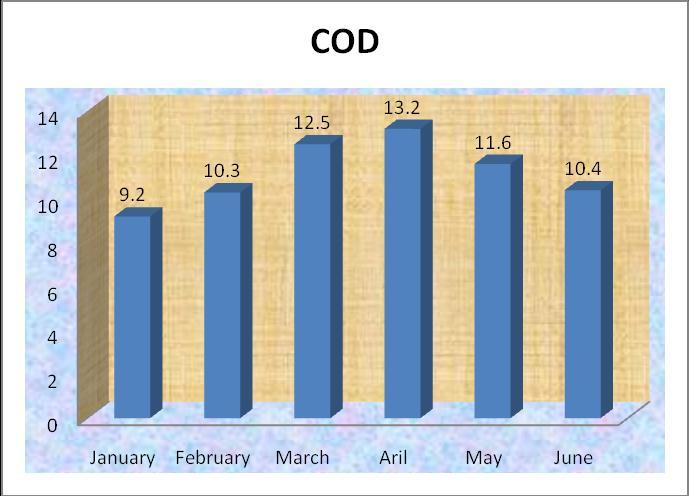
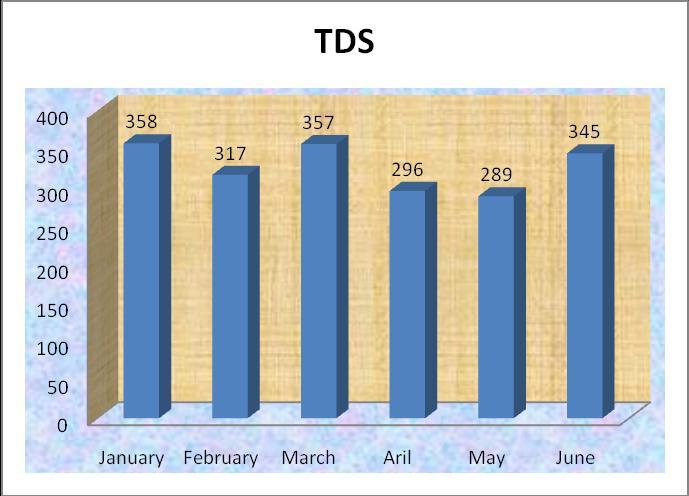
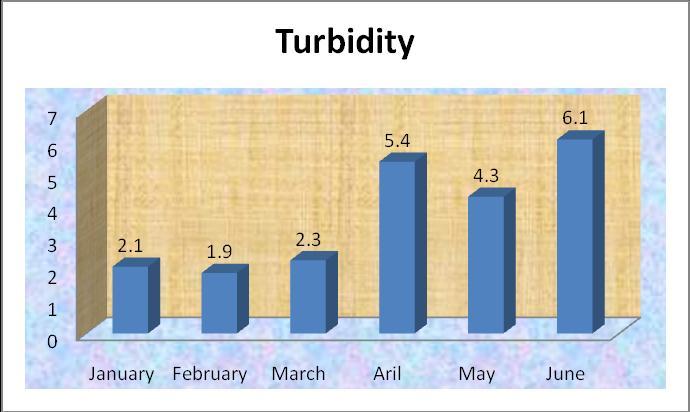
indices for rating the quality of water of study area.pH of groundwater value was found highest in the month of February i.e. 8.3 and lowest in the month of June i.e.6.8 respectively.TheaveragepHvaluewas7.5.Theaquiferin the study area is mostly vesicular basalt which imparts alkalinenatureofwater.ThesafelimitofpHliesbetween6.5 and8.5.Theslightacidicnatureofafewsamplesindicates impactofindustrialinfluenceonthequalityofgroundwater. TheTemperatureofgroundwatervaluewashighestinthe monthofMayi.e.28.3 oCandlowestinthemonthofMarch i.e.25.3oCrespectively.TheaverageTemperaturevaluewas foundi.e.26.9oC.TheElectricalconductivityofgroundwater valuewashighestinthemonthofFebruaryi.e.75.6µS/cm and lowest in the month of March i.e. 25.3 µS/cm respectively.TheaverageECvaluewasfoundi.e.67.8µS/cm (Davis and Wiest; 1996).Dissolved Oxygen (DO) of groundwater value was found highest in the month of Januaryi.e.13.6mg/landlowestinthemonthofMayi.e.8.9 mg/l respectively. The average DO value was 11.5.BOD of groundwater value was found highest in the month of January i.e. 27.9 mg/l and lowest in the month of April i.e.16.3mg/lrespectively.TheaverageBODvaluewas22.5 mg/l.COD of groundwater value was found highest in the month of April i.e. 13.2 mg/l and lowest in the month of Januaryi.e.9.2mg/lrespectively.TheaverageCODvaluewas 11.2mg/l.TDSofgroundwatervaluewasfoundhighest in themonthofJanuaryi.e.358mg/l andlowestinthemonth ofMayi.e.289mg/lrespectively.TheaverageTDSvaluewas 327mg/l.Turbidityofgroundwatervaluewasfoundhighest inthemonthofJunei.e.6.1NTU andlowestinthemonthof February i.e.1.9 NTU respectively. The average Turbidity valuewas3.6NTU.
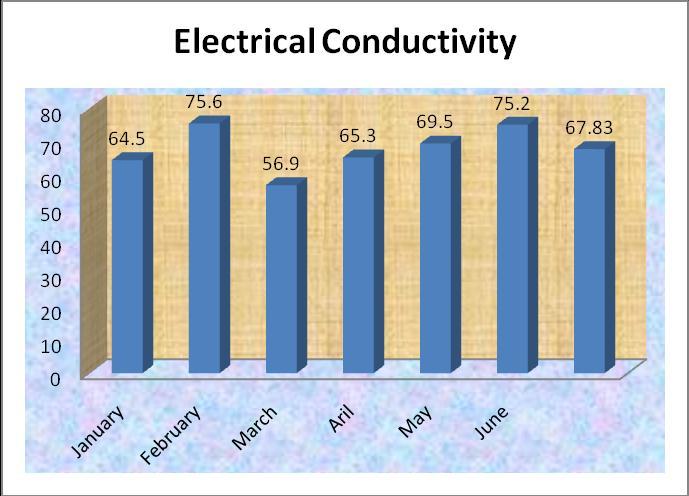
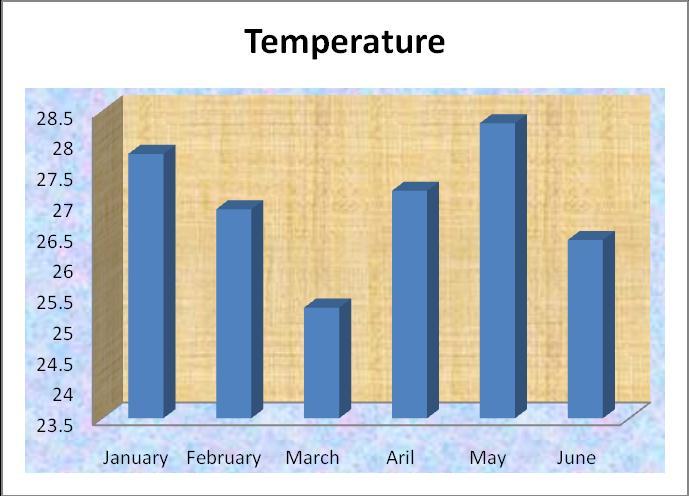
Fig.4: Values indicating monthly variation in EC
Fig.2: Values indicating monthly variation in pH
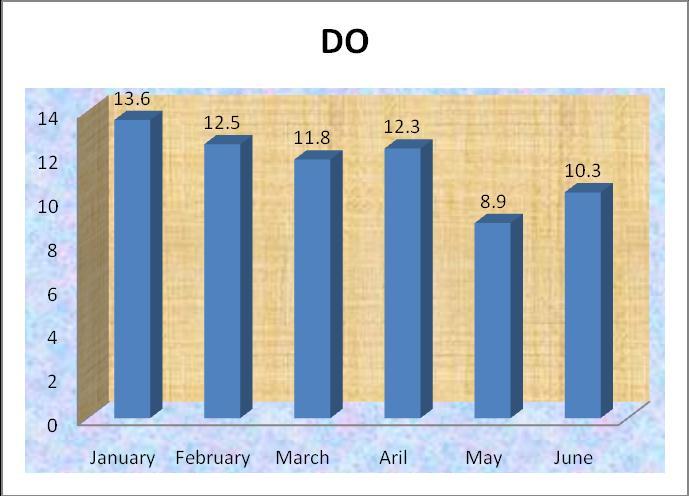
Fig.5: Values indicating monthly variation in DO
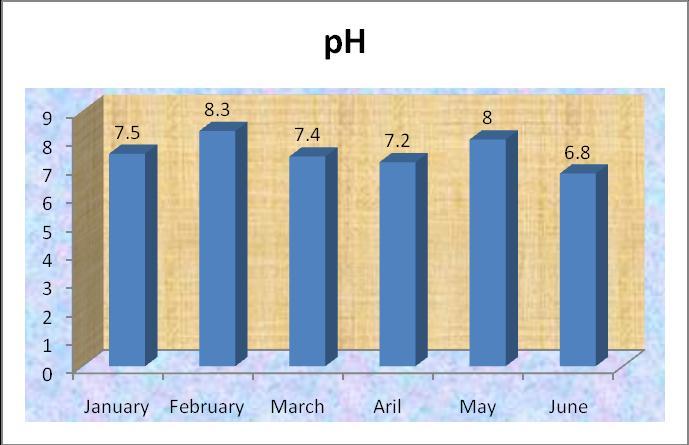
Thegroundwatersamplesinpresentstudyaresignificantly detrimentaltothehumanbeingsanditmayuseindomestic purposeandoccasionallyinportablepurposedependupon theionscontentsinwater.ThemaximumvalueofpHwas observedinthemonthofFebruaryandminimumvaluewas from June month and the average value was 7.5. The maximumvalueoftemperaturewasobservedinthemonth of May was 28.3 0C and minimum value was 25.3 0C from March month and the average value was 26.9 0C. The maximumvalueofElectricalconductivitywasobservedin themonthofFebruarywas75.6µS/cmandminimumvalue was56.9µS/cmfromMarchmonthandtheaveragevalueof Electrical conductivity was 67.83 µS/cm. The maximum valueofDOwasobservedinthemonthofJanuaryi.e.13.6 mg/litreandminimumvaluewasfromMaymonthandthe average value was 11.56 mg/litre. The maximum value of BOD was observed in the month of January i.e. 27.9 and minimumvaluewas16.3mg/litrefromAprilmonthandthe average value was 22.53mg/litre. The maximum value of COD was observed in the month of April was.13.2 and minimumvaluewas9.2fromJanuarymonthandtheaverage value was 11.2 mg/litre. The maximum value of TDS was observed in the month of January was 358 and minimum value was 289 mg/litre from May month and the average value was 327 mg/litre. The maximum value of Turbidity was observed in the month of June i.e. 6.1 and minimum valuewasfromFebruary monthandtheaveragevaluewas 3.6 NTU.The obtained results we can conclude that groundwater is polluted and its impacts shows on human healthwillbesevereandleadtomanydiseasesforhuman and the high values indicates that the load of pollution occurredduetotheindustrial,miningandhumanactivities sothegroundwatershouldnotbeusedindrinkingpurpose aswellasdomesticpurpose.

International Research Journal of Engineering and Technology (IRJET) e ISSN: 2395 0056 Volume: 09 Issue: 06 | Jun 2022 www.irjet.net p ISSN: 2395 0072
[1] DavisS.N.andR.J.M.Dewiest,(1967):Hydrogeology, JohnWileyandSons,Inc.NewYork.
[2] WHO, (1996): Guidelines for Drinking water Quality WHO,BackgrounddocumentfordevelopmentChloride inDrinking water,2nded.Vol.2,Geneva.
[3] Saxena, M.M., (1987): Environmental Analysis water, soilandair.,AgroBotanicalPublishers(India).
[4] Bishnoi,M.andMalik,R.,(2008):Groundwaterquality inenvironmentallydegradedlocalitiesofPanipatcity, India.Environ.Biol.29(6).
[5] Potadar Vishnu R, Jogdand Onkar K, Gawade Mahesh 2021):BODReductionofIndustrialWastewateratMIDC Waluj Area, Aurangabad, Maharashtra (India). InternationalJournalofInnovativeResearchinScience, EngineeringandTechnology(IJIRSET)Volume10,Issue 8,pp11417 11422.E ISSN:2319 8753,p ISSN:2347 6710.
[6] PadalkarAshwiniV.andRakeshKumar(2018):Common effluenttreatmentplant(CETP):Reliabilityanalysisand performanceevaluation.WaterScienceandEngineering 2018,11(3):205 213.
[7] Anthony, E. (2006): Groundwater Exploration and Management using Geophysics: Northern Region of IJSART Volume 8 Issue 6 JUNE 2022 ISSN [ONLINE]: 2395 1052 Page | 578 www.ijsart.com Ghana, PhD Thesis, Brandenburg Technical University of Cottbus, Germany,pp.186.
[8] Choi,B.Y.,Yun,S.T.,Yu,S.Y.,Lee,P.K.,Park,S.S.,Chae, G. T., and Mayer, B. (2005). Hydrochemistry of urban groundwaterinSeoul,SouthKorea:effectsofland use andpollutantrecharge.EnvironmentalGeology,48(8), 979 990.
[9] Abhay M. Varade,R. O. Yenkie,Rahul R. Shende,R. B. Golekar,V. M. Wagh,H. W. Khandare (2018) : Assessment of Water Quality for the Groundwater Resources of Urbanized Part of the Nagpur District, Maharashtra (India), American Journal of Water Resources.,6(3),89 111.DOI:10.12691/ajwr 6 3 1.
[10] Davis Stanley Nelson, Wiest Roger J. M. De (1966). KriegerPublishingCompany,1966 Science 463p.
[11] MoharirK,PandeC,PatilS(2017)Inversemodelingof aquifer parameters in basaltic rock with the help of pumpingtestmethodusingMODFLOWsoftware.Geosci Front Elsevier J,vol 8, pp. 1 13.ImpactFactor 4.256, ISSN:1674 9871.
[12] Vodela JK, Renden JA, Lenz SD, Mc Elhenney WH, KemppainenBW(1997)Drinkingwatercontaminants (arsenic,cadmium,lead,benzeneandtrichloroethylene) .1.Interactionofcontaminantswithnutritionalstatus ongeneralperformanceandimmunefunctioninbroiler chickens.PoultSci 76:1474 1492.
[13] APHA (2000) Standard Methods for the Analysis of WaterandWastewater.15thEdition,AmericanPublic Health Association and Water Pollution Control Federation,WashingtonDC,12 56.
© 2022, IRJET | Impact Factor value: 7.529 | ISO 9001:2008 Certified Journal | Page3295