International Research Journal of Engineering and Technology (IRJET) e-ISSN: 2395-0056
Volume: 09 Issue: 06 | Jun 2022 www.irjet.net p-ISSN: 2395-0072
International Research Journal of Engineering and Technology (IRJET) e-ISSN: 2395-0056
Volume: 09 Issue: 06 | Jun 2022 www.irjet.net p-ISSN: 2395-0072
A. Chandrakanth1 , Dr. Md. Aleem pasha2, T.N. Aditya3 K. Gurubrahmam4 1,3,4 Assistant Professor, Dept. of Mech. Engg., CBIT, Hyderabad, Telangana, India 2Associate Professor, Dept. of Mech. Engg., CBIT, Hyderabad, Telangana, India ***
Abstract The Electrical discharge machining is a widely used Precision manufacturing process. The EDM process involves a controlled erosion of electrically conductive materials by initiation of repetitive spark discharge between electrode tool and work piece, separated by a small gap of called as spark gap. In the current work, optimization of various process parameters to increase Materialremovalrate and to decrease tool wear rate is done using Taguchi’s method. Coppers is used as tool materials and SS310 is used as work piece material. The process parameters selectedaredischarge current and spark gap. The output characteristics measured are Material Removal rate and tool wear rate. A full factorial design of experiment is used to find the influence of process parameters on Metal Removal Rate and tool wear rate. The main effects and interaction effects are plotted. From the experiments it was found that discharge current is the most influencing factors on MRR and TWR using copper as the electrode.
Key Words: EDM: Electron Discharge Machining; MRR: Material Removal Rate; SS: Stainless steel; TWR: Tool Wear Rate
Electrical discharge machining (EDM) has long been the answer for high accuracy, demanding machining applicationswhereconventionalmetalremovalisdifficultor impossible. Known by many othernames,including spark machining, arc machining and (inaccurately) burning, the EDM process is conceptually very simple: an electrical currentpassbetweenanelectrodeandaworkpiecewhich areseparatedbyadielectricliquid.Thedielectricfluidacts asanelectricalinsulatorunlessenoughvoltageisappliedto bringittoitsionizationpoint,whenitbecomesanelectrical conductor. Theresultingspark dischargeerodesthework piecetoformadesiredfinalshape.
EDMhastheabilitytomachinecomplexshapesinveryhard metals.ThemostcommonuseofEDMisinmachiningdies, toolsandmouldsmadeofhardenedsteel,tungstencarbide, high speed steel and other work piece materials that are difficult to machine by "traditional" methods. Because of technicaladvancesinelectrodewear,accuraciesandspeed, EDMhasreplacedmanyofthetraditionalprocesses.Another factor contributing to the growing use of EDM is the expansionoftheworkenvelope,particularlywhenitcomes toheightsandtapers.
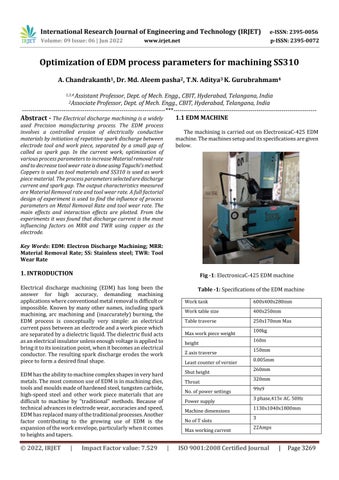
ThemachiningiscarriedoutonElectronicaC 425EDM machine.Themachinessetupanditsspecificationsaregiven below
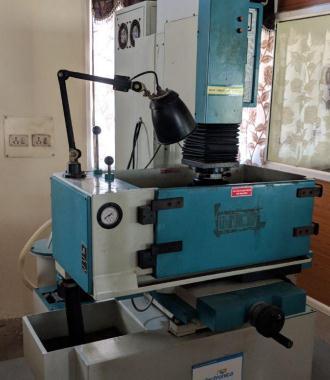
Fig -1:ElectronicaC-425EDMmachine
Table 1: SpecificationsoftheEDMmachine
Worktank 600x400x280mm
Worktablesize 400x250mm Tabletraverse 250x170mmMax
Maxworkpieceweight 100kg height 160m
Zaxistraverse 150mm
Leastcounterofvernier 0005mm
Shutheight 260mm
Throat 320mm
No.ofpowersettings 99x9
Powersupply 3phase,415vAC 50Hz
Machinedimensions 1130x1040x1800mm
NoofTslots 3 Maxworkingcurrent 22Amps
© 2022, IRJET | Impact Factor value: 7.529 | ISO 9001:2008 Certified Journal |

International Research Journal of Engineering and Technology (IRJET) e ISSN: 2395 0056
Volume: 09 Issue: 06 | Jun 2022 www.irjet.net p ISSN: 2395 0072
Inthepresentwork,optimizationoftheinputparametersfor various output parameters are done using Design of Experiments. Two input parameters at three levels are considered for the experiment. The input process parametersandtheirlevelsareshowninthetablebelow
Control parameters Level1 Level 2 Level 3
Discharge current (Amp) 4 8 12 Spark gap (mm) 0.05 0.1 0.15
Theexperimentsareconductedusingfullfactorialdesign by selecting L9 orthogonal array. The experiments are designed using Taguchi’s method. The experiments were conductedondiesinkelectricdischargemachineasshownin Fig.1whichconsistaworktable,aservocontrolsystemanda dielectricsupplysystem.Themachinehascurrentsettingsup to22A.TheexperimentsareconductedonAISI310material withdimensionsare100mmx25mmx5mm.Workpiece material properties are: Hardness (HRC)= 43 45, density (g/cm3)= 8.16, Ultimate tensile strength (Kg/mm2) =85, Elongation % =3. The tool material used is copper with density896gm/cm3andthermalconductivityof386w/mk andthemachiningisdonewithstraight polarity.Spooilis used as the dielectric fluid and the experiments were performed for a particular set of input parameters. The numberofexperimentsandinputlevelsaredecidedbasedon thedesignofexperimentsandtheinputparametersandtheir levels.TheMRRandTWRarecalculatedusingdigitalbalance of accuracy 1mg and the machining time is using digital watch of accuracy 1 microsecond. The weight of the workpieceandtoolbeforemachiningisrecordedusingthe digital balance. The total machining time is also recorded usingadigitalwatch.Theinputparametersandtheirlevels areshowninTable 3.
Table 3: Processparametersselectedforexperimentation
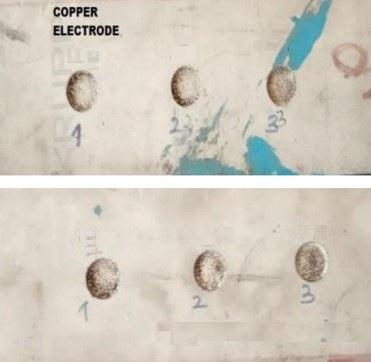
The machining samples after the experimentation are markedforvariousprocessparameters.The samplesafter themachiningprocessareshowninthefig.2
Fig 2:Samplesaftertheexperimentation
Theoutputvaluesarecalculatedbymeasuringtheweightof the workpiece and tool after the machining process. The differenceintheweightofthesamplesisusedtocalculate MRRandTWR.Thecalculatedoutputparametersareshown inthetable 4below.
Table 4: outputresponsesrecordedafterexperimentation
Experi ment No.
Discharg e current (Amp)
Spark gap (mm)
MRR mm3/min TWR mm3/min 1 4 0.05 9.677 4.650 2 4 0.10 10.193 5.580 3 4 0.15 12.534 5.391 4 8 0.05 4.313 2.391 5 8 0.10 5.298 3.597 6 8 0.15 7.373 3.256 7 12 0.05 3.124 1.584 8 12 0.10 1.801 1.291 9 12 0.15 1.481 0.859
2022, IRJET | Impact Factor value: 7.529 | ISO 9001:2008 Certified
International Research Journal of Engineering and Technology (IRJET) e ISSN: 2395 0056
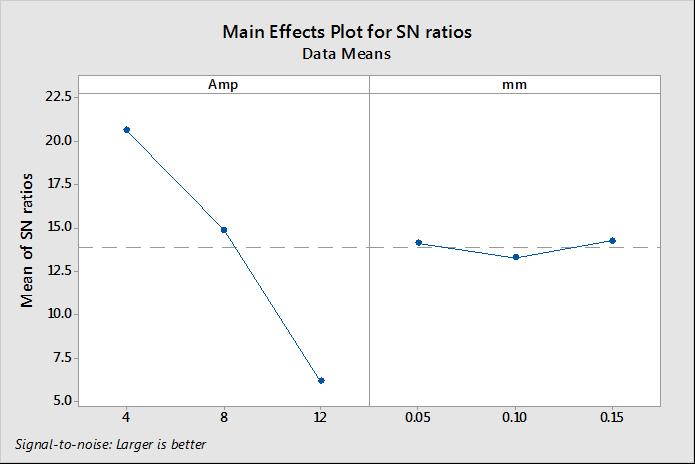
Fig 3:Maineffectformeans(MRR)
Fig 6:InteractioneffectplotforS/Nratio(MRR)
Table 5:ResponseTableofMeansforMRR
Level Amp mm 1 10.801 5.705 2 5.661 5.764 3 2.135 7.129 Delta 8.666 1.425 Rank 1 2
Table 6:ResponseTableforSignaltoNoiseRatiosLarger isbetterforMRR
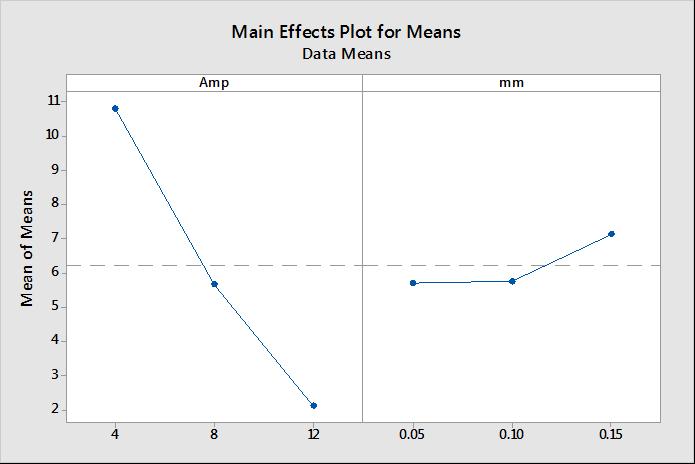
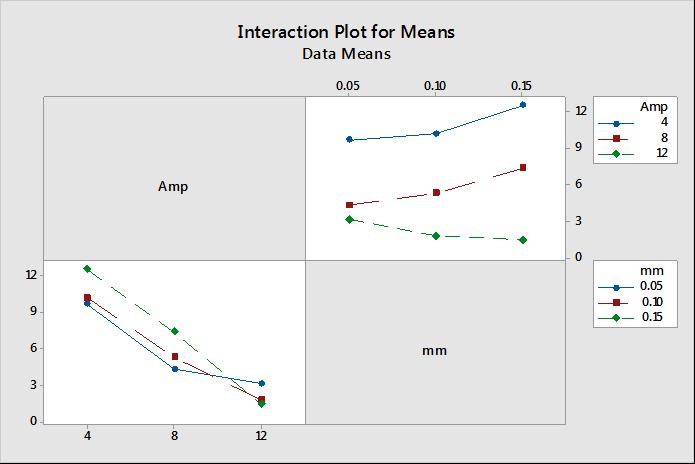
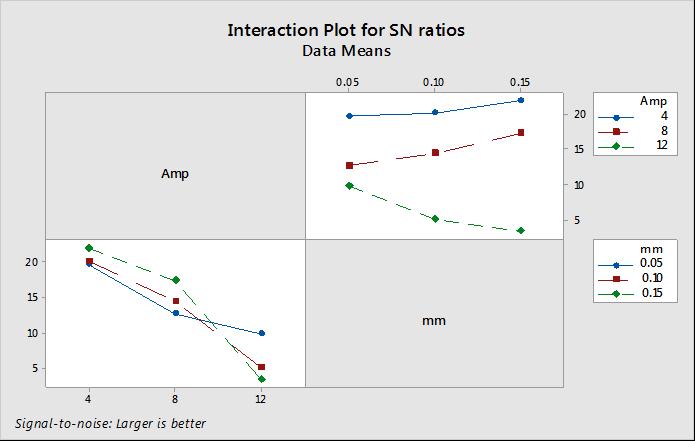
Fig -4:Interactionplotformeans(MRR)
Level Amp mm 1 20.614 14.102 2 14.844 13.253 3 6.139 14.242 Delta 14.476 0.989 Rank 1 2
Table 7:ANOVAresultsforMRR
Source DF SS MS F P Amp 2 113.9518 56.9759 30.983 0.001 mm 6 11.0335 1.8389 Total 8 124.9854
Table 8:VarianceComponents
Source VarComp. %of Total StDev Amp 18.379 90.90 4.287 mm 1.839 9.10 1.356 Total 20.218 4.496
Fig 5:maineffectplotforS/Nratio(MRR)
Table 9:ExpectedMeanSquares
1 Amp 1.00(2)+ 3.00(1) 2 mm 1.00(2)
Volume: 09 Issue: 06 | Jun 2022 www.irjet.net p ISSN: 2395 0072 © 2022, IRJET | Impact Factor value: 7.529 | ISO 9001:2008 Certified Journal
International Research Journal of Engineering and Technology (IRJET) e ISSN: 2395 0056
Volume: 09 Issue: 06 | Jun 2022 www.irjet.net p ISSN: 2395 0072
Thefollowingfiguresshowthemaineffectandinteraction effectplotsforToolwearrate
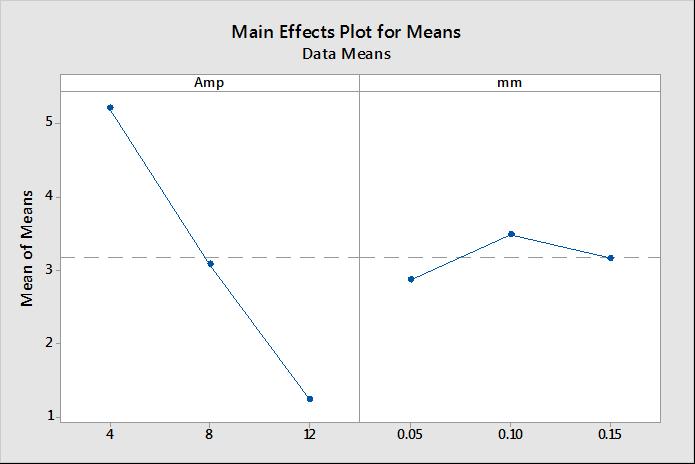
Fig -7:Maineffectformeans(TWR)
Fig 10:InteractioneffectplotforS/Nratio(TWR)
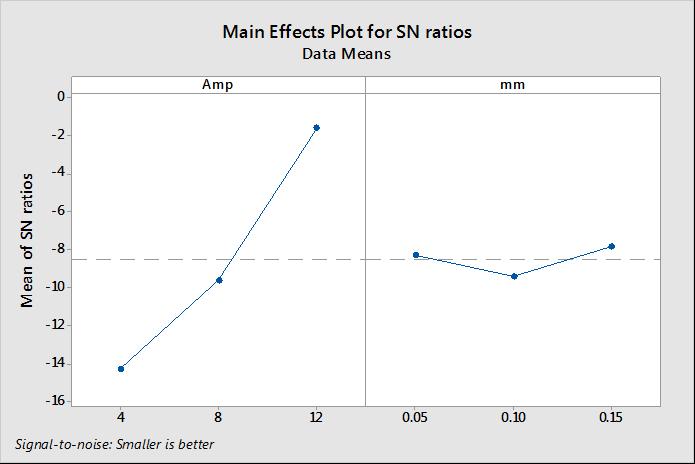
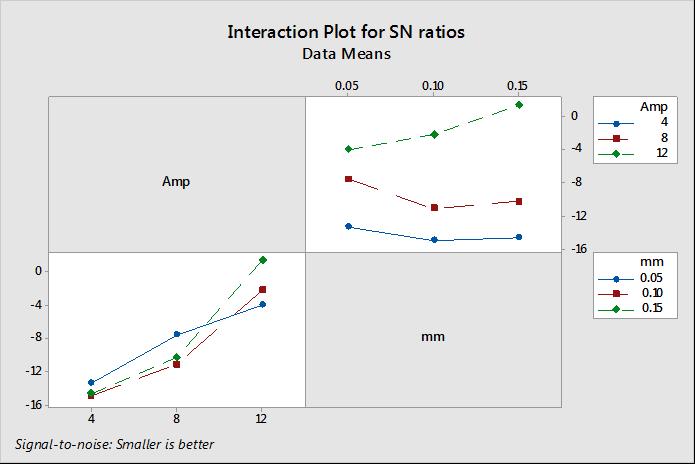
Table 10:ResponseTableofMeansforTWR
Level Amp mm 1 5.207 2.875 2 3.081 3.489 3 1.245 3.169 Delta 3.962 0.614 Rank 1 2
Table 11:ResponseTableforSignaltoNoiseRatios SmallerisbetterforTWR
Level Amp mm 1 14.305 8.305 2 9.648 9.423 3 1.631 7.856 Delta 12.674 1.568 Rank 1 2
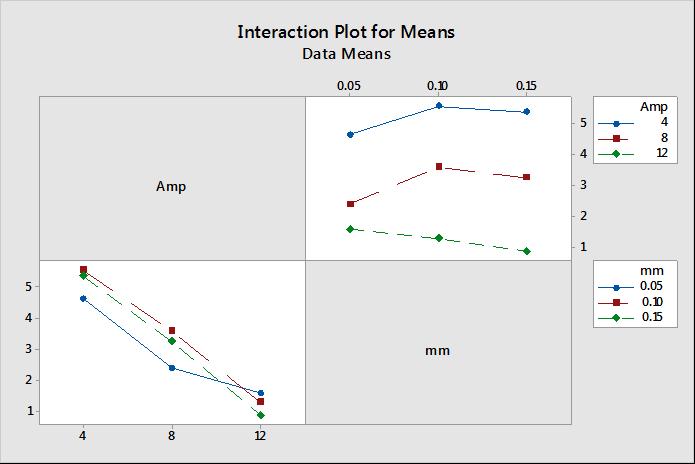
Fig 8:Interactionplotformeans(TWR)
Table 12:ANOVAresultsforMRR
Source DF SS MS F P Amp 2 23.5919 11.7959 46.494 0.000 mm 6 1.5222 0.2537 Total 8 25.1141
Table 13:VarianceComponents
Source VarComp. %of Total StDev Amp 3.847 93.81 1.961 mm 0.254 6.19 0.504 Total 4.101 2.025
Table 14:ExpectedMeanSquares
Fig 9:MaineffectplotforS/Nratio(TWR)
1 Amp 1.00(2)+ 3.00(1) 2 mm 1.00(2)
2022, IRJET | Impact Factor value: 7.529 | ISO 9001:2008 Certified
International Research Journal of Engineering and Technology (IRJET) e ISSN: 2395 0056
Volume: 09 Issue: 06 | Jun 2022 www.irjet.net p ISSN: 2395 0072
From the experimental results, the main effect plots and interactionplotsaregeneratedforMaterialremovalrateand Tool wear rate. The S/N ratio is also calculated by considering maximum is better for Material removal rate andminimumisbetterforToolwearrate.FromTable 6it can be concluded that discharge current is the most influentialfactorforMaterialremovalrateandhencemore dischargecurrentisrecommended.FromTable 11,itcanbe concluded that discharge current is most influential parameter for Tool wear rate. The experimental investigationscanbecarriedoutwithmorenumberofinput processparameters
[1] KansalH,SinghSandKumarP.(2007)Technologyand research developments in powder mixed electric discharge machining (PMEDM). Journal of Materials ProcessingTechnology184:32 41.
[2] KansalHK,SinghSehijpalandKumarP.(2007)Modeling of machining parameters in powder mixed electric discharge machining (PMEDM) of Al 10%SiCP metal matrix composites. Journal of Materials Processing Technology1:396 411
[3] ExperimentalinvestigationofEDMprocessparameters in machining of 17 4 PH Steel using taguchi method MaterialsToday:Proceedings,Volume5,Issue2,Part1, 2018,Pages5058 5067S.Chandramouli,K.Eswaraiah.
[4] S.SMahapatra,A.Patnaik,“Optimization of wire electric dischargemachining(WEDM)processparametersusing taguchi methodˮ,international journal of advanced manufacturingtechnology34(2007)
[5] Chen, S.L., Huang, F.Y., Suzuki, Y., Yan, B.H., 1997. ImprovementofMRRofTi 6Al 4ValloybyEDMwith multipleultrasonicvibrations.J.LightMet.4(4),220 225
[6] Chandramouli S, Shrinivas Balraj U and Eswaraiah K, (2014),OptimizationofElectricalDischargeMachining Process Parameters Using Taguchi Method, International Journal of Advanced Mechanical Engineering.ISSN2250 3234Volume4,Number4,pp. 425 434
[7] A. Chandrakanth, Dr. S. Gajanana, B. Kshetramohan, 2015,ExperimentalInvestigationofProcessParameters of Submerged Wire EDM for Machining High Speed Steel, International Journal of Engineering Research, VolumeNo.5IssueSpecial2,pp:427 431
[8] Aveek Mohanty, Gangadharudu Talla, Soumya Gangopadhyay, 2014, Experimental Investigation and Analysis of EDM Characteristics of Inconel 825, Materials and Manufacturing Processes 29(5) DOI:10.1080/10426914.2014.901536
[9] Gajanan Kamble, 2021, A Study on Optimization of ProcessParametersinMachiningofBronzeusingWire EDM, International Journal of Scientific Research in ScienceandTechnology,DOI:10.32628/IJSRST218562
[10] K. Buschaiah*, A. Chandrakanth, S. Gajanana, Experimental Investigation of Metal Removal Rate on EdmForVariableToolMaterials,InternationalJournal ofEngineeringResearch,VolumeNo.5IssueSpecial2, pp:427 431
[11] Chen, S.L., Huang, F.Y., Suzuki, Y., Yan, B.H., 1997. ImprovementofMRRofTi 6Al 4ValloybyEDMwith multipleultrasonicvibrations.J.LightMet.4(4),220 225.
[12] Erden,A.,1983.Effectofmaterialsonthemechanismof EDM.Trans.ASME105,132 138
[13] Kong,W.,Panten,U.,1988.Electricaldischargecuttingof electrically conductive ceramics. Res. Technol. Dev. NontraditionalMach.34,105 116.
[14] V.S.R. Murti and P.K. Philip,1986. “A comparative analysis of machining characteristics in ultrasonic assisted EDM by response function modeling”. Int. J. Prod.Res,Vol.25,PP259 272.
[15] N.N.Ramesh,P.L.Narayana,V.N.RaoandV.S.R.Murthi, 2004.“Morphology of Resultant Surfaces from Electro Discharge Machining and Electro Discharge Sawing”, Proc.ofTMS,133AnnualMeetingandExhibitionPP412 413.
2022, IRJET | Impact Factor value: 7.529 | ISO 9001:2008 Certified Journal