International Research Journal of Engineering and Technology (IRJET) e-ISSN:2395-0056
Volume: 09 Issue: 06 | June 2022 www.irjet.net p-ISSN:2395-0072
International Research Journal of Engineering and Technology (IRJET) e-ISSN:2395-0056
Volume: 09 Issue: 06 | June 2022 www.irjet.net p-ISSN:2395-0072
*Final Year Industrial Engineering Student, Shri Ramdeobaba College of Engineering and Management, Nagpur. **Professor Industrial Engineering Department, Shri Ramdeobaba College of Engineering and Management, Nagpur. ***
Abstract: Refrigerated warehouse is a critical element in the supply chain of perishable goods. The specified storage conditions are to be adhered to in spite of varying ambient conditions due to different geographic locations in country like India. Even inside a fair sized refrigerated warehouse or a cold storage non uniformity of values for critical parameters like temperature and humidity is un avoidable. In the given situation variation of critical parameters vis à vis spatial location of the vantage point in the observable storage space of a refrigerated warehouse storing perishable spices is analyzed. To monitor the parameters at 3 different locations of each of the 5 floors, readings are noted using IoT techniques. Cause and Effectdiagnosticsisusedtoidentifyandcorrecttheproblematiclocationstoenhancethestoragecapacityofthewarehouse
Keywords: Raspberry Pi, Data Visualization, ThingsSpeak, ThingsView, SMS Alert.
Oneof the mostimportant factorsinfluencingthewholesomenessoffoodsistemperature. The temperature fluctuationscan cause food degradation. Excess fruits and vegetables are frequently stored in the food industry because they cannot be consumed immediately but can be stored well. This paper focuses on the design of a similar coldstorage monitoring system thatwillkeepaneyeonnaturalfactorssuch astemperature.Thegoalofthispaperistomonitortemperatureincoldstorage warehousessothatstoredproductsdonotgetcontaminatedduetoenvironmentalconditionswhichwillenhancethecapacity ofcoldstorage.
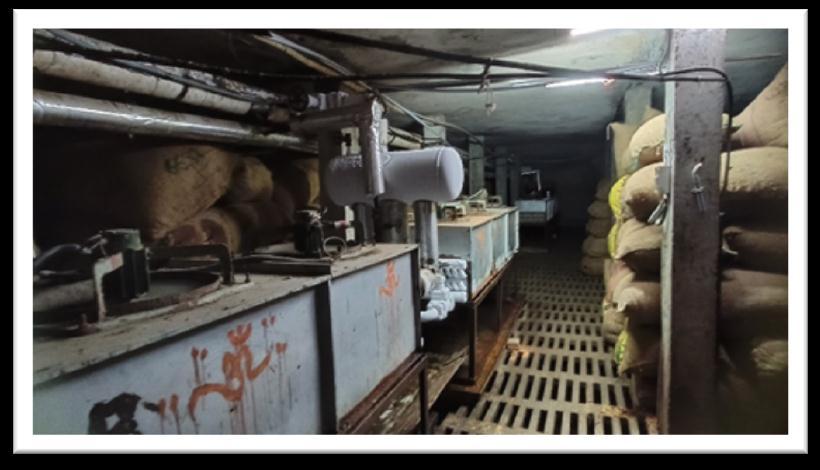
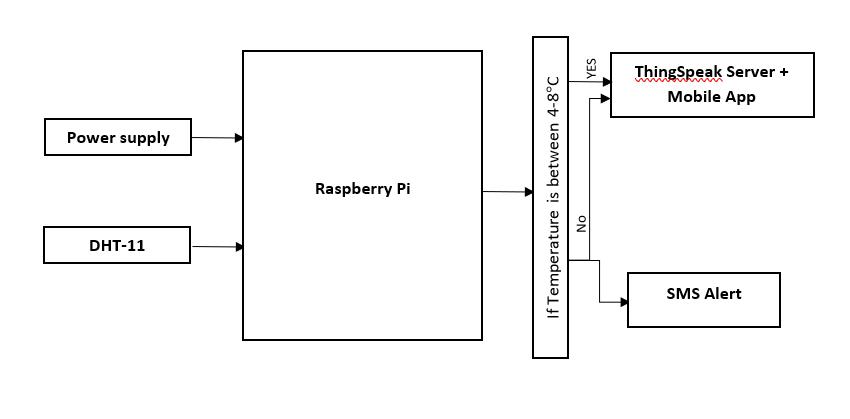
ThemonitoringnodeinthiscaseisaRaspberryPi.ProgramminglanguageusedbyRaspberryPi isPython.TheRaspberryPiis a small but complete PC on a single board. DHT 11 sensor is connected to the Raspberry Pi which detects real time temperatureandhumidity,andRaspberryPisendsthisrealtimedatatoThingspeakserverandtoamobileapplicationbased onThingspeakidinmobile.Thingspeakserverisanopen sourceserverusedtostoreanddisplaythereal timedata.Incaseif thereisanysuddenchangeinthetemperatureandthetemperaturevaluefallsoutsidethepre setrangeinRaspberryPi,then thisIoTbaseddevicewillsendanautogeneratedSMSalerttoowner’smobilephone.ThisautogeneratedSMSalertconsistof thepresenttemperaturevalue.
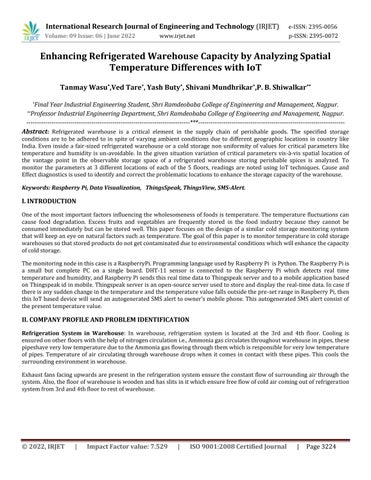
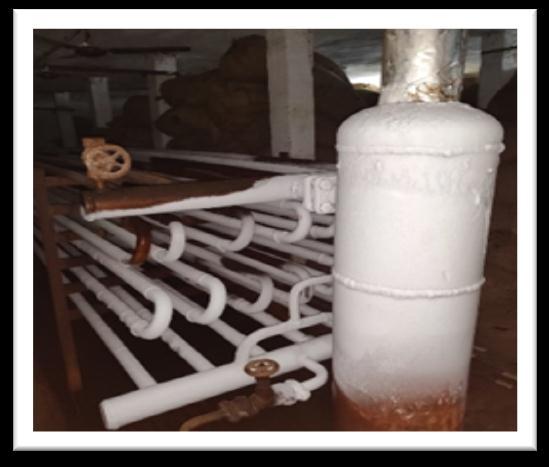
Refrigeration System in Warehouse: In warehouse, refrigeration system is located at the 3rd and 4th floor. Cooling is ensuredonotherfloorswiththehelpofnitrogencirculationi.e.,Ammoniagascirculatesthroughoutwarehouseinpipes,these pipeshaveverylowtemperatureduetotheAmmoniagasflowingthroughthemwhichisresponsibleforverylowtemperature of pipes. Temperature of air circulating through warehouse drops when it comes in contact with these pipes. This cools the surroundingenvironmentinwarehouse.
Exhaustfansfacingupwardsarepresentintherefrigerationsystemensuretheconstantflowofsurroundingairthroughthe system.Also,thefloorofwarehouseiswoodenandhasslitsinitwhichensurefreeflowofcoldaircomingoutofrefrigeration systemfrom3rdand4thfloortorestofwarehouse.
© 2022, IRJET | Impact Factor value: 7.529 | ISO 9001:2008 Certified Journal | Page3224
 Tanmay Wasu*,Ved Tare*, Yash Buty*, Shivani Mundhrikar*,P. B. Shiwalkar**
International Research Journal of Engineering and Technology (IRJET) e-ISSN:2395-0056
Volume: 09 Issue: 06 | June 2022 www.irjet.net p-ISSN:2395-0072
Problem Identification: Tostudythetemperaturedifferenceatdifferentgeographicallocationsinarefrigeratedwarehouse toenhancethestoragecapacityofGoyalWarehousePvt.Ltd.,awell knownwarehouseinNagpurtostoreperishableandnon perishablefoodproductslikedifferenttypesofchilies,chilipowder,pulses,driedturmericfingersetc.Eachflooris30000sq. ft.ofarea.AndEachfloorconsistof5parts,6500sq.ftperpart.
Raspberry Pi: The model of Raspberry Pi used in this paper is Raspberry Pi 3b+. The Raspberry Pi is a credit card sized computerwithanARMprocessorthatcanrunLinux.ThisitemistheRaspberryPi3ModelB+,whichhas1GBofRAM,dual band Wi Fi, Bluetooth 4.2, Bluetooth Low Energy (BLE), an Ethernet port, HDMI output, audio output, RCA composite video output (through the 3.5 mm jack), four USB ports, and 0.1″ spaced pins that provide access to general purpose inputs and outputs(GPIO).TheRaspberryPirequiresamicroSDcardwithanoperatingsystemonit.
DHT-11 Sensor: DHT11 is a low cost digital sensor for sensing temperature and humidity. This sensor can be easily interfaced with any micro controller such asArduino, Raspberry Pi, ESP 32, etc. to measure humidity and temperature instantaneously.DHT11humidityandtemperaturesensorareavailableasasensorandasamodule.
International Research Journal of Engineering and Technology (IRJET) e ISSN:2395 0056
Volume: 09 Issue: 06 | June 2022 www.irjet.net p ISSN:2395 0072
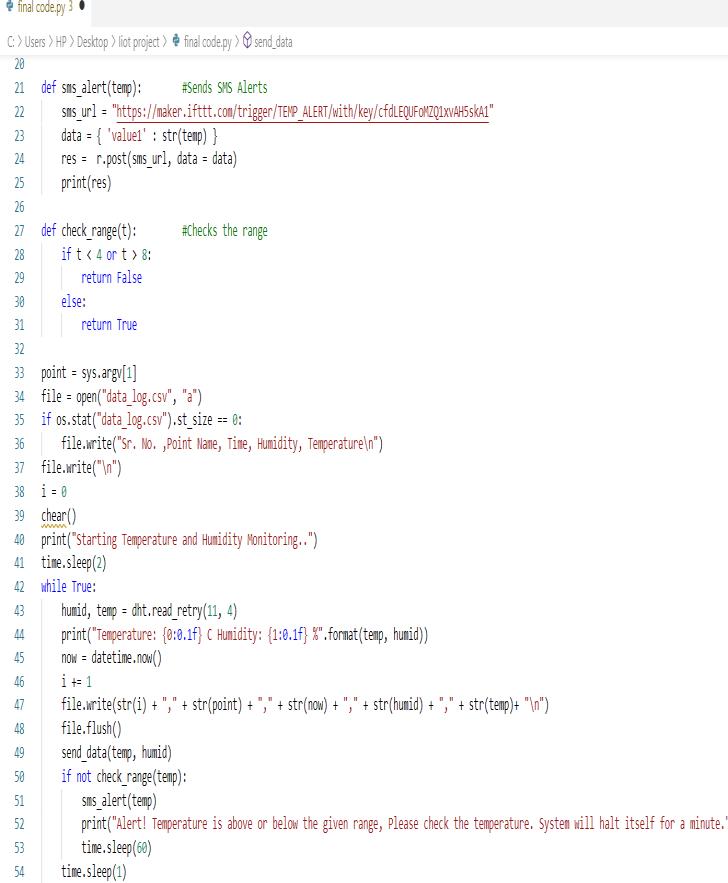
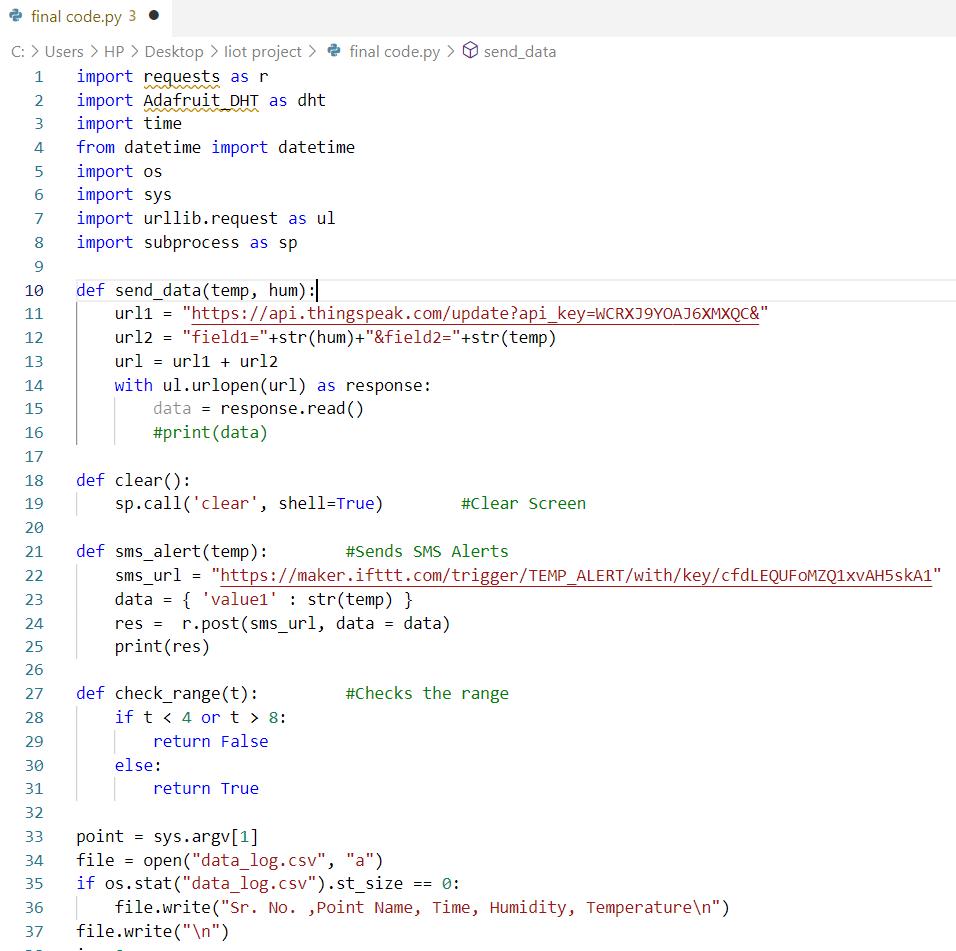
Visualization through Raspberry Pi:
Fig. 3. (Left) Python code for data collection and visualization Fig. 3. (Right) Python code for data collected and visualization
ThingSpeak Server:ThingsSpeakisanIoTanalyticsplatformservicethatallowsusto collect,visualizeandanalyselivedata streamsincloud.WecansenddatatoThingsSpeakanydeviceatanyremotelocation.
ThingView ThingSpeak viewer: ThingView is a mobile application which help us to get the real time data from our RaspberryPitoourmobileatanylocationawayfromthesetupbyenteringThingSpeakserver’sAPIkeyandid.
Thecoldstorageplantisoffivefloors(ground+4).Refrigerationsystemisinstalledat4thfloormakingitthemostidealfor storingchilies.IoTbasedsystemiskeptatthreedifferentlocationsoneachfloorandthus15readingswereobtainedateach location.ThesetupwaskeptondifferentsackswhichwerekeptatamanualheightasshowninFig2.b. Anaveragefromthe 15readingswascalculated for eachlocation. These readingsare shownin Table 1 andpoints were namedas G1a,G1b,G1c, FL1a,FL1b,etc.forall5floors.FL1candFL3awerefoundtobethelocationsinwhichtemperatureisconstantlydeviatingthe ideal range making these 2 locations unsuitable for storage of chilies. This means almost 12000 sq. ft area is wasted out of 60000sq.ft.ofarea.
The collected data is being stored in an excel sheet and is also visible at ThingSpeak server and in ThingView mobile application.Thepersoninchargeatwarehousehasaccesstothemobileapplicationtomonitorrealtimetemperaturevalue.
International Research Journal of Engineering and Technology (IRJET) e ISSN:2395 0056
Volume: 09 Issue: 06 | June 2022 www.irjet.net p ISSN:2395 0072
3.4.1. Collected Data:
READING NO.
TEMPERATURE (°C) AT SENSOR LOCATIONS
G1a G1b G1c FL1a FL1b FL1c FL2a FL2b FL2c FL3a FL3b FL3c FL4a FL4b FL4c
1 8 8 9 7 7 7 7 7 7 9 6 6 6 5 5 2 8 7 10 7 8 7 7 7 6 9 6 6 5 5 5 3 8 7 10 7 7 7 6 7 6 8 6 6 5 5 5 4 8 7 9 8 7 7 6 6 6 9 7 6 5 5 5 5 7 8 10 7 7 7 6 6 6 9 6 6 5 5 5 6 8 8 9 7 7 7 6 6 6 9 6 6 5 5 5 7 7 8 9 8 7 7 7 7 7 8 6 7 6 6 5 8 7 8 10 7 7 7 7 6 7 8 6 7 5 6 5 9 7 8 9 7 7 7 7 6 6 9 6 6 5 5 6 10 8 8 9 7 7 7 6 6 6 8 6 6 5 5 6 11 8 8 10 7 7 7 6 6 6 8 6 6 6 5 6 12 8 8 10 7 7 7 6 6 6 8 6 6 5 5 6 13 8 8 10 7 7 7 6 6 6 8 6 6 5 5 5 14 7 8 10 7 7 7 6 6 6 8 6 6 5 5 5 15 7 8 10 7 7 7 6 6 6 8 6 6 5 5 5
Mean 7.6 7.8 9.6 7.13 7.06 7 6.33 6.26 6.2 8.4 6.06 6.13 5.2 5.13 5.26
Table1.Observedrealtimetemperaturedata © 2022, IRJET | Impact Factor value: 7.529 | ISO 9001:2008 Certified Journal | Page3227
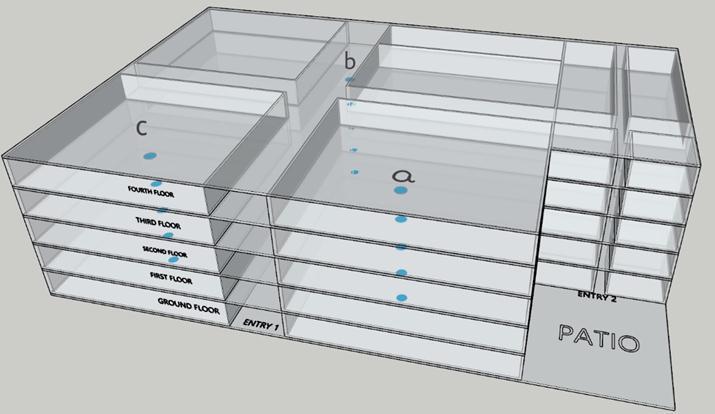

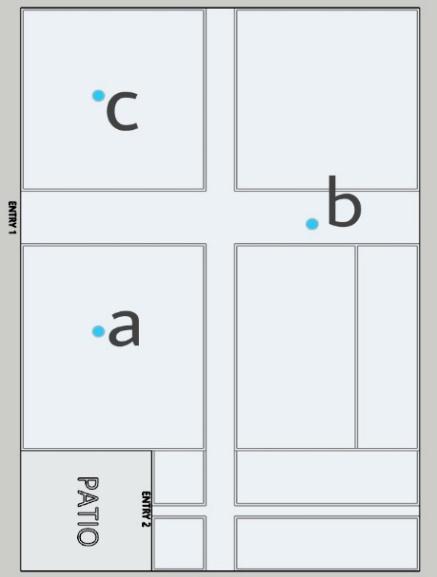
Fig. 4. (Left) 3 D drawing of warehouse (sensor location displayed with points a, b, c)
Fig. 4. (Right) Warehouse Layout Top View (sensor location displayed with points a, b, c)
International Research Journal of Engineering and Technology (IRJET) e-ISSN:2395-0056
Volume: 09 Issue: 06 | June 2022 www.irjet.net p-ISSN:2395-0072
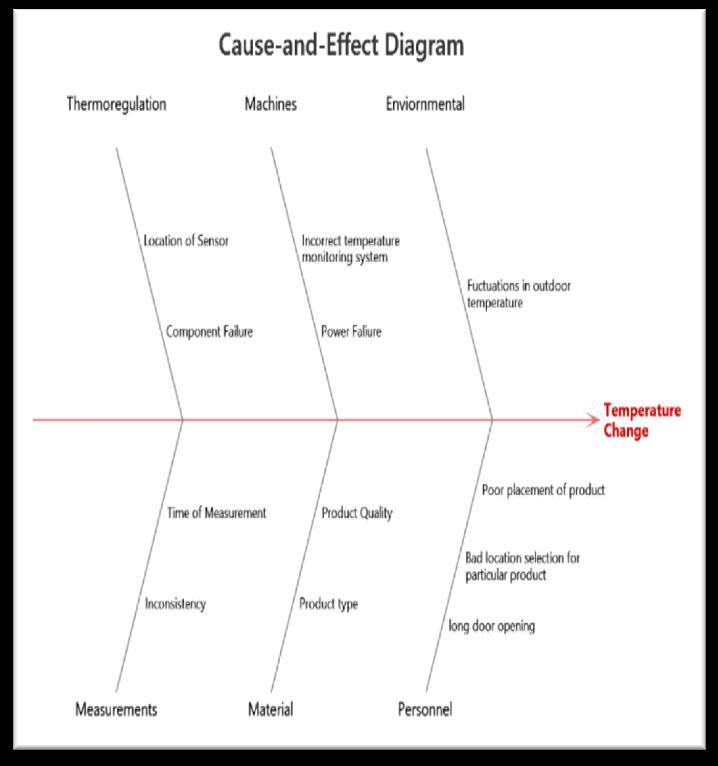
Analysis of the collected data is done to find out the causes which are affecting the temperature at two points. For this, a Cause Effect diagram or an Ishikawa diagram was used to solve the problem. Sometimes this diagram is also called as Fish Bonediagramasithasashapeoffish.Rightsideofthediagramconsistseffectandleftsideofthediagramconsistsdifferent causes. Major cause categories are shown as gross fish bones. Following causes of temperature fluctuations are identified throughbrainstorming:
Environmental,Material,Personnel,Machine,MeasurementsandThermoregulation.
Environmental: Thiscauseisaresultoffluctuationsinoutertemperatureduetovariousatmosphericchanges.Normallythe refrigeration process is carried out for 10 15 hours depending on the product stored in the warehouse. In winter, the refrigeration process is quite easy and is carried out approximately for 8 hours while in summer, process of refrigeration is takesmoretimeasoutertemperatureisusuallyveryhigh.Hence,Refrigerationprocessiscarriedoutfor15 18hoursduring summer.
Personnel: Thiscauseisaresultofhumaninterventionintherefrigerationprocesssuchasdoorleftopenforlongerduration oftime,in appropriatelocationallocatedtoaparticularfoodmaterial.
Machines: Thiscauseresultsduetomalfunctioningofthemachinesusedinthewarehouse.Mal functioningcanberesultof anyfaultinthemachineorpowerfailure.
Material: Temperatureofa warehouseneedsto bealteredaspertheneedofdifferenttypesofmaterials.Fruits,vegetables, anddairyproductscan’tbestoredintemperaturebelow0°Cwhereasqualityoffoodproductslikespicesandlentilsisaffected duetoextremelylowtemperature.
Thermoregulation: Locationofsensorsplacedinthewarehousetocollectdifferenttypesofdataplaysimportantroleinthe study as in appropriate location can give in correct data. Failure of components used for data collection like sensors, connectivity protocolscanleadtowrongorirrelevantdatacollected.
Measurements: Iftwoindividualreadingstakeninbetweenaverylongintervaloftimethenitcanmis guidthewholestudy asmanychangesandfluctuationsinthetemperaturewillgoun noticed.ColdstoragewarehousechargesRs.15to25persack storedinthewarehouse.Thechargesarenotvariablefordifferentfloorsordifferentlocationsataparticularfloor.However, thechargespersackvarywiththesizeofsackandtypeoffoodmaterialstoredinit.Normallythesacksfilledwithchiliesare stored in the warehouse right after the process of harvesting and drying is completed. Dry chilies, when stored in the warehouseasappropriate temperatureof4 8°Cabsorbsthemoistureand the weightof everysack increasesinthe range of 200 gm to 500 gm. As the data collected by our Raspberry Pi based IoT setup showed, the mean temperature recorded at locationCof thegroundfloorwas 9.6°Cbuttheappropriatetemperatureforchilies is4 8°C.Hence,themoisturecontenton groundfloorwillnotbeadequatetoincreasetheweightofchilies.Thiswilldirectlyresultinfinanciallossofthebusinessmen whostoredtheirchiliesonthegroundfloorastheopportunitycostofweightofchilisackswhichneverincreased.
AKruskal Wallistestwasselectedtoobservetherelationshipbetweenindoorandoutdoortemperature.Theaverageoutdoor temperaturewasnotedas29°CandindoortemperaturewasmeasuredbyaRaspberryPibasedIoTsetup.Thenullhypothesis wasdefinedas “Thereisa relation between outdoor andindoor temperature of warehouse.” andalternativehypothesis was defined as “There is no relationship in the outdoor and indoor temperature of warehouse.” After conducting this test in Minitab software which is statistical tool used commonly to analyze data. It was observed that there is a relation between outdoorandindoortemperaturereadingsofthewarehousei.e.,weacceptthenullhypothesis
Volume: 09 Issue: 06 | June 2022 www.irjet.net p ISSN:2395 0072
Fig. 5. (Left) Graph of temperature values at different floor points in warehouse

Fig. 5. (Right)Cause and Effect analysis
ARaspberryPibasedIoTsetupcreatedbyuswasabletorecordrealtimevaluesoftemperatureandhumidity.Python3was selectedasprogramminglanguagetoprogramRaspberryPi.RaspberryPi3B+modelwasusedasacommunicationprotocol. TheRaspberryPiisprogrammedinsuchawaythattherealtimerecordeddataisvisibleinanexcelsheetandcanalsobeseen inThingsSpeakserveraswellasThingsViewmobileapplication.RaspberryPiisprogrammedtocontinuouslymonitorthereal timedataandsendanalertmessage(SMS)tothecellphoneofpersonin chargewhentemperaturevaluedropsmorethan4°C orincreasesmorethan8°C.
After temperature and humidity values were recorded at 15 different locations i.e., 3 locations on every floor of warehouse. From which, a temperature difference was observed at the serially third location of ground floor and firstlocation of third floor.Thecausesofthistemperaturedifferencesmightbeenvironmental,machine,thermoregulation,personnel,material and measurements.Causeandeffectsdiagramwasmade,whichdepictedthemaincausesofthetemperaturedifferenceatthose2 points.Thetemperaturedifferencedirectlyresultstofinanciallossesincurredbythosewhostoredtheirchiliharvestatthose particular points as the chilies will not gain weight or will gain less weight than expected due high temperature. Later, a Kruskal Wallistestwasperformedonthe data where recordedindoortemperature valueswere compared with the outdoor temperaturevalue.Inthisanalysis,thenullhypothesisthatthereisarelationbetweenindoorandoutdoortemperaturevalues wasfoundtobetrue.
Itwasfoundthatifthefinanciallossesincurredbythosewhostoretheirchiliharvestatthelocationswhichshowtemperature difference has to be eliminated or reduced then a better refrigeration system will have to be installed at the warehouse or someotherfoodproductwillhavetostoreinatthose2particularlocationswhoseidealtemperatureforstorageisaround9°C likesomedryfruitsetc.Thisresultsineffectiveuseofthecoldstoragewarehouseandcapacityofthewarehouseisenhanced by12000sq.ft.
International Research Journal of Engineering and Technology (IRJET) e ISSN:2395 0056
Volume: 09 Issue: 06 | June 2022 www.irjet.net p ISSN:2395 0072
Fig. 5. ThingsView mobile application screenshot displaying graph of humidity and temperature values
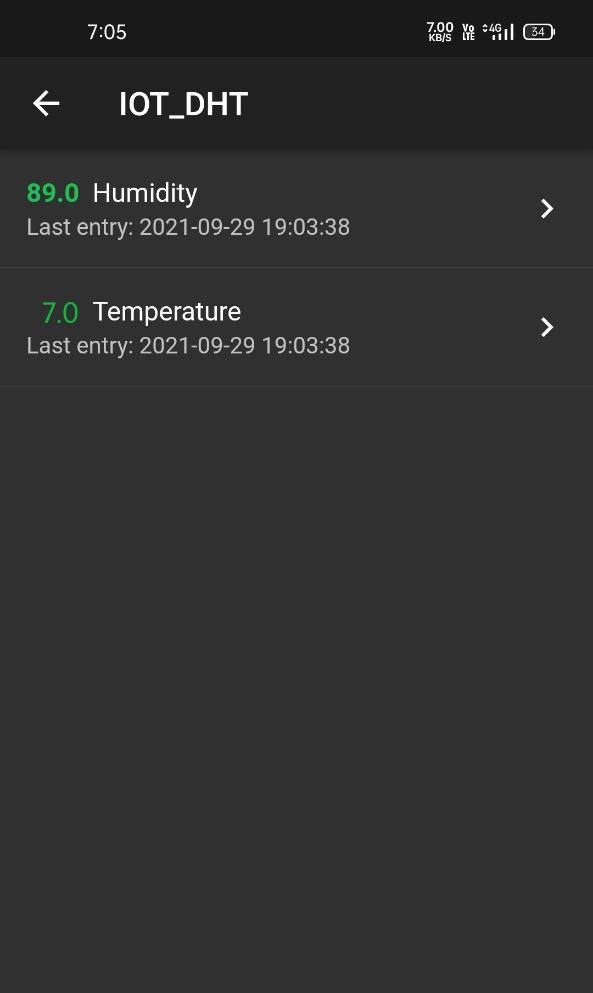
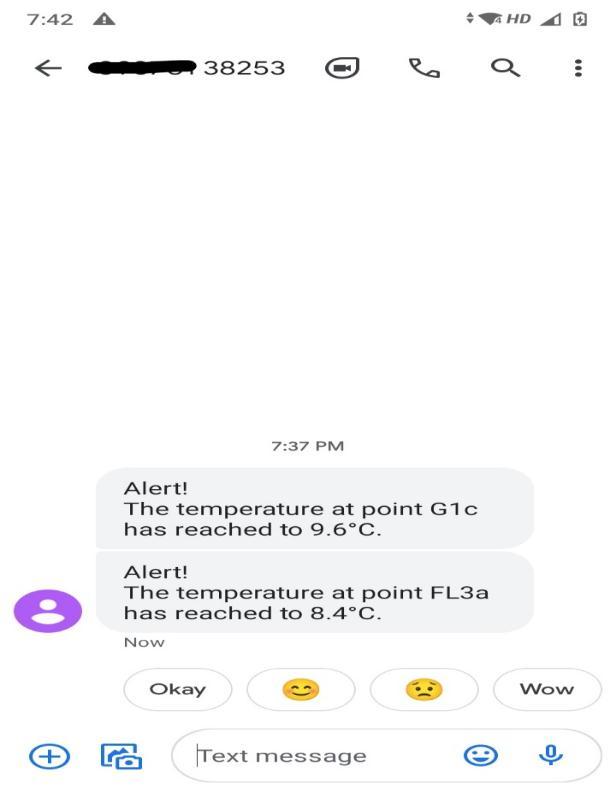
Fig. 6. SMS Alert screenshot
© 2022, IRJET | Impact Factor value: 7.529 | ISO 9001:2008 Certified Journal | Page3230
International Research Journal
Engineering
(IRJET) e ISSN:2395 0056
Volume: 09 Issue: 06 | June 2022 www.irjet.net p ISSN:2395 0072
Thetemperatureatwhichfoodisstoredisoneofthemostimportantfactorsinfluencingitsquality.Temperaturefluctuations are common in the cold store temperature ranges that are either above or below the optimal temperature range. Temperaturesinthecoldstorerise,causingfavorableconditionsformicroorganismformationWhenthetemperatureislower than the specified one, food can degrade. Also, a harvest of chilies is stored for an average duration of 6 months at the cold storage. In this time, the dry chilies absorb moisture in air and due to this, can gain up to 500 gm weight per sack. If the temperature is not maintained at appropriate value, then chilies won’t gain weight. This will result in financial losses of the customers of Cold storage warehouse. By finding this out, the capacity of warehouse was enhanced, as now some different food product can be stored at those locations who require that particular temperature to maintain good quality. Hence, impartialmonitoringofdataatdifferentwarehousesofanyfacilitiescanbeusedforcapacityenhancement.
ThesuggestionsmadetotheBoardofDirectorsofColdstoragewarehousePvt.Ltd.were,toinstallbetterrefrigerationsystem toenhancethestoragecapacityandcustomersatisfaction.Theothersuggestionwastostorenotchiliesbutsomeotherfood products at locations where temperature difference was observed like Squash, Tomato, Beans, Watermelon, Pepper, Musk melon,Honeydewetc.
Fromfirstreadingtothelasti.e.,15th reading,physicallysensorwasmovedsothereadingswerenottakensimultaneously,so between 1st and last reading there was a time lapse (at least 1 2 hours). We demonstrated that the temperature topology in real time can be developed if there is a provision that all those 15 sensors are physically present. Then the user will get the real time data of this complete storage volume and the user will also be able to identify the location where deviation may occur.
Our sensor is connected to the Raspberry Pi by the means of wires, one such setup costed us Rs. 5000/ . If the warehouse owneriswilling,he/shecanhave15RaspberryPidevicesconnectedwith15differentsensorsandtherealtimedataofthose 15 locations will be displayed on the screen simultaneously. By observing the values taken by us, we will be able to find a definitevolumeatwhichtherewillbenoguaranteeofauniformtemperatureandinfutureifwegetsomeelectronicsolution for having only 1 Raspberry Pi device and 15 sensors, then that Raspberry Pi device will process and send the signal for 1 sensoratatimei.e.,DataAcquisition.DataAcquisitionmeanstherewillbeacertainfrequencyinrecordingtimeof15sensors, we will consider the reading of one of the sensors and will record it and then we will convert it into signal. If that data is transmittedwiththehelpofinternet,consideringthetimelapseof30seconds,thecyclewillgetcompletedin5 7minutes.
[1] Bogdanovská, G., Stehlíková, B., Kačur, J., (2019), “Analysis of Temperatures in the Cold Storage of Finished Products”, AdvancesinScienceandTechnologyResearchJournal,Volume13,Issue3,pp.54 66
[2] Yadav, R., Gupta, S., Singh, M., Verma, A., (2020), “Remote Monitoring System for Cold Storage Warehouse using IOT”, International Journal for Research in Applied Science & Engineering Technology (IJRASET), Volume 8 Issue V, pp. 2810 2814
[3] Nirenjena, S., BalaSubramanian, D., Monisha, M., (2018), “ADVANCEMENT IN MONITORING THE FOOD SUPPLY CHAIN MANAGEMENTUSINGIOT”,InternationalJournalofPureandAppliedMathematics,Volume119No.14,pp.1193 1196
[4] Kumar, A., (2019), “Exploring the relationship between ICT, SCM Practices and organizational performance in agri food supplychain”ICTpracticesinfoodSCM
[5] Pal,A.,Kant,K.,(2020)“Smartsensing,communication,andcontrolinperishablefoodsupplychain”,ACMTransactionson SensorNetworks,Vol.16,No.1,Article12pp.12.7 12.41
[6] Usharani, N., Suruthi, D., Sangeetha, V., Punitha, L., (2020) “Arduino based smart IoT based food quality detection technology”,InternationalResearchJournalofEngineeringandTechnology(IRJET)Volume:07,pp.3569 3573 © 2022, IRJET | Impact Factor value: 7.529 | ISO 9001:2008 Certified Journal | Page