International Research Journal of Engineering and Technology (IRJET) e ISSN:2395 0056

Volume: 09 Issue: 06 | June 2022 www.irjet.net p ISSN:2395 0072
International Research Journal of Engineering and Technology (IRJET) e ISSN:2395 0056
Volume: 09 Issue: 06 | June 2022 www.irjet.net p ISSN:2395 0072
Abstract: Lubrication controls the friction and wear between moving surfaces in contact, by the introduction of a friction reducing film. It can be a Solid, fluid, or plastic substance. All types of lubricants are susceptible to degradation while in use and depending upon the engine oil condition, it should be changed after certain interval of time. Viscosity of lubricating oil is the detrimental property to define the oil characteristics after hours of running of an engine. Analytical methods for the analysis of lubricating oil such measuring viscosity, TAN/TBN takes much time and not so accurate results are obtained, also large amount of lubricating oil is used in this viscosity measurement method. In the present work, Engine oil used was multi grade SAE 15 W 40 from a Generator set provides power to E 1400 16 drilling rig used for land drilling rigs for oil rig applications in Oil & Natural Gas Corporation (ONGC). Fourier transform infrared (FTIR) spectroscopy is used for the analysis of oil. Viscosity of the lubricants were found by Stabinger Viscometer at 20º C. Correlation between viscosity and percentage transmittance were created to find out which compound is more responsible for the degradation of oil. A trend line equation was generated at a selected peak to know the viscosity value at the corresponding value of percentage transmittance. Advantage of FTIR is, it’s running cost is less as no additional chemical are required to get the spectra.
Keywords: Lubricant, FTIR, Viscosity, Transmittance
Lubricants create thin film between moving surface in contact due to which function and wear of engine can be controlledandlifeofengineisprolonged.Lubricantscanbe usedinanyformsuchasfluidorsolid.
Lubricating oil has large number of products which can be classified on the basis of base chemical and additives. Generally lubricating oil are belonging to either mineral based or synthetic. Constituents of petroleum based lubricatingoilsare80 90%ofpetroleumhydrocarbonand 10 20% of additives. All internal combustion engine is preserved from wear and corrosion because of this petroleumbasedlubricatingoils.
The substance which plays main role in increasing the equipment life and improves the working of lubricating oil is additives, which is used for refinement of the anti friction, chemical and physical properties of the base oil (minerals, synthetic, vegetable or animal) [1].There are various types of lubricating additives such as friction modifierswhichreducescoefficientoffrictionduetowhich less fuel is consumed (some of them are graphite, molybdenum disulfide, boron nitride, tungsten disulfide, PTFE).
Various properties of lubricating oil are higher viscosity, thermal stability, demulsibility, hydraulic stability, corrosion prevention, high boiling point and low freezing point and high resistance to corrosion [3]. The property of lubricating oilforthecenter ofattentionin thisresearchis viscosity. Viscosity is due to inter molecular interaction. This property of lubricating oil is affected by oxidation, nitrationandformationofvariousothercompoundswhich changesthecompositionoflubricatingoilafterlonghourof running.Duetothesechangesincomposition,thequalityof lubricating oil changes[4]. FTIR spectroscopy is used to give the percentage of transmittance for various functional groupsatdifferenthoursofrunning.FTIRiswidelyusedin many industries for monitoring degradation, contaminants and additives levels in lubricants of various working lubricatingoil.So,wecouldknowthatwhentheoilneedsto be changed to prevent the engine from damage and increasesitslife.
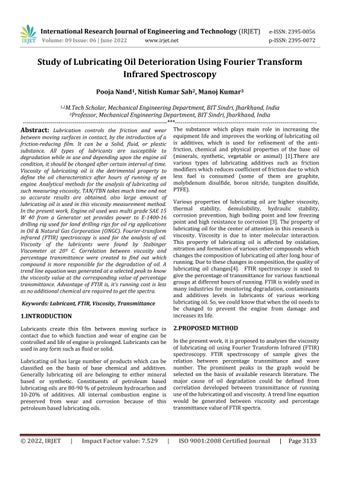
Inthepresentwork,itisproposedtoanalysestheviscosity of lubricating oil using Fourier Transform Infrared (FTIR) spectroscopy. FTIR spectroscopy of sample gives the relation between percentage transmittance and wave number. The prominent peaks in the graph would be selected on the basis of available research literature. The major cause of oil degradation could be defined from correlation developed between transmittance of running useofthelubricatingoilandviscosity.Atrendlineequation would be generated between viscosity and percentage transmittancevalueofFTIRspectra.
International Research Journal of Engineering and Technology (IRJET) e ISSN:2395 0056
Volume: 09 Issue: 06 | June 2022 www.irjet.net p ISSN:2395 0072
Engineoilused:SAE15W40.
Fivesampleswerecollectedincludingfreshlubricatingoil. Kinematic viscosity of the different lubricating oil samples hasbeenshowninTable1.
Table-1: KinematicViscosity
Sl.No. Sample Hoursof running Kinematic Viscosity(mm2/sec)
1 Fresh 0 327.75 2 1 100 290.43 3 2 200 217.149 4 3 300 155.05 5 4 500 135.27
Thekinematicviscosityofoilshowsverysmallchangeafter 100hrs.ofrunningthenfoundamajordropafter200and 300hrs.ofrunning,notmuchvariationwasfoundbetween 300and500hrs.ofrunning.
The FTIR Spectra of the oil samples were recorded on Nicolet iS50 FTIR spectrometer. The reflectance spectrum was recorded when lubricating oil were spread between the slides of KBrwithout any treatment. In this method of spectrum analysis pre processing of oil sampling is not required. Thus, it can be assumed that obtained value of results is more accurate as the oil was in its operating conditions. Analysis of samples were done using FTIR spectroscopy,percentagetransmittancewasobtained.
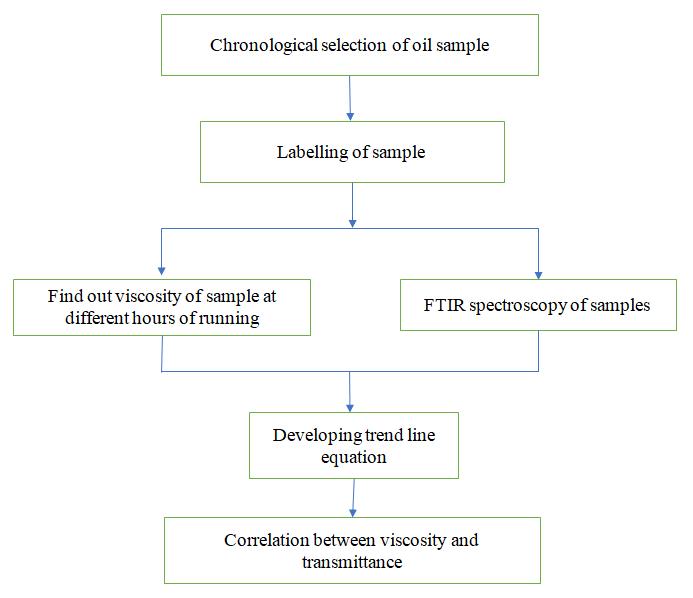
In order to calculate the kinematic viscosity, dynamic viscosity and density of the sample must be known. SVM 3000 machine were used for measuring dynamic viscosity and density which is based on a modified Couette principle in which an inner measuring bob rotates very slowly in a rapidly rotating outer tube. Kinematic viscosity (mm2/s) was calculated using dynamic viscosity and densityformula.IR Prestige21machinewereusedforFTIR analysisoflubricants.
Inthepresentwork,samplewerecollectedfromGenerator set provides power to E 1400 16 drilling rig used for land drilling rigs for oil rig applications in Oil & Natural Gas Corporation(ONGC).
EngineMake:Cummins
Type: 4 stroke, turbocharged or after cooler, V 16 cylinder Dieselengine.Model:KTA50Gwithcapacityof1430KVA.
Fig -1: StabingerViscometer
Kinematicviscosityvstime
300
200
Kinematic viscosity(mm2/s) Time(hrs)
400 0 100 200 300 500
100
327.75 290.43 217.149 155.05135.27 0
Graph 1: Variationofkinematicviscosityofoil
International Research Journal of Engineering and Technology (IRJET) e ISSN:2395 0056
Volume: 09 Issue: 06 | June 2022 www.irjet.net p ISSN:2395 0072
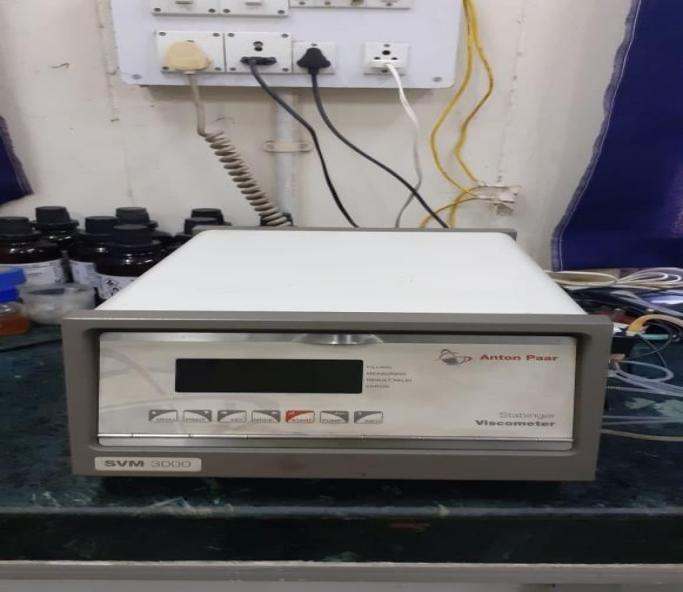
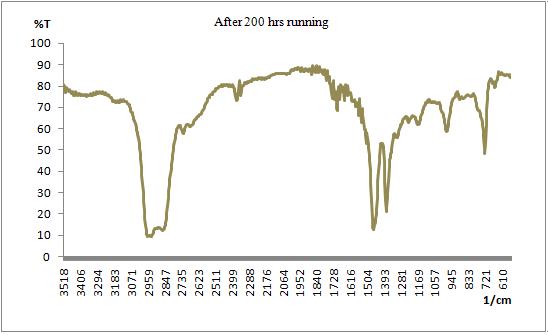
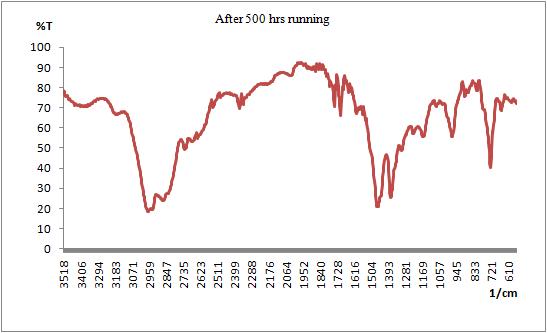
FourierTransformationInfrared(FTIR)spectrumofeachoflubricatingoilsamplesisgivenin,fromgraph 2tograph 7
Graph 2: FTIRspectraoffreshoil
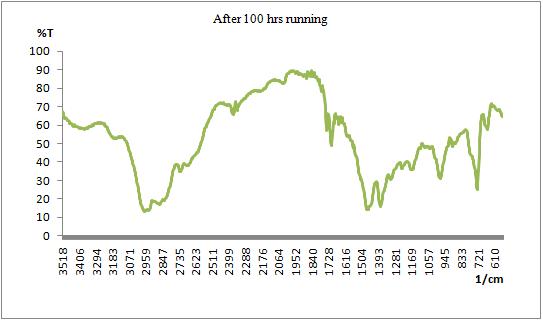
Graph 3: FTIRspectraofoilafter100hrs.ofrunning
Graph 4: FTIRspectraofoilafter200hrsofrunning
International Research Journal of Engineering and Technology (IRJET) e ISSN:2395 0056
Volume: 09 Issue: 06 | June 2022 www.irjet.net p ISSN:2395 0072
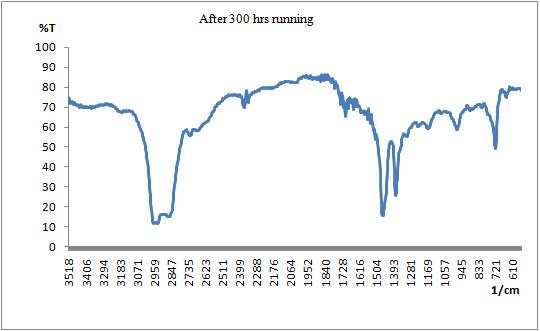
Graph 5: FTIRspectraofoilafter300hrsofrunning
Graph 6: FTIRspectraofoilafter500hrs.ofrunning
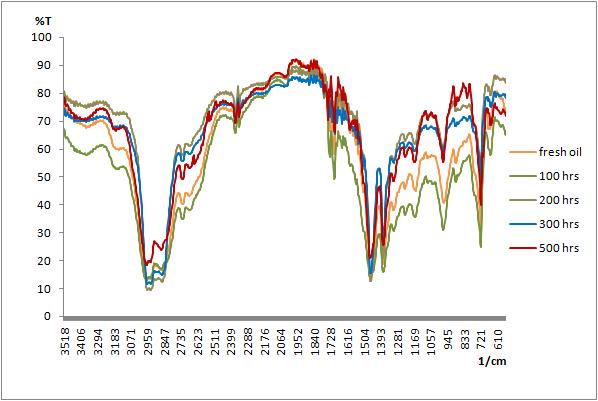
Graph 7: MergedFTIRspectraofoil
International Research Journal of Engineering and Technology (IRJET) e ISSN:2395 0056
Volume: 09 Issue: 06 | June 2022 www.irjet.net p ISSN:2395 0072
Table 2: PercentageTransmittance
Sl. No. Wave No. Inference
Percent transmittance at different hours of running 0Hrs. Fresh 100Hrs. Sample1 200Hrs. Sample2 300Hrs. Sample3 500Hrs. Sample4
1 725 C=Cbending 33.225 26.352 50.733 51.374 42.261 2 975 Antiwearadditives 41.481 31.314 58.710 58.766 55.585 3 1373 S=Ostretching 19.013 16.110 23.028 27.109 25.963 4 1460 N=OandCH2 bending 15.428 14.257 12.792 15.513 20.975 5 1700 Oxidationproducts, Carbonylregion 59.368 49.946 68.275 65.243 66.115 6 2866 OHandCH3 stretching 16.652 17.024 12.746 14.946 23.768 7 2950 OHandCH3 stretching 13.736 14.141 10.030 12.045 19.764 8 3350 Water 67.955 58.449 75.570 70.065 71.125
These FTIR spectra of the samples show the relationship between percentage transmittance and wave number (cm 1). The wave number of important and noticeable peaks is taken from a paper by Mukherjee et al., and Kumar et al., 2005.The percentage transmittance at different hours of working for the selected peaks were tabulated and shown inTable 4.
Thevaluesofviscosityatdifferentrunninghoursarebeing taken from table 5.1 and percentage transmittance from table 5.2. The correlation coefficient of viscosity with the prominent peaks of transmittance at different wave number was calculated using Micro Soft Excel. The correlationvaluesaregiveninTable5.3.
Table 3: Correlationanalysisbetweenviscosityandtransmittance
Sl. No. Wave No. Inferences Correlation Coefficient with Viscosity 1 725 C=Cbending 0.731 2 975 Antiwearadditives 0801 3 1373 S=Ostretching 0912 4 1460 N=OandCH2bending 0541 5 1700 Oxidation products, Carbonyl region 0690 6 2866 OHandCH3 stretching 0.336 7 2950 OHandCH3 stretching 0302 8 3350 Water 0526
International Research Journal of Engineering and Technology (IRJET) e ISSN:2395 0056
Volume: 09 Issue: 06 | June 2022 www.irjet.net p ISSN:2395 0072
The above correlation table shows that the Kinematic viscosity of Lubricants has a good correlation with the transmittanceatcorrespondinghoursofrunning.Thevalue ofcorrelationcoefficientfor mostofthepeaksismoderate to high. The highest value of coefficient of correlation is 0.912 at the wave number 1373 cm 1, which indicates formation of sulfonate compound [5]. Generally, Sulphur compoundaddedinlubricantsactsasanantioxidantwhich prevent acid and sludge formation. They also form a thin film on the metal surface which protects the surface from acid and peroxide attack. Sulphur contained lubricants are frequently exposed to severe operating conditions results incorrosionanddecreaseinviscosityoflubricatingoil[6].
Another higher peak was found at wave number 725 cm 1 andat975cm 1 indicatingreactionswithgasolineandwith antiwearadditives.
From the above table and graph, it can be inferred that presenceof(S=O)compoundhasadetrimentaleffectonthe degradation of selected lubricating oil. However, presence ofothercompoundsuchasOHandCH3 stretchingdoesnot havesignificant role on the viscosityofoil afterlonghours of running. The above correlation was investigated by plotting a graph between viscosity and transmittance at wavenumber1373cm 1 andpolynomialcurvewere derived usingMicroSoftExcel.
V isco sit y in mm 2/s
300
250
200
150
100
50
y = 0.071x4 5.417x3 + 147.3x2 1697.x + 7223. R² = 1 0
350 0 5 10 15 20 25 30
Transmittance
Let y be the viscosity of lubricating oil in mm2/s and x be the transmittance percentage at wave number 1373 cm 1 . Then the relationship between viscosity and transmittance willbegivenby
y=0.071x4 5.417x3 +147.3x2 1697.x+7223.
Deteriorationoflubricatingoilisduetochangesinviscosity whereas FTIR spectrum is due to structural changes in oil. The analysis of correlation of viscosity with percent transmittanceofFTIRspectrumshowsthatviscosityof the oilcouldbeexpressedintermsofpercentagetransmittance value.Thederivedequationis
y=0.071x4 5.417x3 +147.3x2 1697.x+7223.
Where y be the viscosity of lubricating oil in mm2/s and x bethetransmittancepercentageatwavenumber1373cm 1
The conventional methods for finding viscosity require largeamount ofsample,are costlyandtimeconsuming. By the proposed methods viscosity could be derived from the FTIR spectrum in few seconds during which very small amountofsampleisrequired(onlyasmalldroplet).
The above correlation study also implied that formation of sulfonate compounds in the oil was main reason for its deterioration. Correlation between percent transmittance of FTIR of eight prominent peaks and viscosity gave the highest correlation coefficient for formation of sulfonate compoundinoil.
International Research Journal of Engineering and Technology (IRJET) e ISSN:2395 0056
Volume: 09 Issue: 06 | June 2022 www.irjet.net p ISSN:2395 0072
[1] Kumar, S., Mukherjee, P.S. and Mishra, N.M.,“Online condition monitoring of engine oil”, Industrial Lubrication and Tribology, Vol.57, No.6, 2005, pp.260 267.
[2] Toms, A.M., “Fourier transform infrared (FTIR) spectroscopy applying the correct method for your application”, paper presented at Society of Tribologistsand lubrication Engineers (STLE) 62nd Annual Meeting,May6 10,2007, Philadelphia, Pennsylvania,USA.
[3] Mahendra Kumar Bhagat and Pankaj Kumar, “Estimation and Correlation Developed for Viscosity of Lubricating Oil Using Fourier Transform Infrared Spectroscopy”, International Journal of Science and Research(IJSR),Volume6Issue4,2017
[4] Bowman,W.F. and Stachowiak, G.W., “New criteria to assess the remaining useful life of industrialturbine oils”,LubricationEngineering,Vol. 52, No. 10,1996,pp. 745 750
[5] Diana Julaidy Patty and Richard R Lokollo, “FTIR Spectrum Interpretation of Lubricants with Treatment ofVariationMileage”AdvancesinPhysicsTheoriesand Applications ISSN2224 719X (Paper) ISSN2225 0638(Online)Vol.52,2016.
[6] F.R.Vandevoort, J.Sedman, R.A. Cocciardi and D.Pinchuk, “FTIR Condition Monitoring of In Service Lubricants: Ongoing Developments and Future Perspectives”, Tribology Transactions, 49:3,2006, pp.410 418
[7] R.W.Wilson and S.B.Lyon “Corrosion in Lubricants/Fuels”ElsevierB.V.,volume1,2010. Pp.143 154.
[8] Michael C. Garry and John Bowman,“FTIRAnalysisof UsedLubricatingOils General Considerations”, Thermo FisherScientific,Madison,WI,USA,2007.
[9] J.C.O.Santos, I. M.G.Santos and A.G.Souza, “Thermal DegradationProcessofSyntheticLubricatingOils:Part I Spectroscopic Study”, Petroleum Science and Technology,33:11,2015,pp.1238 1245
[10].D.Michele R, DusanStulik and James M.Landry, “Infrared Spectroscopying ConservationScience”. The GettyConservationInstitute,LosAngeles.1999.
[11]Arturwolak, Wojciech krasodomski, Grzegorzzajac, “FTIR analysis and monitoring of used synthetic oils operated under similar driving conditions”, Friction8(5):2020,pp.995 1006.