International Research Journal of Engineering and Technology (IRJET) e ISSN: 2395 0056

Volume: 09 Issue: 06 | Jun 2022 www.irjet.net p ISSN: 2395 0072
International Research Journal of Engineering and Technology (IRJET) e ISSN: 2395 0056
Volume: 09 Issue: 06 | Jun 2022 www.irjet.net p ISSN: 2395 0072
1Assistant Professor, Department of Civil Engineering, Ilahia College of Engineering and Technology, Kerala 2,3,4,5 Pursuing B. Tech in Civil Engineering
***
Abstract The increase in population and the scarcity of are in the expanding cities leads to the development of vertical buildings. The vertical construction helps in accommodate a huge amount of personnel in limited space. Natural hazards like earthquake, affects the stability of such structures. This requires advanced construction techniques as well as better design and analysis. Seismic analysis of such buildings should be done accurately and economically. This comparative study aims to find a median between static and dynamic analysis of a 3 storeyed building located in zone 3 in India. The main objective is to analyze and design such hazard resisting structures so, to save human life and avoid property damage and to choose an economical method of analysis.
Key Words: AUTOCAD, ETABS, Gravity Loads, Shear Force, Axial Force, Bending Moment, Displacement, Earthquake
Structural analysis is basically used to determine the behaviourofastructurewhensubjectedtoloads.Theload maybedynamicorstatic.Loadduetotheweightofthings such as people, furniture, etc. are termed as static loads. Loads due to dynamic loads as wind, explosions and an earthquakeshouldalsobeconsidered.Theseismicresponse of the building depends on the type of analysis method adopted where the loads act linearly or in a non linear manner
Theanalysismethodswereconfinedtostaticapproachdue toitssimplicityandthelackinginadvancedtechnology
Staticanalysis isbasedonreplacingconceptoftheinertia forces at various considerable masses i.e. stories by equal horizontalforcesthatarecorrespondingtotheweightofthe structureanditsacceleration.Theloadsactlinearlyandthis isrepresentedintheelasticregionofastress straingraph.
Thedevelopmentoftechnologyhelpedintheadvancement ofanalysisprogramsthatenablestheresearcherstomove forwardtowardsamorerationalapproachbysimulatingthe actual effect of earthquakes on the building models. This helps to obtain the realistic seismic response and this method is categorized under dynamic analysis. Dynamic
analysis describes and expects the structural movement casesundertheinfluenceofdynamicloads
TodrawtheplanofschoolbuildingusingAutoCAD2021 andthesectionsandlayoutofitsframesandslabs
To calculate and apply the gravity loads and different loadcombinationsasperIndianCodalprovisions
Toanalysethebuildingusinglinearstaticandresponse spectrumanalysisusingETABS
Todeterminethestorey displacementsfora3storeyed schoolbuilding.
Tomakecomparativestudyoftheresultsofparameters such as bending moment, shear force, axial force and displacement,obtainedfromstaticanddynamicanalysis.
3.
PreparationofplaninAutoCAD2021
ExportingtoETABS
Assigningloadsandloadcombinations
LinearStaticAnalysishasbeenusedforstaticanalysis
Responsespectrummethodhasbeenusedfordynamic analysis
Comparisonoftheresult
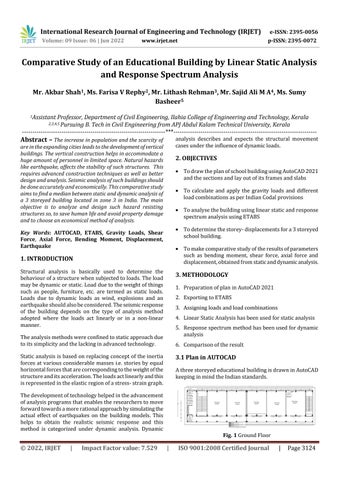
AthreestoreyededucationalbuildingisdrawninAutoCAD keepinginmindtheIndianstandards.
International Research Journal of Engineering and Technology (IRJET) e ISSN: 2395 0056
Volume: 09 Issue: 06 | Jun 2022 www.irjet.net p ISSN: 2395 0072
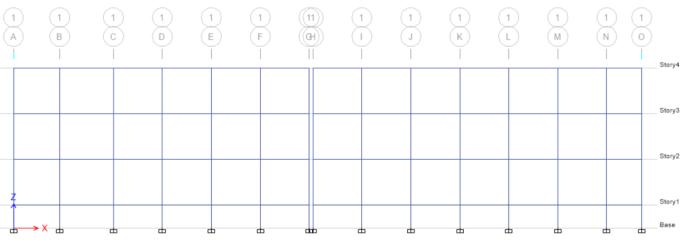
3.3 Exporting to ETABS
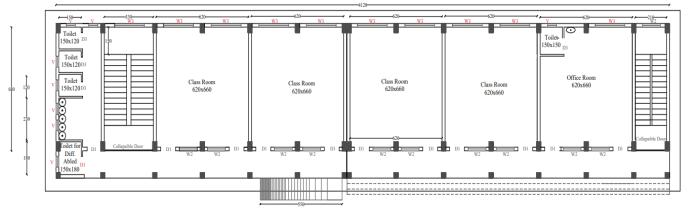
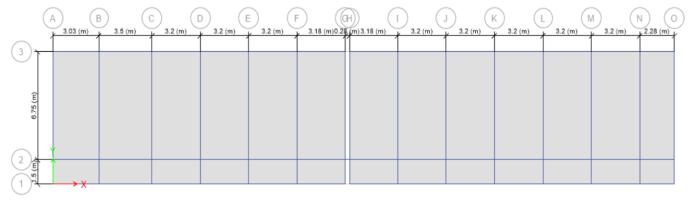
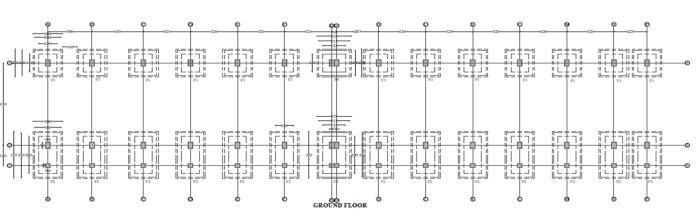
Fig. 6 Plan
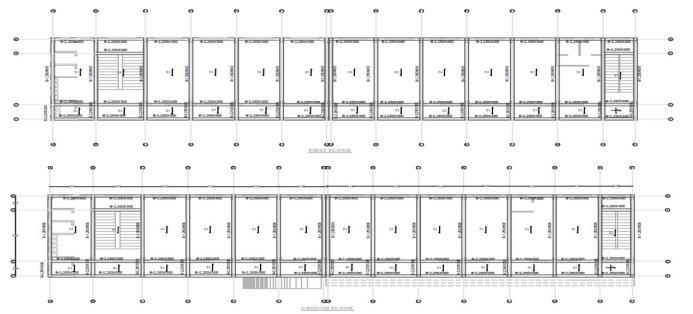
Fig. 2 SlabandBeamCenterLineDrawings
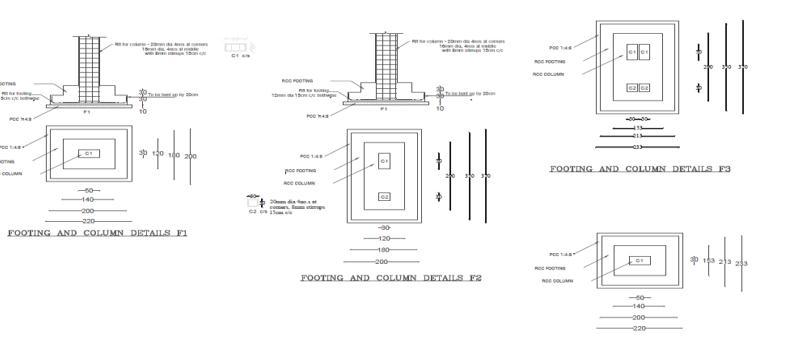
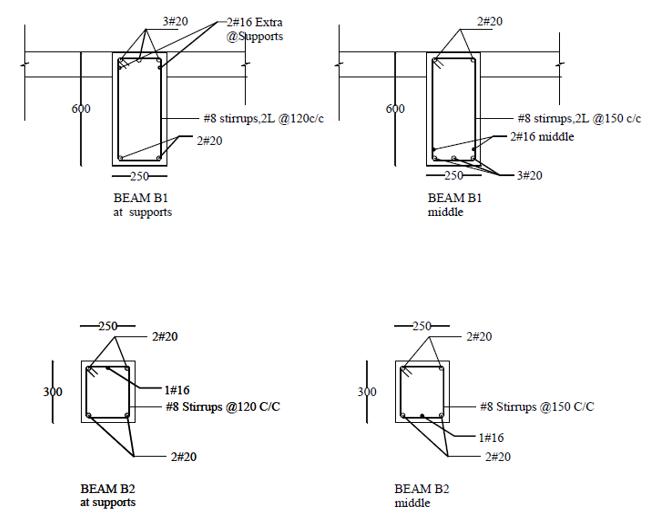
Fig. 3 SectionofBeams
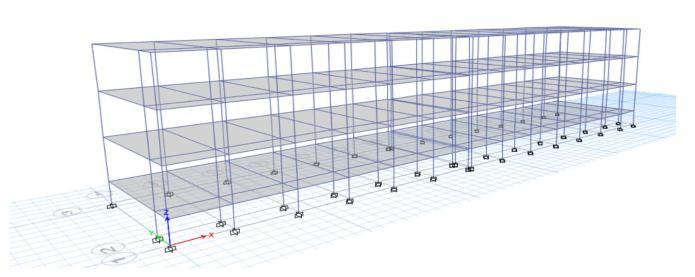
Fig. 7 Elevation
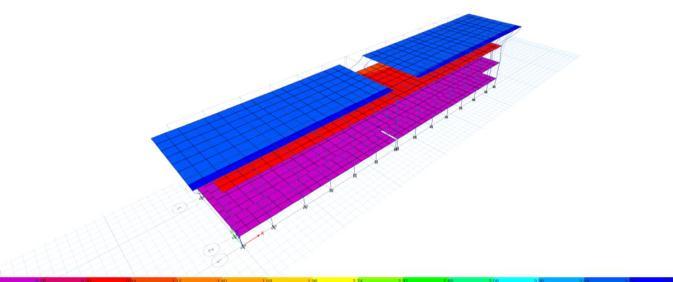
Fig. 8 3DView
3.4 Load Calculation for Frames
(DeadLoad=Unitweightof concrete XUnitvolumeofthe material)
Table 1 PlinthBeam
Fig. 4 FootingCenterLine
Plinth Beam
PB1
Dead Load
25×0.3×0.6=4.5kN/m
PB2 25×0.3×0.5=3.75kN/m PB3 25×0.3×0.5=3kN/m PB4 25×0.3×0.3=2.25kN/m
Table 2 Wall
Beam Dead Load
B1
25×0.25×0.6=3.75kN/m
B2 25×0.25×0.3=1.875kN/m
Fig. 5 SectionofFooting
2022, IRJET | Impact Factor value: 7.529 | ISO 9001:2008 Certified Journal
International Research Journal of Engineering and Technology (IRJET) e ISSN: 2395 0056
Table 3 Beam Wall Dead Load
W1 25×0.3=7.5kN/m W2 25×0.3=7.5kN/m
Table 4 Slab
Floor Finish 1kN/m2
Slab Live Load (IS 875 Part 2: 2002)
Dead Load
S1 3KN/m 25×0.12×1=3kN/m2
S2 3KN/m 25×0.12×1=3kN/m2
In the limit state design of reinforced and prestressed concretestructures,thefollowingloadcombinationsshallbe accountedfor: 1)DL+LL 2)1.5(DL+LL) 3)1.2(DL+LL+EQx) 4)1.2(DL+LL EQx) 5)1.2(DL+LL+EQy) 6)1.2(DL+LL EQy) 7)1.5(DL+EQx) 8)1.5(DL EQx) 9)1.5(DL+EQy) 10)1.5(DL EQy) 11)0.9DL+1.5EQx 12)0.9DL 1.5EQx 13)0.9DL+1.5EQy 14)0.9DL 1.5EQy 15)Envelope
3.9 Seismic Loading IS 1893.1.2016
1)
Theeccentricityofacircle=0
Theeccentricityofanellipse=between0 and1
Theeccentricityofaparabola=1
Theeccentricityofahyperbola>1
Theeccentricityofaline=infinity
XdirectionEqx
YdirectionEqy
Eccentricityratio=0.05
Storey1 Storey4
Responsereductionfactoristhefactorbywhichthe actualbaseshearforceshouldbereduced,toobtain the design lateral force during design basic earthquakeshaking.Theresponsereductionfactor (R)isbasicallydependsonthestrength,Ductility, Redundancy. So, there is a need to come up with realistic R factors for different structural systems thatchangesindifferentregionsconsequently.
Responsereductionfactor=5
4) Seismic coefficients (IS 1893:2016 for Zone 4 Gujarat)
The Seismic coefficients aredimensionless coefficients which represent the maximum earthquake acceleration. It is represented as a fractionoftheaccelerationduetogravity.
Seismiczonefactor=0.24
Soilsitetype=II
Inseismicdesign,occupancyimportancefactor(IF) is a multiplier to increase or decrease the design base shear, according to different occupancy categoriesortheimportanceclassofabuilding.
Importancefactor=1.5
Alinearstaticanalysisisananalysiswherealinearrelation holdsbetweenappliedforcesanddisplacements.Inpractice, this is applicable to structural problems where stresses remaininthelinearelasticrangeoftheusedmaterial.Ina linearstaticanalysis,themodel’sstiffnessmatrixisconstant, andthesolvingprocessisrelativelyshort.Therefore,fora firstestimate,thelinearstaticanalysisisoftenusedpriorto performingafullnonlinearanalysis.
Volume: 09 Issue: 06 | Jun 2022 www.irjet.net p ISSN: 2395 0072 © 2022, IRJET | Impact Factor value: 7.529 | ISO 9001:2008 Certified Journal | Page3126
International Research Journal of Engineering and Technology (IRJET) e ISSN: 2395 0056
Volume: 09 Issue: 06 | Jun 2022 www.irjet.net p ISSN: 2395 0072
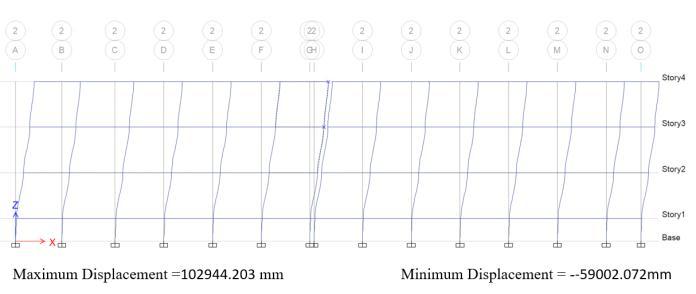
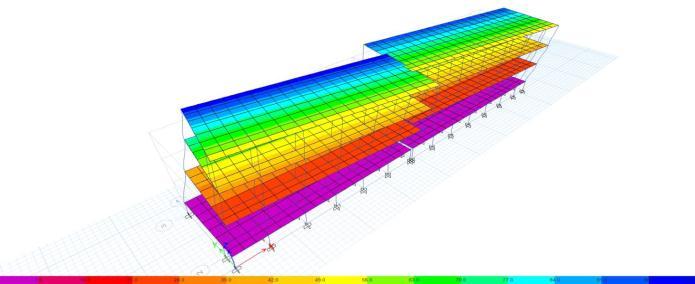
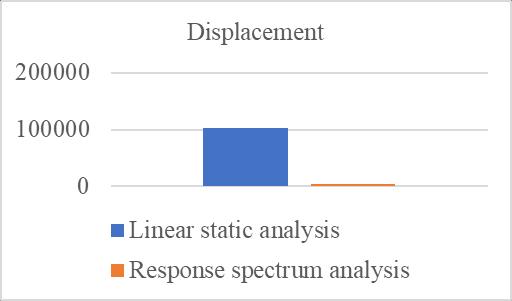
Themaximumdisplacementobtainedis102944.203mmand theminimumdisplacementobtainedis 59002.072mm.The parametersthatweretakenintoaccountforthecomparison includes the bending moment, shear force and axial force values.
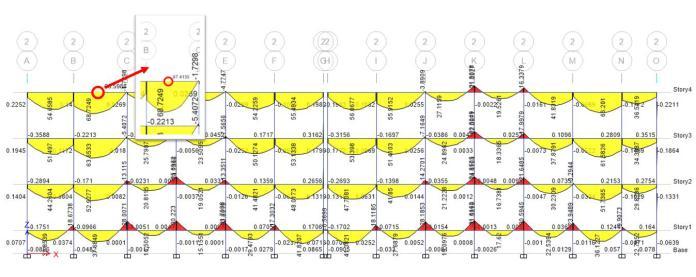
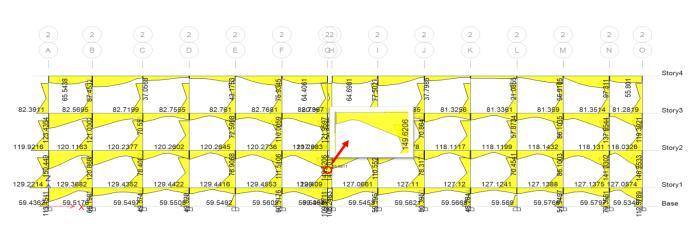
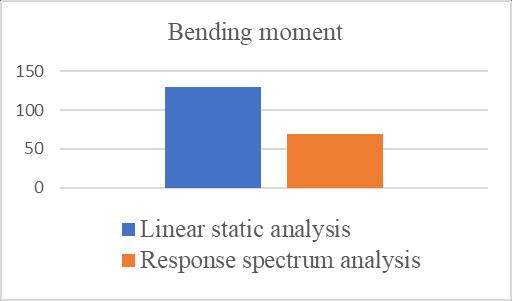
Themaximumbendingmomentobtainedis129.6246kNm atstorey1.
Fig. 10 BendingMomentDiagram
Themaximumaxialforceobtainedis98.3727kNatstorey1.
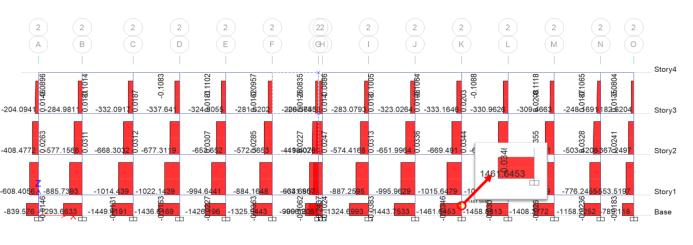
Themaximumaxialforceobtainedis 1461.6453kN.
Theresponsespectrumanalysisoneofthemostimportant methodsofdynamicanalysis.Thisanalysisisalsoknownas modal method or the mode superposition method. It is definedasthecombinationofplotofacceleration,velocity anddisplacement.Theyareasymmetricalorhaveareasof discontinuityirregularity,intheirlinearrangeofbehavior and belong to the plastic region. From IS1893.1.2001 The designhorizontalseismiccoefficientAhforastructureshall bedeterminedbythefollowingexpression
Ah=����Sa/2����=0.0091
Themaximumdisplacementobtainedis3422.678mmand theminimumdisplacementobtainedis 3432.84mm.
The bending moment force obtained is 68.7349kNm at storey4.
Fig. 15 BendingMomentDiagram
International Research Journal of Engineering and Technology (IRJET) e ISSN: 2395 0056
Thebendingmomentforceobtainedisat11.165kNatstorey 3.
Maximumdisplacementobtained=3422.5mm.
Themaximumbendingmomentobtained=68.5kNmat storey4.
Themaximumaxialforceobtainedis= 1451kN.
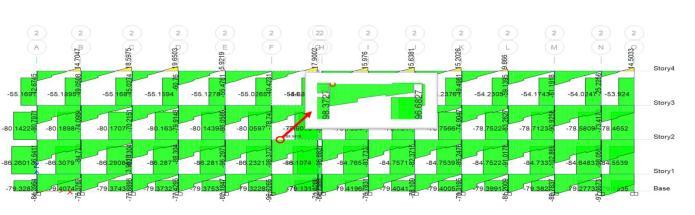
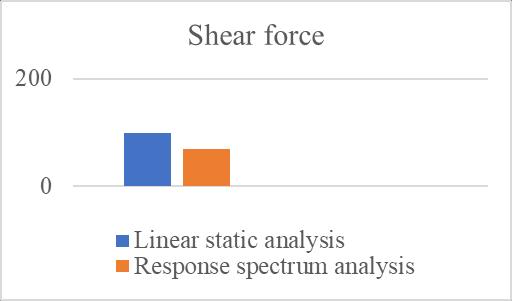
The maximum shear force obtained is = 68.5 kN at storey3.
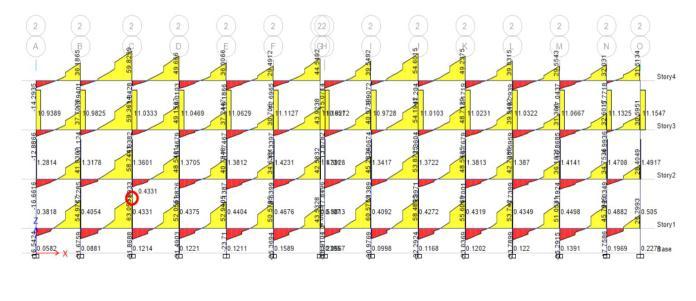
Fig. 16 ShearForceDiagram
Thebendingaxialforceobtainedis 1451.0105kN.
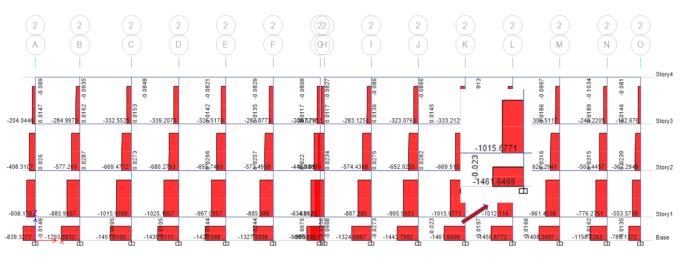
Fig. 19 DisplacementGraph
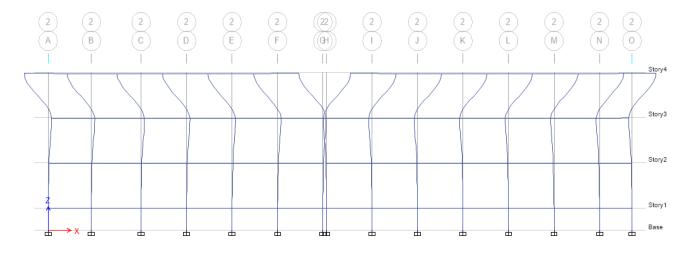
Fig. 17 AxialForceDiagram
Fig. 18 DeformedShape
Maximumdisplacementobtained=102944mm.
Themaximumbendingmomentobtained=129.5Nmat storey1.
Themaximumaxialforceobtained= 1461.5kN.
Themaximumshearforceobtained=98kNatstorey1.
Fig. 20 BendingMomentGraph
Fig. 21 ShearForceGraph
Volume: 09 Issue: 06 | Jun 2022 www.irjet.net p ISSN: 2395 0072 © 2022, IRJET | Impact Factor value: 7.529 | ISO 9001:2008 Certified Journal
International Research Journal of Engineering and Technology (IRJET) e ISSN: 2395 0056
Volume: 09 Issue: 06 | Jun 2022 www.irjet.net p ISSN: 2395 0072
Fig. 22 AxialForceGraph
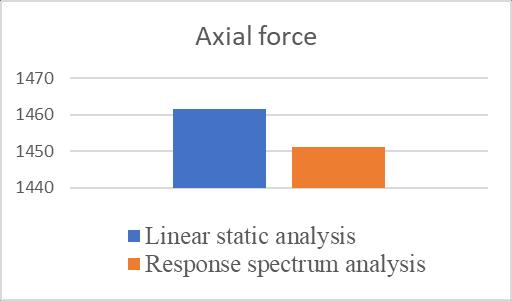
ResultsfromLinearstaticanalysisandResponsespectrum analysisforaG+3storiedbuildinginseismiczone4andsoil typeII.Thebendingmomentis88.5%moreinlinearstatic analysisthanresponsespectrumanalysis.Theaxialforceis 0.73%moreinlinearstaticanalysisthanresponsespectrum analysis. The shear force is 43% more in linear static analysisthanresponsespectrumanalysis.Thedisplacement value, bending moment value, axial force value and shear forcevaluesoflinearstaticanalysisaremorethanthevalues of response spectrum analysis. So, response spectrum analysismayberecommended.
1. Balaji.UandSelvarasanM.E“DesignandAnalysisofMulti Storied Building Under Static And Dynamic Loading Condition Using ETABS.” International Journal of TechnicalResearchandApplicationsVolume4,Issue4. (July Aug,2016)
2. AnirudhGottala,Dr.shaikYajdhani“ComparativeStudyof Static and Dynamic seismic Analysis of Multistoried Building.” IJSTE International Journal of Science Technology & Engineering | Volume 2 | Issue 01 | July 2015
3. MaheshN.Patil,YogeshN.Sonawane“SeismicAnalysisof Multistoried Building”, International Journal of EngineeringandInnovativeTechnology(IJEIT),Volume 4,Issue9,March2015
4. Mohammed Rizwan Sultan, D. Gouse Peera “Dynamic Analysis of Multi storey building for different shapes”, InternationalJournalofInnovativeResearchinAdvanced Engineering(IJIRAE),Issue8,Volume2(August2015).
2022, IRJET | Impact Factor value: 7.529 | ISO 9001:2008 Certified