International Research Journal of Engineering and Technology (IRJET) e-ISSN: 2395-0056

Volume: 09 Issue: 06 | June 2022 www.irjet.net p-ISSN: 2395-0072
International Research Journal of Engineering and Technology (IRJET) e-ISSN: 2395-0056
Volume: 09 Issue: 06 | June 2022 www.irjet.net p-ISSN: 2395-0072
1Rajesh Prasad, 2Achal R. Mate, 3Pushkar A. Narkhede
1,2,3MIT School of Engineering, MIT Art Design and Technology, Pune, India ***
Abstract At present time Liver Disease is the most dominant medical issue all over the world, as about 2 billion patients die. Due to the fact that liver illness is frequently discovered at a late stage, which results in mortality Early Diagnosis and treating patients are compulsory to reduce the risk of that lethal disease, but no system detects liver disease in the early stage. In order to help the medical community begin treating liver damage properly, this article intends to create a system that can identify liver illness in its early stages as well as the severity of the condition. Additionally, it can reduce the chances of patient death and liver transplant and allow doctors to understand the severity of the liver. In order to classify the Indian Liver Patient Dataset (ILPD), we tested several machine learning (ML) techniques, including Logistic Regression (LR), Support Vector Machine (SVM), Decision Tree (DT), Ada Boost Classifier (ADB), and Xgboost Classifier (XGB). The experimental results showed that AdaBoost Classifier performs well with the highest accuracy of 99 percent. The data set has been investigated with regard to precision, TP rate, FP rate, and Kappa statistics. This classification system is evaluated for accuracy using a confusion matrix. After that Severity prediction is done using Rule Engine, It is fully customizable by Doctors on medical attributes to predict the severity of liver disease in different geographical locations, and Environment conditions that effects on medical attributes of liver disease.
Keywords Liver Disease, Mortality, Prediction, Severity, Hybrid Machine Learning, Classification, Clustering, Rule Engine.
Recent years have seen an increase in the number of researchers creating automated disease prediction models utilizing supervised machine learning techniques. The likelihood of patients dying from diseases can be reduced with an early liver disease diagnosis. Our project aims to develop a system that can detect the liver disease in the earlier stage as well as the severity of the detected liver disease so that the patient gets the early meditation and proper treatment to recover from liver disease. In this study, an effective automated liver disease prediction model is created using a machine learning algorithm approachwithhybridmodelingandpredictingtheseverity
of that liver disease by using the medical history, characteristics, pathological test, and blood report information. To do this, we use a simple rule engine with specificmedicalcharacteristicsthatpredicttheseriousness oftheliverdiseaseandareintegratedintoawebappusing a flask. In the proposed model, the data is entered by the user through and web app, the analysis is then performed in a real time by using a pre trained machine learning model which is already integrated into the web app, and finally, a liver disease detection along with its severity is shown on the web app. In our system, we are generating the Lab report where the report consisting of the patient detailed symptoms and the result of our ML model. Comparativeinvestigationshowsthatthesuggestedmodel can assist doctors in prescribing treatments drugs in a timelymanner.
In the past years, several types of research have been done on liver disease classification Vasan D, Suyan R, DineshK“LiverDiseasePredictionusingmachinelearning” [1]:ThemedicinalenzymefeaturesfromtheUCIrepository datasetonILPDareextractedinthisresearchprojectusing data mining techniques like PSO Feature Selection (Indian LiverPatientDataset).Predictingliverdiseaseisthemajor goal.Thepredictionprocessbasicallyconsistsoffiveparts. To normalise the data, theMin Max technique is first used totheILPD.Significantfeaturesarethenextractedutilising PSO feature selection techniques. The classification ofliver diseases occurs in the third phase, which employs algorithms like J48, Naive Bayes, and Support Vector Machine(SVM).Thebestclassifierwithahighaccuracyand precisionscoreisevaluatedusingevaluationmetricsinthe fourthphase.Acomparisonofeachclassifierismadeinthe finalstageforselectingoutperformingclassifiers.
Rakshith D B, Mrigank S,Ashwani K,Gururaj S P “Liver Disease Prediction System using Machine Learning techniques”[2]: The primary goal of the research is to estimatethelikelihoodofdevelopingliverdiseaseusingthe UCI ILPD's medical characteristics (Indian liver patient dataset). In this research work, a variety of machine learningclassifiersisappliedtoUCIILPDtopredicttherisk ofliverdiseaseusingallfeaturesandon582instances.The classifier SVM (support vector machine) is 100% accurate when compared to KNN (K Nearest Neighbors), ANN (artificialneuralnetwork),andNaiveBayes.
International Research Journal of Engineering and Technology (IRJET) e-ISSN: 2395-0056
Volume: 09 Issue: 06 | June 2022 www.irjet.net p-ISSN: 2395-0072
Md Fazle R, S M Mahedy H, Arifa I C, Md Asif Z, Md Kamrul H “ Prediction of Liver Disorder using machine learningalgorithm:Thegoalofthisstudyistoforecastliver illness utilizinguseful medical characteristics fromthe UCI ILPD(IndianLiverPatientDataset).Thecomparativestudy of 5 different machine learning techniques is done to accurately classify if the patient is suffering from liver disease or not. Comparing the experimental result, the boostingclassifier(AdaBoost)isfoundasthebestclassifier with PCC FS (Pearson Coefficient Correlation Feature Selection).ThePCC FSisappliedonUCIILPDtoextractthe significant features to evaluate the relationship between thedependentandindependentfeatures.
Sateesh A, Vijayalaxmi A, Rashmi U, Shruthi P, Vilaskumar P “Optimizing Liver Disease Prediction with random forest by various data balancing techniques” [4]: The main focus of this research is the optimization of Random forest algorithm using hyperparameter tunning, rather using different machine learning algorithm directly. DifferentdatabalancingtechniquesareappliedtoUCIILPD to balance the data. Cluster Centroids, Condensed Nearest Neighbour, and ALLKNN data balancing techniques are used.Randomforest(RF)withdifferentstatisticalmethods such as Feature selection, data transformation PCA (Principal Component Analysis), and data balancing experiment. For final experimentation confusion matrix and classification report with more focus on precision, recall,andROC(ReceiverOperatingCharacteristics)results werecompared.
Javad H, Hamid S, Abdollah D, Shahaboddin S “ Computer aided decision making for predicting liver disease using PSO based optimized SVM with feature selection”[5]: Identification of significant features from a UCI ILPD is the purpose of this research work. For feature significanceandimportancetree basedmodellingmethods such as information gain, Entropy, and Gini impurity measure are used as PSO Selected features are also subjectedtoarangeofmachinelearningmethods,andtheir effectiveness is assessed using the FPR (False Positive Rate), ROC (Receiver Operating Characteristics), Accuracy, andFmeasure.
S. Vijayarani, S. Dhayanand el at “ Liver Disease predictionusingSVMandNaïveBayesAlgorithm”[6]: The majorgoalofthisstudyistouseUCIILPDtopredictseveral formsofliverillness,includingcirrhosis,hepatitis,andliver cancer.TheNaveBayesalgorithmandSVM(SupportVector Machine)areusedtopredictliverillness.Theclassification of liver disease type is carried out by taking into account theresultsoflabtestsandliverfunctiontests.
Kalyan N, Amulyashree S “NeuroSVM: a graphical user interfaceforIdentificationofLiverPatient”[7]:Datamining techniques are used in this study's classification of liver disease. On the UCI ILPD, the naive bayes, random forest, bagging,andANN(artificialneuralnetwork)algorithmsare
used. Additionally, a hybrid neuroSVM model combining SVM and a feed forward neural network was created to improveaccuracy.Thefeed forwardneuralnetwork'sinput istheSVMpredictionoutcomebasedonactualdata.
MengZ,ChangjunS,TaoL,TianyueH,ShimingL “Fatty Liver Disease Prediction Model Based on Big Data or Electronics Physical Examination records” [8]: The researchersmainlyfocusonthepredictionofthefattyliver based on health records collected from the hospital. The dataset is also subjected to the chi squared test, with a significance level of 0.05 percent, to determine the significance of the features. The xgboostst (Extreme Gradient Boost) algorithm is then used to make the final prediction, with Bayesian optimization on the hyperparameterandtriplecross validation.
Jagdeep S, Sachin B, Ranjodh K “Software based Prediction of Liver Disease with Feature Selection and ClassificationTechniques”[9]: WorkedonUCIILPDdataset for identification of liver disease using software engineering approaches and machine learning techniques. Without feature selection, the efficiency of the machine learning algorithm is low was analyzed. In their proposed work featureselectiontechniquesareusedforcomparison ofdifferentmachinelearningalgorithms.
IvairP,DenioD,GuilhermeDB,JulyanaFL“Exploratory Analysis of Electronic Health Records using Topic Modelling” [9]: The researchers mainly focus on Exploratory Data Analysis for features importance, a Significance level of Electronics Health RecordsThe topic modeling technique is used for information discovery and topic extraction for better insights from data. LDA (Linear Discriminant Analysis) is applied to a dataset for discoveringthelatenttopicsfromtherecords.
NazimRazali“Adataminingapproachtotheprediction of liver disease”[10]:Researchers work onUCI ILPD tothe extraction of important features which are useful for the classification of liver disease. Using a variety of hybrid machines and deep learning approaches the final classification is done. Additionally, for a highly accurate approach metrics such as precision, recall, and accuracy is analyzed The author’s main focus is only on the improvement of accuracy, precision, and recall metrics using different hybrid approaches and data mining techniques
ThirunavukkarasuK,AjaySS,MdIrfan,AbhishekCelat “Prediction of liver disease using classification algorithm” [11]: The goal of the authors is to use a different machine learningalgorithmtocategorizewhetherapatienthasliver diseaseornot.Theperformancemetricisemployedforthe final classification and accurate approach, and sensitivity andspecificityaregivengreaterattention.
International Research Journal of Engineering and Technology (IRJET) e-ISSN: 2395-0056
Volume: 09 Issue: 06 | June 2022 www.irjet.net p-ISSN: 2395-0072
Fahad M, Easy H, Morgan W, Hafiz K, “Statical Machine Learning Approaches to Liver disease prediction” [12]: Using Machine learning and statistical techniques a classifier is applied to selected and significant data Hypothesis testing is implemented for identifying significant features from medical records. PCA (Principal ComponentAnalysis)techniqueisappliedtodatatoreduce thedimensionofthebigdatasetobtainedfromthehospital. To find the relevant PC,variable importance rankingusing the Gini index is used (Principal Component). On the selected PC’s variety of Machine learning algorithms are applied as a binary classifier for the prediction of liver disease.
Keerthana PSM, Nimish P,Riya M, Koppula Bhanu P R, NidhiL “APredictionModelofDetectingLiverdiseasein a patient using Logistic Regression of Machine Learning” [13]: Researchers significantly utilized the Logistics Regression as a pre processing technique for data pre processing. Additionally ANN (Artificial Neural Network), and RF (Random Forest) are utilized for accuracy in classification. Using ROC (Receiver Operating Characterises)thefinalresultisdrawn.
InshaA,ChiranjitD,TanupriyaC,AbhaT“LiverDisease Detection due to excessive alcoholism using data mining techniques”[14]:Researchers want to employdata mining techniques to provide an early forecast of liver damage brought on by excessive alcohol use. By applying various data mining approaches such as SMO (Sequential Minimal
Optimisation), Bayes Net, and J48 to the dataset the best approach is finalized considering the accuracy. Before classification data clustering is done on instances showing similartestresults
L. Alice Auxilia “Accuracy Prediction using Machine LearningTechniquesforIndianPatientLiverDisease”[15]: The author’s main focus is to predict the liver malady (hepatic infection) of liver disease. Additionally, common machine learning algorithms are utilized for achieving higheraccuracybyconsideringtheperformancemetrics.As a pre processing step correlation and significant features are extracted. Comparison of algorithm done by using confusion metrics by focusing on the accuracy, precision, andrecallscore
The majority of the time, the early signs of liver illness are mild and difficult to spot. Even a healthy individual with fatty liver disease does not exhibit any symptoms in the early stages, and it eventually results in liver transplantationordeath.Thegreatestsolutionistopredict liver disease at an early stage. This study aims to forecast theseverityandonsetofliverdiseaseatanearlystage.We canidentifyliverdiseaseatanearlystagebyreviewingthe results of the linked blood tests and liver function tests, and by taking into account the typical ranges of the enzymes, we can classify the expected liver disease's severity.
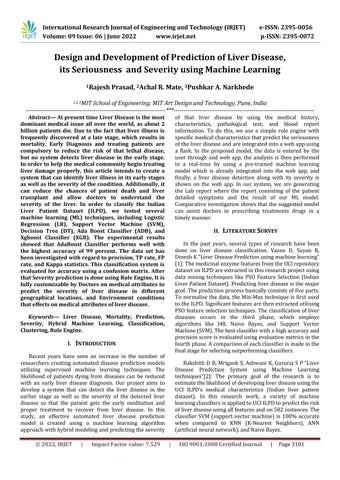
Figure1:SystemArchitectureDiagram
International Research Journal of Engineering and Technology (IRJET)
e-ISSN: 2395-0056
Volume: 09 Issue: 06 | June 2022 www.irjet.net p-ISSN: 2395-0072
The dataset, known as the Indian Liver Patient Dataset (ILPD)[15], was taken from Kaggle. The target variable is one of 11 features present in 30691 cases in this dataset. Age, gender, direct and total bilirubin, alkaline phosphatase, alamine aminotransferase, aspartate aminotransferase, total proteins, albumin, albumin and globulinratio,andtargetaretheattributes.
Thedatasetincludes8774patientrecordswhodon'thave liverdiseaseand21917patientrecordsthatdo.
Missing Values: Dataset contains 5425 null data points and by dropping null data points we get 27158instances.
decision tree represents a test on a property, each branchreferstotheoutcomeofa test,and eachleaf (orterminal)hubhasaclassname. Thehighesthub in a tree is the root hub. There are numerous particulardecisiontreecalculations[17].
SVM,orSupportVectorMachine,isatoolthatcanbe used for both classification and regression tasks. However, it is frequently employed in classification goals. The support vector machine approach seeks to locate an N dimensional space hyperplane that clearly categorises the data points. Support Vector Machine is non probabilistic, so they assign a data pointtoaclasswith100%certainty.[11]
Data Duplication: Data contains 10769 duplicate rows and by dropping duplicate rows we left with 16389instances.
Data Normalization: Data transformation methods likestandardscalarareusedtonormalisedata.
The probability for classification issues with two possible outcomes are modelled using supervised MLwithlogisticregression.Itisamodificationofthe linear regression model for issues with classification.[16].Whenpredictingthebinaryresult for a given collection of independent variables, the logistic regression model uses the logistic function tosqueezetheoutputofalinearequationbetween0 and1.
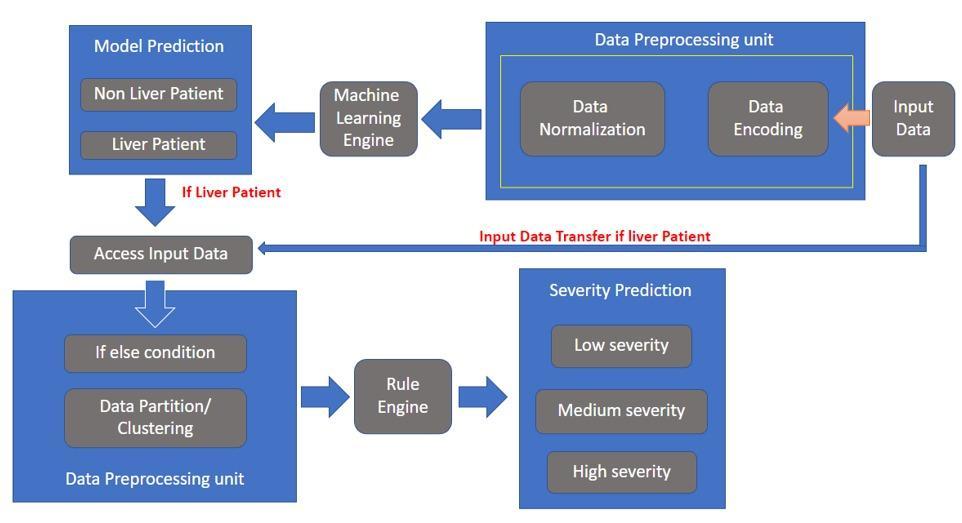
We have 11750 liver patients and 4639 non liver patients after cleansing the data. It includes 4975 records for female patients and 11414 records for male patient Is showninFigure:2
"Target" is a class label with two classes liver patients (disease)ornot(nodisease).
A supervised machine learning model called a decision tree can be applied to classification and regression issues. Each interior (non leaf) hub of a
One of the iterative ensemble boosting classifiers is ADA boost, also known as adaptive boosting. To improve classifier accuracy, it combines several classifiers.AdaBoostclassifiercombinesanumberof ineffective classifiers to create a strong classifier thathasahighdegreeofaccuracy.Thefundamental ideaunderlyingAdaBoostistotrainthedatasample and set the classifier weights in each iteration to provide accurate predictions of uncommon observations. If a machine learning algorithm accepts weights from the training set, it can be utilisedasabaseclassifier.
Gradient Boosted decision trees are embodied in XGBoost. This technique generates decision trees in a sequential manner. In XGBoost, weights are significant. All independent variables are given weights, which are subsequently used to feed information into the decision tree that forecasts outcomes. Variables that the tree incorrectly predictedaregivenmoreweightbeforebeingplaced intotheseconddecisiontree.Tocreatearobustand accurate model, these independent classifiers and predictorsarethencombined.
International Research Journal of Engineering and Technology (IRJET)
e-ISSN: 2395-0056
Volume: 09 Issue: 06 | June 2022 www.irjet.net p-ISSN: 2395-0072
Six distinct classification techniques, including Decision Tree (DT), Logistic Regression (LR), Support Vector Machine (SVM), AdaBoost Classifier (ADB), and XGBoost Classifier,areusedtoassesstheresults(XBG).Thedataset is split into a training set and a testing set for the experiment. The percentages for the training set are 70% and 30%, respectively. In this study, the machine learning modelistrainedandtestedusing10 foldcross validation.
Below isa list of the evaluation measures thatare used to gaugehowwellmodelsfunction.
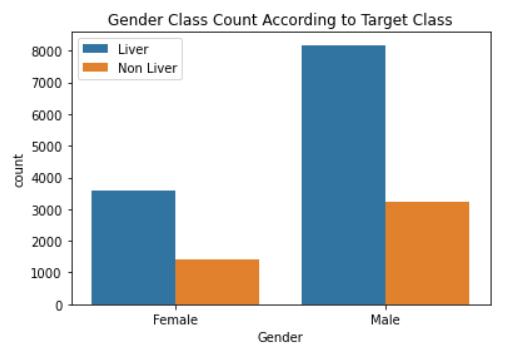
The Confusion Matrix is the tabular representation of actualorpredictedvalues[11].Toassesstheparameters,a confusion matrix madeupofTP,FP,TN,andFN foractual andpredicteddataiscreated.
The proportion of correctly identified samples to all samplesisknownasaccuracy.
Accuracy=(TP+TN)/(TP+TN+FP+FN)(2)
Precisionisdefinedasthedivisionofpositivecasesamong allexamplesthatweprojectedtobepositive.
Precision=(TP+TN)/N(4)
Theperformanceofabinaryclassifierisevaluatedusinga single scalar metric called the Area Under a Receiver Operating Characteristic (ROC) Curve. The AUC value falls between (0.5 1.0), where the least value corresponds to a random classifier's performance and the maximum value wouldindicateaperfectclassifier.[19]
The F1 score combines the precision and recall of a classifier into a single metric by taking their harmonic mean. It is primarily used to compare the performance of twoclassifiers.[18]
F1 = P+R2/(P∗R)(5)
Cohen Kappa is an evaluation metric that is often used to measure the degree of agreement between pair of variables, frequently used as a metric of inter rater (two raterswhoareratingthesamequantity)agreement.Kappa compares the probability of agreement to that expected if theratingsareindependent
B. result:
We have train the model on five different classifiers in order to predict whether the person will survive liver diseaseornot.:
Table1:Performancemeasurementparametersforthe predictionofLiverdisease fiveusingmachinelearning techniques
Accuracy Recall Precision F1 score
DT 0.99 1 1 1
LR 0.72 0.55 0.18 0.27
SVM 0.73 0.74 0.05 0.10
Recall is also viewed as being sensitive. the proportion of actualpositivecasestoallpositivecases.Itistruepositive rate states how many positive values out of all positive valueshavebeencorrectlypredicted.[11]
Sensitivity=TP/(TP+FN)(3)
ADD 0.78 0.65 0.49 0.56
XGB 0.99 1 1 1
From the above table, we can say that DT and XGB are working properly on the testing dataset with 0.99 of testingAccuracy,ButLR,SVM,andADBhavelessAccuracy, Sohyperparametertuningisperformedonthatclassifier.
International Research Journal of Engineering and Technology (IRJET) e-ISSN: 2395-0056
Volume: 09 Issue: 06 | June 2022 www.irjet.net p-ISSN: 2395-0072
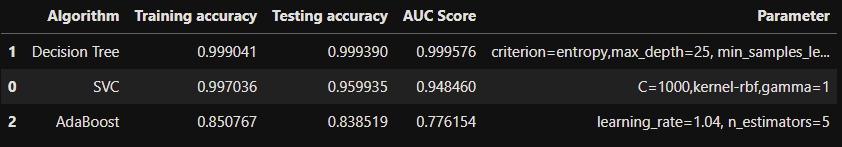
FromFigure4:TheaccuracyofDTremainsthesameafter performing hyperparameter tuning, but there is an increaseintheaccuracyof SVCto0.99andADBto 0.85.It contains the selected parameter after performing parametertuning
Adecisiontreeisatree basedalgorithmthatusesimpurity level and information gained for feature importance, therefore many times decision trees overfit according to the features. Whereas AdaBoost is a boosting and sequential machine learning approach that uses weak learners for prediction. AdaBoost by default uses a decision tree with 1 split along. Additionally, it uses a learningrateandweightstofocusonnon learnedandless signified featuresof data. FirstAdaBoost assigns thesame weights to all examples and then assigns high weights to themisclassified data togivemoreimportance tothe data points in the next iteration. Dual tuning is performed by AdaBoost,on theseconditerationaccuracyis increasedto 99.87%.
The results show that the F1 Score value is 1, the Precisionvaluesare1,andtheRecallvalues0.1
Since in medical terms, test sensitivity is the ability of the test to correctly identify those with the disease thus Ada Boost Classifier is the best model for predicting liver disease.[11]
Afterdevelopingaclassifiermodel,AdaBoostClassifiercan accurately classify a person's likelihood of having liver illnessat99.87percent.Wehavecreatedaruleenginethat categorizes liver disease severity into three groups: Low, Normal, and High. Figure 1. The System's design contains the developed loop system's architecture. The process datasets, which are medical parameters used to measure the disease, are entered into the rule engine. Each feature (medical parameter) in the dataset has a range that is determinedtodividetheseverityintothreecategories.
For group division, a hierarchical model of the if else conditional ladder is utilized, and an unsupervised clustering algorithm is used to create a cluster of three names:Low, Normal,andHigh.In orderto builda cluster, hierarchical clustering and KMeans were both utilized, withthebestoutcomecomingfromhierarchicalclustering. The rule engine is a customized rule engine where the outcome can be obtained by manually updating the parametricvariables.Dataandresultsfromtheprocessing unit are then sent to a custom rule engine, which is managed by the doctor. Depending on patient data and geographiclocations,doctorscanmanuallyenterattribute values and modify attribute ranges. Therefore, the established rule engine may be evaluated, cross checked,
and validated by the medical professionals. After that, a final yet correct result is generated and put to the test by medical professionals. Finally, severity is forecasted utilizinghybridmachinelearningtechnology.Oncealifeis saved, which is the most valuable ROI in this paper, it is crucial to predict disease in its early stages and to begin propertreatment.
For the purpose of predicting liver illness, various classification methods, including Logistic Regression, Support Vector Machine, Decision Tree Classifier, Ada Boost Classifier, and Xgboost Classifier, have been utilized inthisstudy.Thesemethodshaveallbeencomparedbased on classification accuracy, which is discovered using a confusion matrix. The Decision Tree has the highest accuracy from the experiment, whereas the Ada Boost Classifier has the most sensitivity. AdaBoost Classifier is chosen as the best candidate for predicting liver illness because of its 99.87 percent accuracy and 99.0% sensitivity. Utilizing a rule engine to estimate the severity of a condition based on a set of liver disease symptoms. The data are divided into three groups of three using hierarchical clustering: low, normal, and high. Thus, it can
International Research Journal of Engineering and Technology (IRJET) e-ISSN: 2395-0056
Volume: 09 Issue: 06 | June 2022 www.irjet.net p-ISSN: 2395-0072
besaidthattheseverityofliverdiseasecanbeanticipated utilizinghybridmachinelearningtechnology.
[1] Vasan D, Suyan R, Dinesh K “Liver Disease Prediction using machine learning” **** Phil. Trans. Roy. Soc. London, vol. A247, pp. 529 551, April 1955. (references)
[2] RakshithDB,MrigankS,AshwaniK,GururajSP“Liver Disease Prediction System using Machine Learning techniques
[3] Md Fazle R, S M Mahedy H, Arifa I C, Md Asif Z, Md KamrulH“PredictionofLiverDisorderusingmachine learningalgorithm:Acomparativestudy”
[4] Sateesh A, Vijayalaxmi A, Rashmi U, Shruthi P, Vilaskumar P “ Optimizing Liver Disease Prediction with random forest by various data balancing techniques”
[5] Javad H, Hamid S, Abdollah D, Shahaboddin S “ Computer aided decision making for predicting liver disease using PSO based optimized SVM with feature selection”
[6] Dr. S. Vijayarani, S. Dhayanand “ Liver Disease predictionusingSVMandNaïveBayesAlgorithm”
[7] KalyanN,AmulyashreeS“NeuroSVM:agraphicaluser interfaceforIdentificationofLiverPatient”
[8] MiningngpiZ,ChangjunS,TaoL,TianyueH,ShimingL “Fatty Liver Disease Prediction Model Based on Big DataorElectronicsPhysicalExaminationrecords”
[9] Ivair P, Denio D, Guilherme D B, Julyana F L “Exploratory Analysis of Electronic Health Records usingTopicModelling”
[10] Nazim Razali “A data mining approach to the predictionofliverdisease”
[11] Thirunavukkarasu K, Ajay S S, Md Irfan, Abhishek C “Prediction of liver disease using classification algorithm”
[12] FahadM,EasyH,MorganW,HafizK,“StaticalMachine LearningApproachestoLiverdiseaseprediction”
[13] Keerthana PSM,NimishP,RiyaM,KoppulaBhanuPR, NidhiL“APredictionModel ofDetectingLiverdisease in a patient using Logistic Regression of Machine Learning”
[14] Insha A, Chiranjit D, Tanupriya C, Abha T “Liver Disease Detection due to excessive alcoholism using dataminingtechniques”
[15] Available: https://www.kaggle.com/datasets/abhi8923shriv/liv er disease patient dataset
[16] Available:https://christophm.github.io/interpretable ml book/logistic.html
[17] L. Alice Auxilia,” Accuracy Prediction using Machine LearningTechniquesforIndianPatientLiverDisease”.
[18] Available:https://www.educative.io/edpresso/what is the f1 score
[19] Available:https://link.springer.com/referenceworkent ry/10.1007/978 1 4419 9863 7_209