International Research Journal of Engineering and Technology (IRJET) e ISSN: 2395 0056

Volume: 09 Issue: 06 | Jun 2022 www.irjet.net p ISSN: 2395 0072
International Research Journal of Engineering and Technology (IRJET) e ISSN: 2395 0056
Volume: 09 Issue: 06 | Jun 2022 www.irjet.net p ISSN: 2395 0072
1,2,4 Assistant Professor, Dept. of Mechanical Engineering, Chaitanya Bharathi Institute of Technology , Gadipet, hyd 3 Associate Professor, Dept. of Mechanical Engineering, Chaitanya Bharathi Institute of Technology , Gadipet, hyd ***
Abstract - We tried to observe the frequency changes and variations how it reacts using a modal analysis in ANSYS software. At different shapes or at different modes of cantilever beam we draw out the results of the frequencies and helps to further study its vibrations for future scope of work. The main future scope of work that can be build using these observations is converting mechanical vibrations on chassis of a body into electrical energy using piezo materials. It is also concluded in this report about what is the best suitable place for the piezo patch could be placed to get some productive and efficient outcome.
Key Words: Frequency,beam,Patch,Location,Timeperiod.
Duetoincreasinglyemployedfunctionallygradedmaterials in high tech industries, studying behavior of structural componentssuchasbeamsorplatesmadeofthatmaterial undervariousloadingsbecomesvitallyessential.Themost important achievements in modelling and analysis of the materialandstructureswerereportedinthesurveysgiven by Birman and Byrd [1] and Gupta and Talha [2]. Various problemsindynamicanalysisoffunctionallygradedbeams were studied in the widespreadliterature, forinstance, in theworks[3 7].Alargenumberofworksisdevotedalsoto studyvibrationsofthebeamswithlocalizeddamagessuch ascracks[8 13].Recently,someprocedureswereproposed by Yu and Chu [14]; Banerjee et al [15] and Khiem and Huyen [16] to detect cracks in functionally graded beams with natural frequencies measured by the traditional techniqueofmodal testing. Aswell known,thetraditional modal testing is restricted to use a limited number of discrete sensors and actuators that are usually unable to gathersufficientamountofdataforsolvingtheproblemof damagedetectioninstructuralhealthmonitoring.Therefore, using distributed sensors and actuators for modal testing would be surely promising to enhance solution of the damagedetectionproblem.
Presentstudydealswithlocationofpiezooncantilever beamwithrespectivetothefrequencyforfirst6modes.To studyfrequencyextractionANSYSworkbenchUsed.
Ansysisasimulationsoftwarewhichhelpsinproductdesign, testingandoperation.Soforthisprojectwewouldliketouse ansys for our observations. After simulating with the required conditions and inclined to the project basis we wouldliketodrawthepossibleresultsandobservations.To observethechangein frequenciesonacantileverbeamusing piezomaterialbyplacingitatdifferentpositionsonthebeam. Takingintoconsiderationsomeofthetechnicaladvantagesof piezo material we wanted to observe the frequency variations on a cantilever beam using this material. This studyonfrequencyvariations canbedoneusingtheANSYS softwarebysimulatingthedesiredform.Ansysdevelopsand marketsengineeringsimulationsoftwareforuseacrossthe product life cycle.Ansys Mechanicalfinite element analysissoftware is used to simulate computer models of structures,electronics,ormachinecomponentsforanalysing strength, toughness, elasticity, temperature distribution, electromagnetism,fluidflow,andotherattributes.Ansysis usedtodeterminehowaproductwillfunctionwithdifferent specifications,withoutbuildingtestproductsorconducting crashtests.Forexample,Ansyssoftwaremaysimulatehowa bridgewillholdupafteryearsoftraffic,howtobestprocess salmoninacannerytoreducewaste,orhowtodesignaslide thatuseslessmaterialwithoutsacrificingsafety.MostAnsys simulations are performed using the Ansys Workbench system, which is one of the company's main products.TypicallyAnsysusersbreakdownlargerstructures into small components that are each modelled and tested individually.Ausermaystartbydefiningthedimensionsof anobject,andthenaddingweight,pressure,temperatureand other physical properties. Finally, the Ansys software simulates and analyses movement, fatigue, fractures, fluid flow, temperature distribution, electromagnetic efficiency andothereffectsovertime.Ansysalsodevelopssoftwarefor data management and backup, academic research and teaching.Ansyssoftware issoldonanannual subscription basis.
Materials used
Beammaterial aluminium Patchmaterial piezo
International Research Journal of Engineering and Technology (IRJET) e ISSN: 2395 0056
Beammaterial aluminium SizeofAluminium(l*b*h) 250*25*2 Density 2770kg/m³ Young’smodulus 7.1E+10 Poisson’sratio 0.33

SizeofPiezopatch(l*b*h) 25*25*1 Density 4500kg/m³ Young’smodulus 2E+11pa Poisson’sratio 0.3
Table 1: Properties
Axis Young’s modulus Poisson’s ratio Shear modulus
X 7.8561e10 0.28798 3e10
Y 7.8561e10 0.45204 2.6e10 Z 6.2498e10 0.45204 2.6e10
Material selectionplayeda majorroleasprojectobjective wasobservingandanalysisofamaterialinansyssoftware anddrawingouttheresultstryingthemwithnewmaterial. Piezo materials were selected due to some of their interestingpropertieswhichhelpinconvertingmechanical energyintoelectricalenergy,sothisstudywouldhelpother experimentswhicharedoneusing piezomaterialsatsome pointwherefrequenciescomeintopicture.Cantileverbeam wasselectedtoobservefrequenciesonitatdifferentmodes ofthebeam,ascantileverbeamcanproducegoodvibrations thisstudycanhelpprojectsusingthisbeam.
ThemodelisdesignedusingSolidworkssoftwareandafter thatforthepurposeofsimulationithasbeenextractedinto ANSYSsoftware.Sobyusingansyswegetfinalresultsand observations where we draw possible conclusions and outcomes.
Themodelwhichisdesignedusingsolidworksisimported intoANSYSsoftwareforfurtherprocessing.Workbenchis used in ansys for the purpose of simulation of the model. Modal analysis is selected for the materials to study its frequenciesandtheirobservations.Afterselectingthemodal analsys we have to allocate the materials which are supposedtobeassignedforthedesiredmodeldesigned.All thetechnicalpropertiesaregiventotheparticularmaterials ofbeamandthepatchaccordingly.Inansyssoftwarethereis aprogrammealsowrittenintheprocessofsimulationtoget the desired results for the given technical values. All the observations are taken by placing the patch starting at 20mmto150mm onthecantilever
beam.Thefrequencychangeswereobservedforevery5mm inbetweenfromthestartingpointtotheendpoint.InANSYS wehaveobservedforsixdifferentmodes andsixdifferent frequencies.Afterthatcumulativevaluesareconsideredfor thestudyofthemodeltaken.Furtherprocessaftergetting thevalues agraphhasbeenplottedwhichisshowninthe resultssectionandtabularvaluesarealsoshowninresults section chapter 5. Conclusions are drawn out using the observedvaluesandthegraphicalrepresentation.
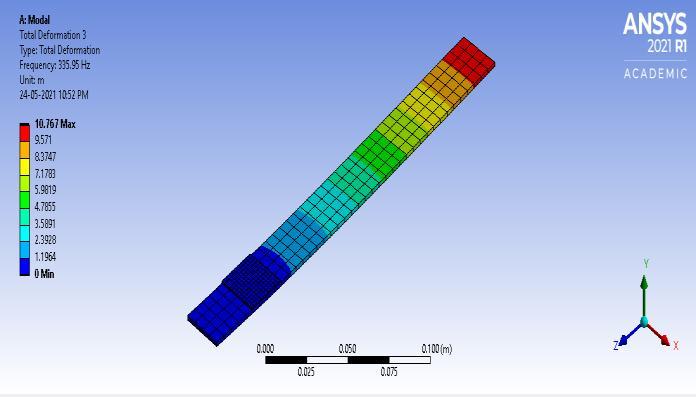
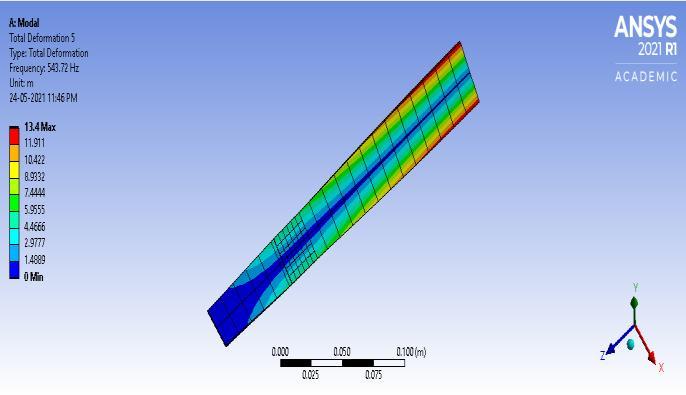
Figure 1.Cantileverbeammodel
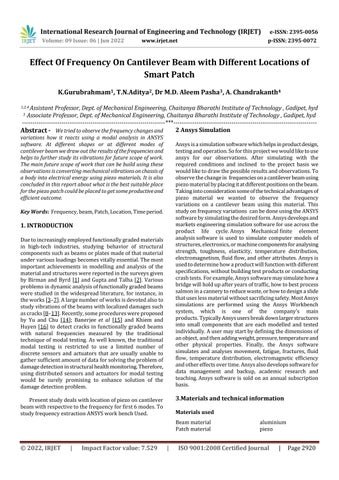
Figure 3. DeformationMode 5at65mm
Volume: 09 Issue: 06 | Jun 2022 www.irjet.net p ISSN: 2395 0072 © 2022, IRJET | Impact Factor value: 7.529 | ISO 9001:2008 Certified Journal | Page2921
International Research Journal of Engineering and Technology (IRJET) e ISSN: 2395 0056
Volume: 09 Issue: 06 | Jun 2022 www.irjet.net p ISSN: 2395 0072
Table 2: Mode1,2Results
Figure 4. DeformationMode 2at95mm
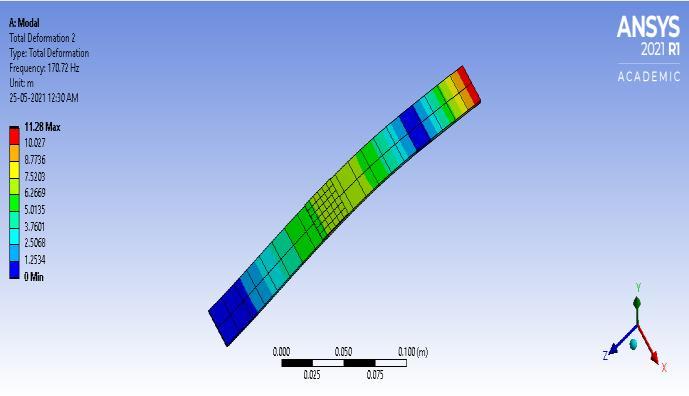
Figure 5. DeformationMode 1at125mm
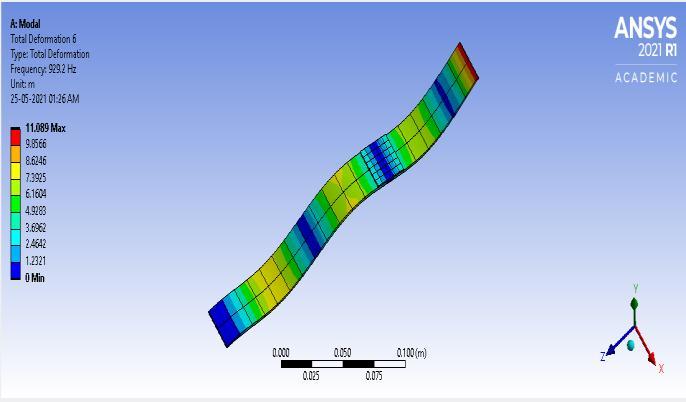
Figure 6. DeformationMode 6at150mm
Wehavediscussedtheprocessandmethodologyalongwith thestepbystepfollowedintheprocesstoobtaintheresults. Hereinchapter5wewilldiscussabouttheoutcomesofthe projectandtheobservationswhichareobtained.
Observationsaretakenatdistancefromfixedendofevery5 mmbypiezopatchonthealuminiumbeam.Rangingfrom (25mm 225mm)Frequenciesatthesedifferentpositionof piezoareobserved.Frequencyvaluesformode1andmode 2atvariouslocationsofpiezopatch.
MODE 1 MODE 2 DISTANC E(mm) FREQUENC Y(Hz) DISTANCE( mm) FREQUENC Y(Hz) 225 23.358 225 154.47 220 23.513 220 156.88 215 23.667 215 159.1 210 23.819 210 161.13 205 23.967 205 162.92 200 24.114 200 164.54 195 24.259 195 166.05 190 24.402 190 167.36 185 24.543 185 168.49 180 24.681 180 169.3 175 24.817 175 170.03 170 24.954 170 170.86 165 25.089 165 171.53 160 25.222 160 171.98 155 25.35 155 171.95 150 25.633 150 173.55 145 25.799 145 176.18 140 25.916 140 174.86 135 26.047 135 174.64 130 26.211 130 176.02 125 26.293 125 172.6 120 26.508 120 175.26 115 26.608 115 172.91 110 26.745 110 172.21 105 26.954 105 172.97 100 26.985 100 169.13 95 27.297 95 170.72 90 27.373 90 168.38 85 27.528 85 167.58 80 27.82 80 167.59 75 27.769 75 165.01 70 28.244 70 165.46 65 28.283 65 164.25 60 28.47 60 163.99 55 28.897 55 164.09
International Research Journal of Engineering and Technology (IRJET) e ISSN: 2395 0056
50 28.715 50 163.62 45 29.444 45 164.46 40 29.444 40 164.46 35 29.249 35 164.81 30 29.388 30 166.31 25 29.554 25 168.41 20 29.888 20 171.5
Frequency values for mode 3 and mode 4 at various locationsofpiezopatch.
Table 2: Mode3,4Results
MODE 3 MODE 4 DISTANC E(mm) FREQUENCY( Hz) DISTANCE( mm) FREQUENCY( Hz)
225 287.46 225 445.18 220 289.34 220 453.46 215 291.2 215 460.68 210 293.02 210 466.19 205 294.82 205 467.16 200 296.59 200 468.25 195 298.32 195 469.57 190 300.02 190 470.92 185 301.69 185 472.39 180 303.31 180 473.95 175 304.9 175 475.58 170 306.46 170 477.56 165 307.98 165 479.47 160 309.46 160 481.52 155 310.88 155 483.64 150 313.06 150 490.89 145 314.5 145 493.86 140 315.8 140 486.75 135 317.06 135 483.32 130 318.36 130 481.34 125 319.44 125 473.97 120 320.77 120 473.93 115 321.84 115 471.21 110 322.9 110 470.62 105 324.08 105 472.1
100 324.84 100 470.95 95 326.16 95 476.16 90 327.01 90 476.38 85 327.91 85 477.5 80 329.04 80 482.5 75 329.46 75 477.43 70 330.92 70 484.58 65 331.59 65 479.83 60 332.38 60 478.13 55 333.59 55 478.84 50 333.66 50 469.37 45 335.43 45 470.62 40 335.43 40 470.62 35 335.3 35 456.86 30 335.95 30 455.56 25 336.52 25 455.69 20 337.73 20 459.1
Frequency values for mode 5 and mode 6 at various locationsofpiezopatch.
Table -3: Mode5,6Results
MODE 5 MODE 6 DISTANCE( mm) FREQUENC Y(Hz) DISTANCE(m m) FREQUENCY( Hz)
225 463.87 225 889.76 220 464.56 220 907.91 215 465.31 215 923.23 210 466.98 210 936.76 205 471.88 205 946.1 200 476.36 200 955.36 195 481.09 195 965.58 190 485.07 190 973.11 185 488.35 185 975.48 180 489.56 180 970.46 175 490.5 175 960.38 170 492.63 170 950.68 165 493.81 165 941.07 160 492.74 160 929.06 155 489.42 155 920.01
Volume: 09 Issue: 06 | Jun 2022 www.irjet.net p ISSN: 2395 0072 © 2022, IRJET | Impact Factor value: 7.529 | ISO 9001:2008 Certified Journal |
International Research Journal of Engineering and Technology (IRJET) e ISSN: 2395 0056
150 491.89 150 929.2 145 495.43 145 937.13 140 496.6 140 938.4 135 498.7 135 944.06 130 502.08 130 960.15 125 504.19 125 959.15 120 507.94 120 980.91 115 511.18 115 977.45 110 513.94 110 977.03 105 517.53 105 978.99 100 519.65 100 956.99 95 524.06 95 957.4 90 527.54 90 942.26 85 530.43 85 936.8 80 534.15 80 935.76 75 535.85 75 927.95 70 540.54 70 938.68 65 543.72 65 941.04 60 546.27 60 945.39 55 549.48 55 958.45 50 550.15 50 951.14 45 554.4 45 962.53 40 554.4 40 962.53 35 549.67 35 924.84 30 551.03 30 915.47 25 551.13 25 905.16 20 552.09 20 899.26
This result shows that we can utilize piezo materials to generate energy. By using this data, we can generate maximumenergybyusingminimalmaterialbyplacingitat thehighestfrequencypoint.Theseobservationsshowthat thereisashortchangeinfrequencywhichprovesthatthere arevibrations.So, whentherearevibrationsthere will be scope of electricity generation with the usage of piezo material. When it comes to graphical analysis it can be observed that at mode 1 the highest frequency generated wasattheinitialstateandlowestfrequencywasobservedat theedgeofthebeamalmostattheend.Observingatmode2 the frequency variations were like increased rapidly in betweenofthebeamaround145mm,aswellandthelowest frequency was seen at the end of the beam. There were
similarresultsofmode3asoflikemode1thereisagradual decreaseinthegraphandthefrequencies whilethepiezo patchwasplacedfromtoptobottomofthebeamatvarious positions. So same can be concluded that the highest frequency generated was at the initial state and lowest frequencywasobservedattheedgeofthebeamalmostat theend.
[1] BirmanVandByrdLM2007Modelingandanalysisof functionallygradedmaterialsandstructuresAppl.Mech. Rev. 60 195 216
[2] Gupta A and Talha M 2015 Recent development in modelingandanalysisoffunctionallygradedmaterials andstructuresProg.Aerosp.Sci. 79 1 14
[3] ChakrabortyAandGopalakrishnanS2003Aspectrally formulatedfiniteelementforwavepropagationanalysis in functionally graded beams Intern. J. of Solids and Struct. 40 2421 48
[4] LiXF2008Aunifiedapproachforanalyzingstaticand dynamicbehaviorsoffunctionallygradedTimoshenko andEuler BernoullibeamsJ.SoundVib. 318 1210 29
[5] Sina S A, Navazi H M and Haddadpour H 2009 An analytical method for free vibration analysis of functionallygradedbeamsMaterial&Design 30 741 7
[6] Su H and Banerjee J R 2015 Development of dynamic stiffnessmethodforfreevibrationoffunctionallygraded TimoshenkobeamComputers&Structures 147 107 16
[7] Sari M, Shaat M and Abdelkefi A 2017 Frequency and modeveeringphenomenaofaxiallyfunctionallygraded non uniform beams with nonlocal residuals Compos. Struct. 163 280 92
[8] Yang J and Chen Y 2008 Free vibration and buckling analysesoffunctionallygradedbeamswithedgecracks CompositeStructure 83 48 60
[9] AkbasSD2013 Freevibrationcharacteristics of edge cracked functionally graded beams by using finite element method International Journal of Engineering TrendsandTechnology 4 4590 7
[10] Aydin K 2013 Free vibration of functionally graded beams with arbitrary number of surface cracks EuropeanJournalofMechanicsA/Solid 42 112 24
[11] KhiemNT,HuyenNNandLongNT2017Vibrationof crackedTimoshenkobeammadeoffunctionallygraded material Conference Proceedings of the Society for Experimental Mechanics Series Shock & Vibration, Aircraft/Aerospace, Energy Harvesting, Acoustics &
Volume: 09 Issue: 06 | Jun 2022 www.irjet.net p ISSN: 2395 0072 © 2022, IRJET | Impact Factor value: 7.529 | ISO 9001:2008 Certified Journal | Page2924
International Research Journal of Engineering and Technology (IRJET) e ISSN: 2395 0056
OpticsedJHarvieandJBaqersad(Springer,Cham) 9 pp 133 43
[12] LienTV,DucNTandKhiemNT2017Freeandforced vibration analysis of multiple cracked FGM multispan continuousbeamsusingthedynamicstiffnessmethod. Latin American Journal of Solids and Structures 14 1752 66
[13] LienTV,DucN TandKhiemNT2019Freevibration analysis of multiple cracked functionally graded TimoshenkobeamsLatinAmericanJournalofSolidsand Structures 16 e157
[14] Yu Z G and Chu F L 2009 Identification of crack in functionallygradedmaterialbeamsusingthep version offiniteelementmethodJ.SoundVib. 325 69 84
[15] Banerjee A, Panigrahi B and Pohit G 2016 Crack modelling and detection in Timoshenko FGM beam undertransversevibrationusingfrequencycontourand responsesurfacemodelwithGANondestruct.Test.Eval. 31
[16] Khiem N T and Huyen N N 2017 A method for crack identificationinfunctionallygradedTimoshenkobeam Nondestruct.Test.Eval. 32 319 41
Volume: 09 Issue: 06 | Jun 2022 www.irjet.net p ISSN: 2395 0072 © 2022, IRJET | Impact Factor value: 7.529 | ISO 9001:2008 Certified Journal