International Research Journal of Engineering and Technology (IRJET) e ISSN: 2395 0056

Volume: 09 Issue: 06 | Jun 2022 www.irjet.net p ISSN: 2395 0072
International Research Journal of Engineering and Technology (IRJET) e ISSN: 2395 0056
Volume: 09 Issue: 06 | Jun 2022 www.irjet.net p ISSN: 2395 0072
Assistant Professor, department of Civil Engineering, Mookambigai college of Engineering Pudukkottai, Tamilnadu, India.
B.E, department of Civil Engineering, Mookambigai college of Engineering Pudukkottai, Tamilnadu, India.
B.E, department of Civil Engineering, Mookambigai college of Engineering Pudukkottai, Tamilnadu, India.
B.E, department of Civil Engineering, Mookambigai college of Engineering Pudukkottai, Tamilnadu, India.
B.E, department of Civil Engineering, Mookambigai college of Engineering Pudukkottai, Tamilnadu, India. ***
Abstract Groundwater is major in satisfying domestic, drinking and agricultural needs. Besides insufficiency, the groundwater resource is degrading drastically around the world. The Ambuliyar watershed falling in parts of Tamil Nadu also faces similar problems. To interpret the quality degradation, pre monsoon data on various physical and chemical parameters was collected for 17 wells for the year 2022 from Public Works Department. Spatial distribution maps were generated on the above geochemical parameters and categorized into five classes using GIS software. Low, medium and high values were assigned for each parameter based on WHO (2011), BIS (2014) andISI (1983)theirrelative importance in with each other parameters. During the pre monsoon period, no pollution sample occurred based on the pH, HCO3 , SO4 and Cl , most of the sample falls in the pollution category based on the K and F and remainingparameteters falls in the good category for drinkingandirrigationpurposes.
Key Words: Groundwater quality, Ambuliyar watershed, GIS, Pre Monsoon.
Water is referred to an universal solvent, since among all the importance needs ofhuman beings and animalsanduniversityknownasair,water,food,shelter, etc.,waterplaysaveryimportantroleanditisthehighest role because it is essential to sustain life since the protoplasm of many living cells contains 30% of water andanysubstantialreductionwillcausedisaster.Wateris required for satisfactory performance of physiological organisms, as the circulatory fluid, as a carrier of nourishingfoodandfortheremovalofproductsofwater. It is noted and found that two third of the human body consists of water. Water is used by man for variety of purpose such as drinking, domestic and irrigation
purposes etc. When compared to all other minerals availableonEarth,thegroundwaterservestobeprecious disturbed resources of the earth. The world total water resourceisestimated.Atpresentnearlyonefifthofallthe waterisobtainedfromgroundwater, nearly80%ofthe consumption of water is used for agricultural purpose. Notonlyforagriculture,whenconsideringtheallanimals, fisheries,needabundantquantityofwater.About40%of groundwaterisusedforirrigationpurposes.
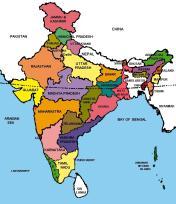
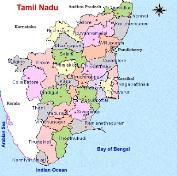
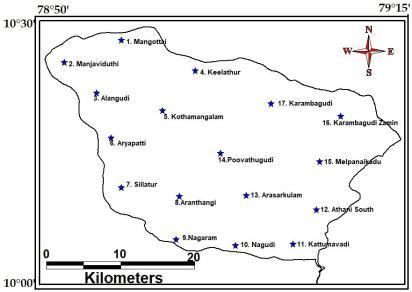
Thepresentstudyarea,Ambuliarwatershedisoneof the small districts of Tamil Nadu with an area of 424.3 sq.Kms.Thedistrictliesbetween79º00’to79º15’ofthe easternlongitudeand10º00’to10º30’ofthenorthern latitude. The study area is bounded by the districts of Tiruchirappaliinthenorth.Thanjavurinthenorth east. BayofBengalintheeast.TheminorriverofAmbullaris followfromwesttoeastdirection.
Fig -1: Thestudyareamap.
International Research Journal of Engineering and Technology (IRJET) e ISSN: 2395 0056
Volume: 09 Issue: 06 | Jun 2022 www.irjet.net p ISSN: 2395 0072
The success of any scientific investigation largely dependsonthenatureofmaterialsandmethodsemployed forthepurpose.Inageochemicalstudyinvolvingvarious physic chemical principles, a preliminary field survey priortocollectionofsamplesisrequired especiallywith regard to the topography as well as the regional setup withinthestudyarea.Thischapterdealswiththemethod ofsamplecollection,preservationofthesamples and the principles and experimental methods are involved in this study.
Field survey was carried out during the investigation to understand the quality of groundwater along the study area. Prior to collection of samples, toposheetsandhydrographicchartswereusedtoprepare a base map indicating the sampling stations. After scrutinizingtheavailableliterature,additionalinformation neededforthepresentstudywerecollectedtostandardize themethodologyandtofulfilltheobjectives.Thelocations of the sampling stations were fixed using Global PositioningSystem(GPS Map2000).
The water samples have been collected from 17 representativelocationsatAmbuliarwatershedPudukottai district,distributedoverthestudyareduringthe month of February2021frombothborewellsanddugwells.Method of collection and analysis of groundwater samples were basically the same as given by Brown et al. (1974). The sampleswerecollectedin250and100mlcapacitypolythene bottles. Prior to collection, both bottles were thoroughly washed with distilled water and then the 100ml bottle is rinsedwithdilutedHNO3acid,withinthelaboratorybefore fillingthebottlewiththesample.Inthefieldthepolythene bottleswererinsedwiththerespectivewatersamplesbefore fillingandlabeledaccordingly.Thelatitudeand longitude of the respectivesamplesweremeasuredby using Garmin E Trex 12 channel GPS and some otherdetailswerenoted inthenotepad).
Colour of ground water is indicated by its chemistry andthepresenceofimpurities.Mostundergroundwaters are colorless. Hard waters are bluish, ferrous salts and hydrogen sulphide colour, the water in greenish, blue, organiccompounds make it yellowish, while suspended mineralparticlesmakeitgrayish.
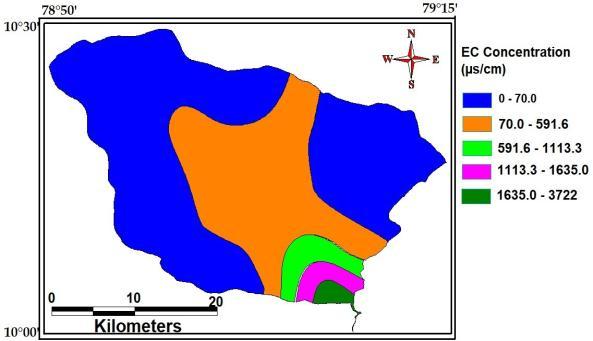
Sincethewateriselectrolytesolutiontherewillbe Electric conductivity. Electric conductivity is directly proportional to the amount of dissolve salts. The dissolved water does not conduct electric current. Sensitivitiesof underground water rangebetween610to 2500(µs/cm).Radioactivityofgroundwateristheresult of thepresenceofuranium, radium.Themaximum, minimum andaverage concentration ofElectricalconductivity of the studyAreaare3722(µs/cm),70(µs/cm)and695(µs/cm).
Groundwater usually have no odour but sometimes it is detectable for example the hydrogen sulphide imparts the small of rotten eggs to the water stagnant water in somewood caused well often has an objectionable musty odour. Shallow ground water will have“marsh”odourisoftenrelatedtothebacterialdecay oforganicallymatter.
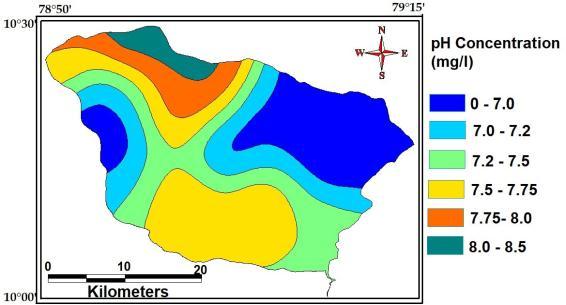
Thevalueisameasureofhydrogenionspresentinwater. ThepHvalueforground watervaries withina widerange from 1.8 to 11.0. However the most common pHvalues forgroundwaterthosebetween5to8.Accordingtoworld drinkingwaterstandards,pHvalueshouldbebetween6.6 to 7.22. The maximum, minimum andaverageconcentration ofpHofthestudyAreais8.5,7.0and7.0
International Research Journal of Engineering and Technology (IRJET) e ISSN: 2395 0056
Volume: 09 Issue: 06 | Jun 2022 www.irjet.net p ISSN: 2395 0072
Thesalinityshouldneverexceed1000mg/lit.Thetotal salinityofwaterfrom10mg/litto600mg/lit.
Whencomparetosurfacewatertemperaturethetest for temperature of the ground water remain constant throughouttheyear.Theannualvariationingroundwater temperatureisthelargestfortablesnearthegroundsurface and decreased with thedepthofgroundwatersurfacesand decreaseswiththedepthof ground water, beingabout1°c atdepthof10to20meters.Thetemperatureof7°cto11°c makes drinking water the most tasty and refreshing. Temperatureofabout35°cto37°c.
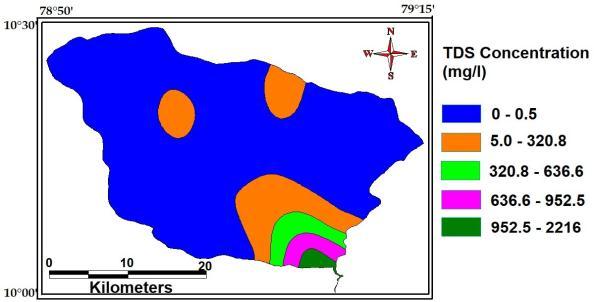
TotalDissolvedSolidsisameasureofthecombined contentofallinorganicandorganicsubstancespresentina liquid in molecular, ionized or micro granular (colloidal sol) suspended form. The maximum, minimum and average concentration of Total Dissolved Solids of the studyAreaare2216Mg/L,0.5Mg/Land328Mg/L
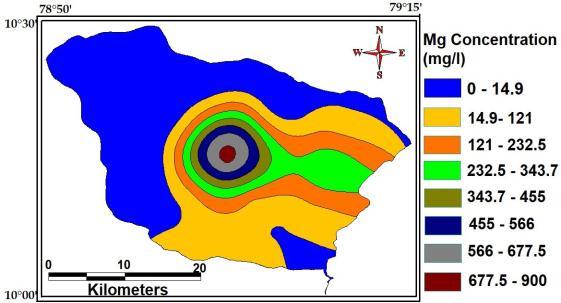
Magnesiumisarelativelyabundantelementinthe earth’scrustandhenceacommonconstituentofnatural water. Waters associated with granite or siliceous sand maycontainlessthan5mgofmagnesiumperlitre.Water in contact with dolomite or magnesium rich limestone may contain 10 50 mg l 1 and several hundred milligramsperlitremaybepresentinwaterthathasbeenin contactwithdepositscontainingsulphatesandchloridesof magnesium. The maximum, minimum and average concentrationofMagnesiumofthestudyAreaare900Mg/L, 14.9Mg/Land200Mg/L
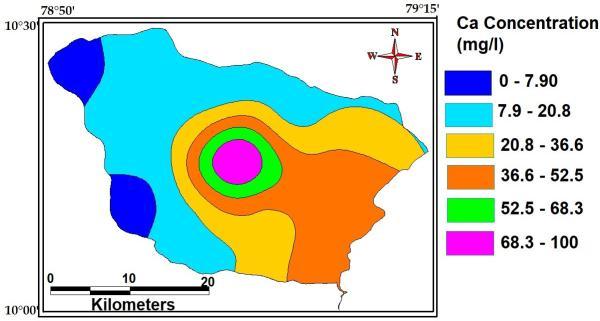
Calcium dissolves out of almost all rocks and is, consequently,detectedinmanywaters.Watersassociated withgraniteorsiliceoussandwillusuallycontainlessthan 10 mg ofcalcium per litre. Many waters from limestone areas may contain 30 100 mg l 1 and those associated with gypsiferous shale may contain several hundred milligramsperlitre.Themaximum,minimumandaverage concentrationofCalciumofthestudyAreaare100Mg/L, 7.9Mg/Land42Mg/L
Sodiumionsareabundantingroundwaterespeciallyin thosecontainsindeepaquifersystemofallthecationsthese are the most abundant one. The maximum, minimum and averageconcentrationofSodiumofthestudy Area are 470 Mg/L, 0.9 Mg/L and 76Mg/L
International Research Journal of Engineering and Technology (IRJET) e ISSN: 2395 0056
Volume: 09 Issue: 06 | Jun 2022 www.irjet.net p ISSN: 2395 0072
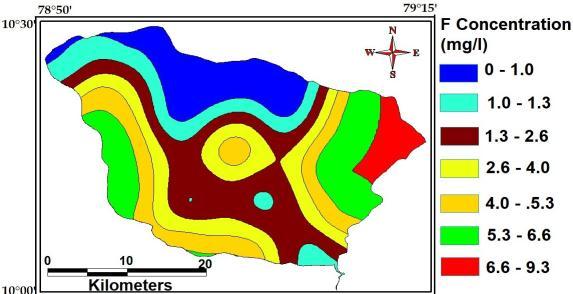
4.2.7 Fluoride
The maximum, minimumandaverage concentration of the studyAreaare9.3Mg/L,1.0Mg/L and184Mg/L.
Potassium ions are very abundantly found .it is much more than sodium ions. it is produced by weathering of igneous rocks as well as by the dissolution of potash salt deposits. The maximum, minimum and average concentration of Potassium of thestudyAreaare1427Mg/L,1.2Mg/Land0.5Mg/L
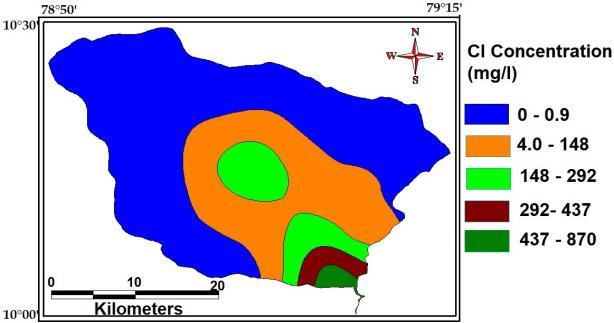
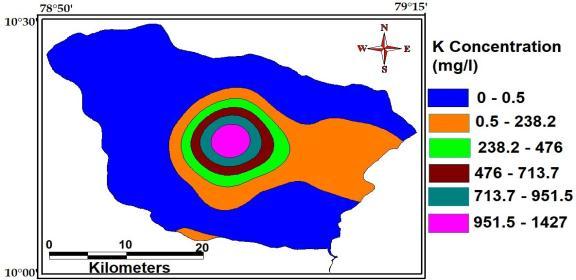
Fig- Fluoride of study area.
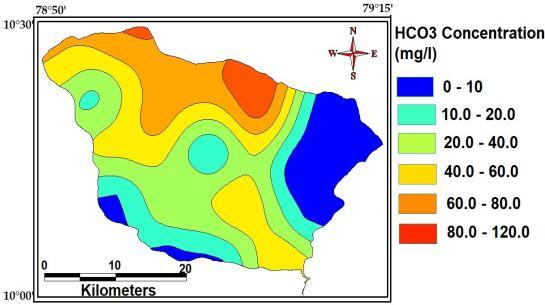
The maximum, minimum and average concentrationofBi CarbonateofthestudyAreaare120 Mg/L,10Mg/Land56Mg/L
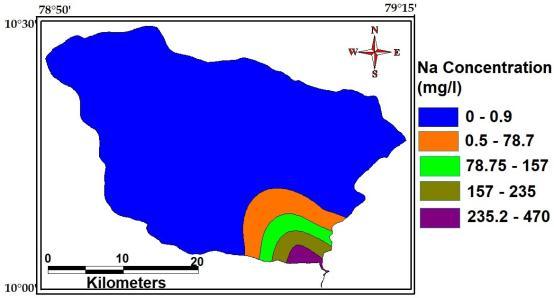
Fig Potassium of study area
Chloride anions are usually present in natural watersAsaltytasteinwaterdependsontheionswith whichthechloridesareassociated.Withsodiumionsthe taste is detectable at about 250 mg l 1 Cl, but with calciumormagnesiumthetastemaybeundetectableat 1,000 mg l. The maximum, minimum and average concentration of Chloride of the study Area are 870 Mg/L,0.9Mg
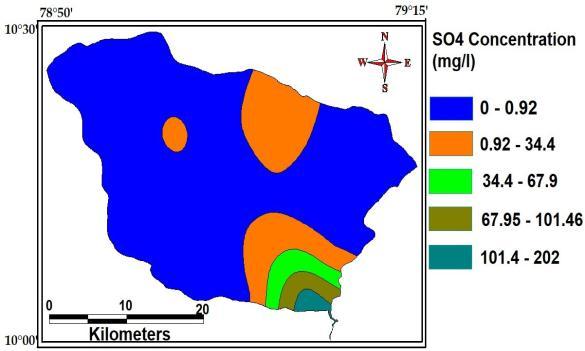
Sulphateiscommonlyfoundinair,soilandwater. Since it is soluble (easily dissolved)in water, Sulphate is foundat high concentration in many acquifers and inthe surface water. The maximum, minimum and average concentration of Sulphate ofthestudyAreaare202Mg/L, 0.92Mg/L and34.6g/L
Fig- chloride of the study area.
Fig sulphate of study area.
International Research Journal of Engineering and Technology (IRJET) e ISSN: 2395 0056
Volume: 09 Issue: 06 | Jun 2022 www.irjet.net p ISSN: 2395 0072
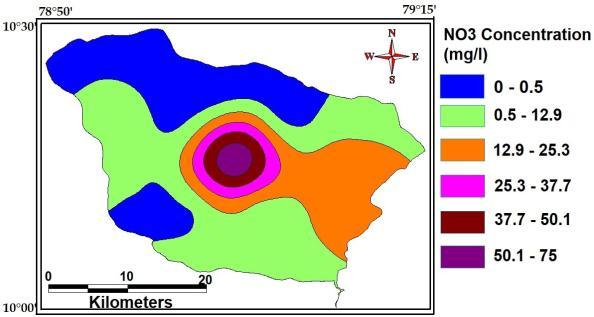
Nitrate the most highly oxidized form of nitrogen compounds,iscommonlypresentinsurfaceandground waters, because it is the end product of the aerobic decomposition of organic nitrogenous matter. Significant sources of nitrate are chemical fertilizers from cultivated land and drainage from livestock feedlots, as well as domestic and some industrial waters. The maximum, minimumandaverageconcentrationofNitrateofthestudy Areaare75Mg/L,0.5Mg/Land23Mg/L.
Following standards for quality of drinking water supplyarelaiddown.Theseareprimarily basedeitheron U.S.Publichealthservice standard or recommendation of indianstandardorganizationandarebeingfollowedinour countrywithoutmachvariations
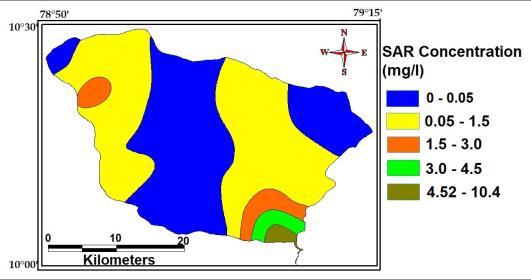
ThevalueofSAR ofthestudyareavariesfrom0.01 to08.98withanaverageof1.85.Thebelowtableindicates 94.12%ofgroundwatersamplesinthestudyareabelongto no problem categories, 5.88% of samples fall under increasingproblemcategoriesareshowninthefig
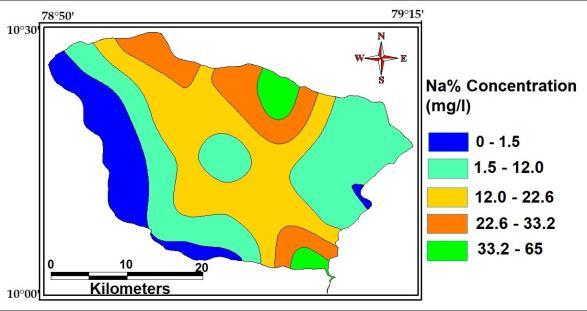
The value of sodium percentage of the study area variesfrom9.63to64.4withanaverageof38.Thesodium percentage values are shown in fig. The sodium percentage in the groundwater samples were plotted againsttheECvaluesandpresentedoveraWilcoxplot for decipheringthegroundwatersuitability forirrigation. It reveals that 11.8% of groundwater samples fall under excellent categoriesfor irrigation, 64.7% ofthesamples fallsundergoodcategoriesforirrigationand rests of the samples are mostly permissible for irrigation.
range Classification No of samples % of samples <20 Excellent 02 118
The Physical and Chemical properties of underground water will vary with time, due to factors like climate, geologic,hydrologic,ecologicandbiogeneticfactors.Italso varyduetoartificialfactorssuchasirrigation,reservoir etc.,toascertaintheabovephenomenon,inourprojectwe
International Research Journal of Engineering and Technology (IRJET) e ISSN: 2395 0056
Volume: 09 Issue: 06 | Jun 2022 www.irjet.net p ISSN: 2395 0072
analyzetheundergroundwaterofborewellssituated in Ambuliarsubwatershed.Theresultsobtainedinthistest showsslightvariationinphysicalandchemicalproperties whencomparedtoIndianStandardsandWHOstandards. The variation is mainly due to the low intensities of rainfall. Rainfall is the dominating factor in considering physical and chemical properties of water. Precipitation reactionsareemployedinthesofteningof hard water i.e. precipitationtendstodecreasethehardness.Since,ithas the property of leaching. Precipitation dilutes the existing groundwater thereby reducing concentration of mineral constituents.Salinityoftheundergroundwaterdependson the intensity of rainfall. Sothe low intensity of rainfall prevailed in the in one reason for the variation of physicaland chemical properties. These studies concluded thatthephysicaland chemicalproperties of underground water are not constant and vary with time to time and alsoyearbyyearduetofactormentionedabove.Andalsowe compared the present result with the previous result obtained during the last year. From our project, we concludethatthephysicalandchemicalpropertiesofground water are not constant and varywithtime totime. The samples areAryapatti, Sillatur, Nagaram, Nagudi, Athani south,Poovadhugudi,Melpanaikadu,KarambagudiZamin andKattumavadiareunfitfordrinkingpurposebecause theyhavehigherTDS,Fluoride,SodiumandPottasiumare mostvulnerableconstituenthigherthantheISandWHO 2011permissiblelimits.
1. BIS (2003) Indian Standard Drinking Water SpecificationsIS10500:1991,Edition2.2(2003 2009).BureauofIndianStandards,NewDelhi.
2. Bureau of Indian Standards (2014). Drinking waterandpackagedwaterSpecifications.Second Revision,Vol.IS14543:2014,Doc.No.Fad14New Delhi.
3. CGWB(1992).Reportofthe WorkingGroupof Estimation of groundwater resource and irrigationpotentialfromgroundwaterinTamil Nadu.MinistryofWaterResource,Govt.ofIndia, India.
4. De Zuane J. 1997 HandbookofDrinkingWater Quality,2nded..VanNostrand,Reinheld.
5. K. Srinivasamoorthy, S. Chidambaram, M. Vasanthavigar(2012)Geochemistryoffluorides ingroundwater,SalemDistrict,TamilnaduIndia J.Env.Hydrol.,1,pp.16 25
6. Ramesh and Elango 2012Groundwaterquality anditssuitabilityfordomesticandagricultural use in Tondiar river basin, Tamil Nadu, India, Environmental Monitoring and Assessment
184(6):3887 99 · August 2011 with610 Reads DOI:10.1007/s10661 011 2231 3·
7. SR de Cordoba (2010), E Goicoechea de JorgeTranslational mini review series on complement factor H: genetics and disease associations of human complement factor H ClinExpImmunol,151pp.1 13.
8. Solsona f.,2002,GuidelinesForDrinkingWater QualityStandardsInDevelopingCountries,Pan American Health Organization Pan American Sanitary Bureau, Regional Office Of The World HealthOrganizationLima
9. WHO (2008), Guidelines For Drinking Water Quality Third Edition Incorporating The First And Second Addenda, Volume 1, RecommendationsGeneva.
10. WHO(2011).Guidelinefordrinkingwaterquality. 1.Geneva,515Recommendations.
11. WHO (1996), Guidelines For Drinking Water Quality Third Edition Incorporating The First And Second Addenda, Volume 1, RecommendationsGeneva.
2022, IRJET | Impact Factor value: 7.529 | ISO 9001:2008 Certified