International Research Journal of Engineering and Technology (IRJET) e ISSN:2395 0056

Volume: 09 Issue: 06 | June 2022 www.irjet.net p ISSN:2395 0072
International Research Journal of Engineering and Technology (IRJET) e ISSN:2395 0056
Volume: 09 Issue: 06 | June 2022 www.irjet.net p ISSN:2395 0072
Swaroopa H P 1, Mohammed Fiquar 2, Laxmi V3
1Dept. ISE, BNMIT
2Dept. ISE, BNMIT
3Asst. Professor, Dept. ISE, BNMIT ***
Abstract One of the most complicated systems that is nearly hard to represent using dynamical equations is the stock market. The primary reason is that a number of ambiguous factors, such as the state of the economy, a company's policies, and investor demand and supply, and so on, affect stock prices. There has been a lot of research in predicting the behavior of stocks based on their historical performance using Artificial Intelligence and Machine Learning techniques like Artificial Neural Networks, Fuzzy logic and Support Vector Regression. These models have predicted the prices with less accuracy. Hidden Markov Models are one technique for stock market analysis that is less popular than the approaches previously described. This study looks for a hidden link between matching stock prices and the Hidden Markov Model, unlike the stock forecasts that are previously accessible. Therefore, in this study, the concentration is on Hidden Markov Models and evaluate their effectiveness in comparison to Support Vector Regression Models. The experimental findings show that this technique may deliver surprisingly accurate results, especially for short term forecasts, where the reached accuracy is > 80%.
Key Words: HiddenMarkovModelFor identifying patterns in random processes, Hidden Markov Models provide a robust probabilistic foundation. They have been and are currently widely used for identifying patterns in speech, handwriting, and gestures. AwiderangeofDNAsequencesweresuccessfullyanalysed by HMMs in the future. HMMs' core tenet is that the likelihoodofan observation dependsonthesystemstates that are 'hidden' from the observer. The name Hidden Markov Models comes from the fact that the change from onestatetoanotherisaMarkovProcess,meaningthatthe next state depends solely on the current one. States whereas the observations may be either discrete, continuous, or both, in HMMs are always discrete. The stock market may be thought of as a Hidden Markov Process, where the investor can only see the stock values
anddoesnotknow whatunderlyingstatesareinfluencing those prices. For the purpose of creating a prototype, consideringtheclosepricefortheTATAMOTORSstock.In this project, its assumed that the distribution of the observationsismultivariateGaussian.
HMMs have been used in the past to make stock market forecasts. By looking for a similar trend in the historical data, Hassan and Nath [1] employed fixed state HMMs to predict several airline stocks. In order to measure the performance of the model with regard to the number of hiddenstates,NguyetNguyen[2]expandedontheworkof HassanandNathbyusingtheAkaikeInformationCriterion (AIC) and Bayesian Information Criterion (BIC). To increase the possibility of observing all likely sequences, AdityaandBhuwan[3]employedafixedstateHMM based MAPestimator.
AHMM Fuzzylogicmodelandanartificialneuralnetwork were used to compare their findings. Utilizing Support VectorRegression(SVR),whichwasdevelopedbyCaoand Francis [7], is an additional strategy. In order to compare the performance of the HMM model to that of Nguyet Nguyen's SVR model, an HMM model is developed comparabletohis.
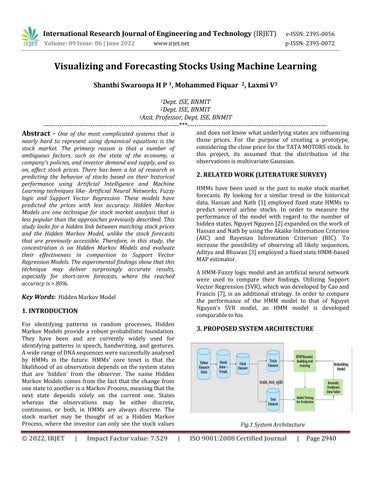
Fig.1 SystemArchitecture
International Research Journal of Engineering and Technology (IRJET) e ISSN:2395 0056
Volume: 09 Issue: 06 | June 2022 www.irjet.net p ISSN:2395 0072
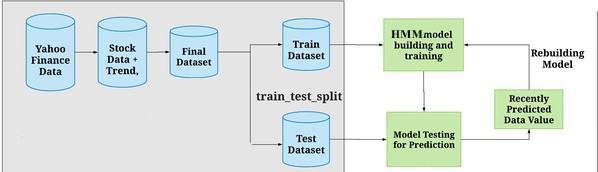
3.1 A media entity that is a component of the Yahoo! networkisYahoo!Finance.Inadditiontostockquotations, news articles, financial reports, and unique material, it offers financial news, data, and opinion. Additionally, it provides a few online tools for managing personal finances. It publishes unique material written by its own writersinadditiontopartnercontentfromotherwebsites. On a list of the biggest news and media websites, it is placed 21st by SimilarWeb. Table 1 shows the dataset obtainedfromyfinance.
Observations may be modelled as Multivariate Gaussian distributed since the vector "Ot" accepts real values. Although the components of an observation may be connected, the observations are presumed to be independent.SinceHMMisafinitestatemachine,thestate Stcanonlyacceptdiscretevalues.Let'sdefineafewterms usedtodescribehiddenmarkovmodelspresently.
Numberofobservations,��Latency, �� Number of States, �� (���� = ��1, ��2, … . , ����) Observation Sequence, ��InitialStateProbability, ��0StateTransitionMatrix, �� =[������]where������isthestate transitionprobabilityfrom����to .
ObservationProbabilities,����=1,2,..��,where ,��arethe mean and covariance matrix for Gaussian distribution for state��
AgenerativeprobabilisticmodelcalledtheHiddenMarkov Model (HMM) assumes that the system is transitioning between a predetermined number of states. A matrix of state transition probabilities may be used to define the state transition since it is a Markov Process. Although the state sequence cannot be seen in its entirety, some of the statedynamicsmaybeseen.
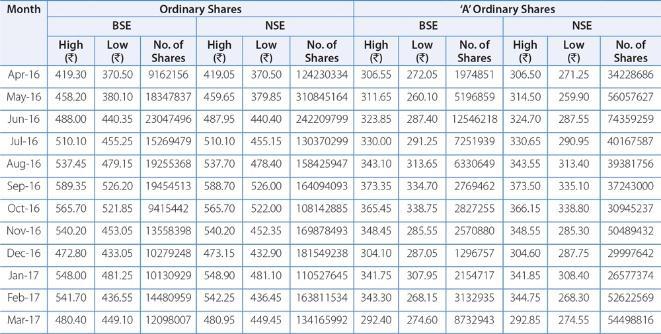
The observations in stock markets are continuous in nature and they are part of non stationary systems. AssumethatStrepresent’sthestateondaytandthat Ot is avectorwithfourelements:thedailyclose,open,high,and low. One of the presumptive states is the state of St. A typicalHiddenMarkovProcessisseeninFigure2.
TheHiddenMarkovModelcanberepresentedas��=(��,��, Σ,��0) eq 1
The following inquiry must now be addressed: How the Hidden Markov Model be employed? This is resolved. by answeringthethreequestionsthatfollow.
How probable is it to witness the provided sequenceofdata,giventhemodel?
What is the ideal hidden state sequence given the modelandobservations?
What are the ideal model parameters, given the observations?
Utilizing the Forward method to solve the first issue. The Viterbi algorithm can resolve the second issue. Baum Welchmethodisusedtoresolvethethirdissue.
The key to forecasting the stock price for the following day is to compute the log likelihood of K prior observations and compare it to the log likelihood of all prior subsequences of the same size by moving the window by one day in the direction of the prior data. The next step is to choose a day in the past whose log likelihoodofitsKpriorobservationsismostsimilartothe subsequence whose price is to be forecasted for the followingday.
International Research Journal of Engineering and Technology (IRJET) e ISSN:2395 0056
Volume: 09 Issue: 06 | June 2022 www.irjet.net p ISSN:2395 0072
�� = �������������� (|��(���� ,���� 1,���� 2, … ,���� �� | ��) − ��(���� �� ,���� �� 1,���� �� 2,…,���� �� ��|��)|) eq 2
��ℎ������,��=1,2,…,��/K.
The difference in price between the indicated day and the following day is then calculated. The price for the current day is then adjusted for this change to obtain the forecast forthefollowingday.
����+1=����+(���� ��+1−���� ��) eq 3
Then, once the correct observation is obtained it will includeitintothedatasetandmakenecessaryadjustments to the model's parameters to prevent divergence. Simply put, fixing of the size of the subsequence and look for a different subsequence from earlier data that has a like pattern.Thebehaviourofthedetectedsubsequenceisthen mappedtothesubsequencebeingpredicted.
Training a collection of models by altering the number of states (N) from the state space G in order to choose the model with the ideal number of states. Consideration of the values of the number of states in G between [2, 25]. Afterward, determined the negative log likelihood of the training data used for each model, and selected the model withthelowestvalue.
However, this method favors complicated models, which suggeststhatthenumberofstatespickedmaylikelyto be greater and may lead to overfitting. To get around this problem, Altration the negative log likelihood with a penalty term. Depending on the chosen penalty period, impose various levels of limits on the model and have looked into two different performance assessment metrics: the Akaike Information Criterion (AIC) and the BayesianInformationCriterion(BIC).ForaBICmodel,the number of model parameters is multiplied by the logarithmofthenumberof observationsamplesused,but for an AIC model, the number of model parameters is addedtothenegativelog likelihoodvalue.
Before concluding that the Hidden Markov Model employed may be effectively utilised in the stock market, perform empirical assessments on the support vector regression analysis prediction method and the hidden markovmodelpredictionmethod,respectively.
TheperformancemetricthatisusedinthisprojectisMean Absolute Percentage Error (MAPE) which is defined as ����=1�∑|�������(�)−����(�)|����(�)��=1
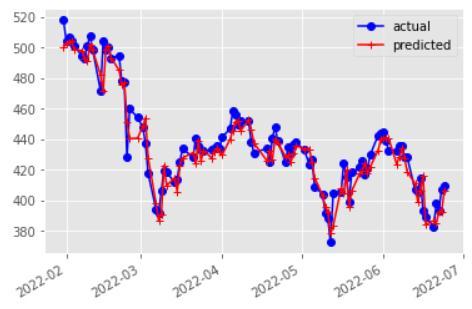
Identifying the effectiveness of HMMs in stock price prediction was the key goal. To train the model and determine the probability of the observations, utilized the free source Python module hmmlearn. TATA Motors Inc., Reliance Inc., and YES BANK Corp. is chosen to be the stocks. The closing price is taken into account together with the market's attributes during the last 2520 working days (about 10 years). The most recent 100 observations were set aside for testing, while the remaining observations were utilised to train the model. Starting with the 100th day and utilising its actual observation to fine tunethemodelforforecastingthe99thdayandsoon, projectedthepricesfortheprevious100days.Asaresult, it will add one more training sample each time then fine tunethemodel.Puttingofthefixedmodelintopractiseby limiting the number of states to four. The stock price predictions for TATA MOTORS, Reliance, and YES Bank utilisingHMMwithfourstatesareshowninFigures(3 5). Tocomparetheoutcomes,computetheMAPEandshowed the forecasts and the actual prices. After that, improved the model by choosing the one with the lowest BIC value, whichdependsonthequantityofstates.
Axis Key (Xaxis = Date, Yaxis = Price)
International Research Journal of Engineering and Technology (IRJET) e ISSN:2395 0056
Volume: 09 Issue: 06 | June 2022 www.irjet.net p ISSN:2395 0072
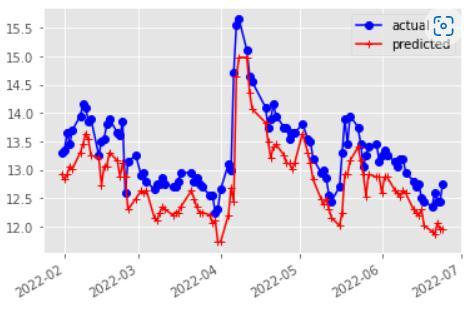
Fig. 4 RELIANCE
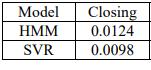
Fig.5YESBANK Table of Comparison
MAPEvaluesforTATAMOTORSModelClosingprice.
Table.2
MAPEvaluesforRELIENCEModelClosingprice.
Table.3
MAPEvaluesforYESBANKModelClosingprice.
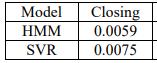
Table.4
Support vector regression (SVR), a non probabilistic model,wasalsoutilisedtomodelthestocks.Takealookat the data set (x1, y1), (x2, y2),..., (xT, yT). In SVR, yi is a response variable as opposed to Support Vector Machines for classification, where yi is a label. Searched for a functionthatusesthepricesofthecurrentdaytoforecast theclosepricesofthefollowingdayusingSVR.Toforecast the four prices, created four models. The testing and training procedures are the same as for the HMM. Retrained the SVR to forecast for subsequent days by starting predictions with the 100th day and using its real observation. Trained the SVR using historical data up to the previous day in order to forecast the pricing for the nextday.
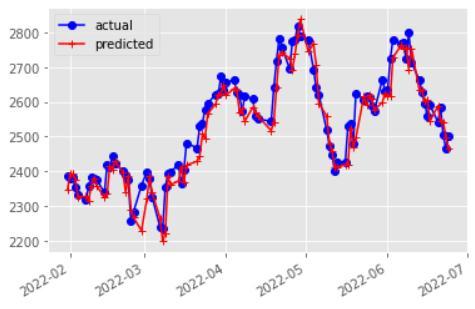
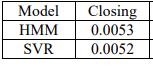
In order to obtain the forecasts for the following day, the current day's pricing is passed. To compare the outcomes from SVR and HMM, computed the MAPE and plotted the predictionsontheidenticalHMMplots.Figures3 5display the actual and forecast closing prices for the Stacks based onHMM.TheMAPEvaluesforallthreeequitiesareshown inTables2 4usingtheHMMandSVRmodels.
In both the HMM and the SVR implementations, the projected values are shown for Close price closely track the patterns displayed by its corresponding real values, and the MAPE values were also found to be comparable. The SVR model's predictions were not confirmed by jarring changes in the stock price. However, it was discovered that the HMM based model was extremely susceptible to changes in stock price. This conclusion is alsoinlinewiththescatterplotofthepredictionerrorfor each day for both models, where the distribution of the error points was seen to be more dispersed around zero fortheHMMandconcentratedaroundzeroforSVR.Figure 6 displays the HMM prediction for the next four days for thestockTATAMOTORS.
International Research Journal of Engineering and Technology (IRJET) e ISSN:2395 0056
Volume: 09 Issue: 06 | June 2022 www.irjet.net p ISSN:2395 0072
Markov Model. In order to produce a probability and supportthepredictionfindingswithstatistics, selectionof pattern matching sequences by looking at the historical sequence.
In future, it is possible to add different parameters to the modelforbetterpredictionofresultandaddnewfeatures like sentimental analysis to the web service to make this systemmuchmorerobustandsustainable.
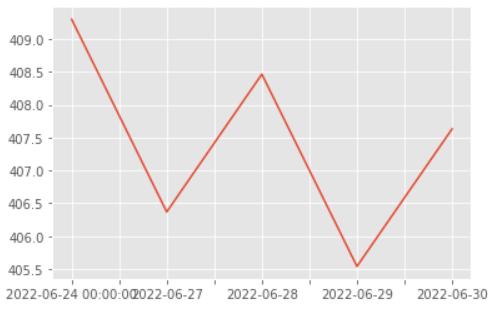
Fig. 6 Prediction plot for Tata Motors
Hidden Markov Model seeks to minimise the impact of factor selection, combination, and transformation, in contrast to the support vector regression analysis prediction method and other forecasting techniques. To minimise unneeded mistakes, this model makes a wise decision by employing the implicit prediction and letting the stock price influencing components be included in the hidden state model. Therefore, the stock price may be predicted using the Hidden Markov Model. Modifying the originalHiddenMarkovModelapproachtoaccountforthe single forecast uncertainty and unpredictability. An average weighted factor is performed to complete the development of the forecast accuracy, and lower the investment risk by taking into account the impact factor prediction data. It is true that the stock market forecast approachhassignificantpracticalimplications.
Even though, in general, the number of states in Hidden Markov Models would have a substantial impact on the observations, when tried to determine the best model utilising the optimum states using BIC, it did not make a significant difference. When the prices for the following day are forecast, both HMM and SVR have comparable accuracy.SVRprovidesmoreconsistentforecasts,whereas HMM captures the volatility of stock values. HMM may thus be more effective for equities with significant volatility and SVR may be more effective for stocks with morestability
Inconclusion,modellingandpredictionofHiddenMarkov Modelsformultivariatefinancialtimeseries offersasetof useful frameworks for probabilistic analysis and is a key tool in the field of pattern recognition. The appropriate observed vector is chosen, the quantity of hidden states, the emission probability density functions, and determine the goal time series change pattern based on the Hidden
[1] B. L. Pooja, Suvarna Kanakaraddi ,Meenaxi .M. Raikar. (2020)“SentimentBasedStockMarketPrediction”.School of Computer Science and Engineering KLE Technological UniversityHubli,India.
[2] Mohammad Mahabubul Hasan, Pritom Roy, Sabbir SarkarandMohammadMonirujjamanKhan(2021)"Stock Market PredictionWeb Service Using Deep Learning by LSTM " Department of Electrical & Computer Engineering NorthSouthUniversityDhaka 1229,Bangladesh.
[3] Sidra Mehtab & Jaydip Sen (2020) "A Time Series Analysis Based Stock Price Prediction Framework Using Machine Learning and Deep Learning Models "School of Computing and Analytics, NSHM Knowledge Campus Kolkata 700053,India.
[4] Dr. Devpriya Soni1, Sparsh Agarwal, Tushar Agarwal, PooshanArora,KopalGupta(2021)"OptimisedPrediction Model For Stock Market Trend Analysis " Department of CSE, Jaypee Institute of Information Technology, Noida, UttarPradesh,India.
[5] Tao Xing, Yuan Sun, Qian Wang, Guo Yu (2021) "The AnalysisandPredictionofStockPrice"InternationalSchool ofSoftwareWuhanUniversityWuhan,China.
[6] Faisal momin, Sunny patel (2020) "Stock Market Prediction System Using Machine Learning Approach" department of computer engineering, sandip foundation, nashik,India.
[7]MTherasaSSarveshwarMMadhusudhaananVNaveen Kumar (2020) "Survey On Stock Market Forecast Using Machine Learning And Text Mining With Cloud’s CaaS" Department of Computer Science and Engineering, PanimalarInstituteofTechnology,Chennai 600123.