International Research Journal of Engineering and Technology (IRJET) e ISSN:2395 0056

Volume: 09 Issue: 06 | June 2022 www.irjet.net p ISSN:2395 0072
International Research Journal of Engineering and Technology (IRJET) e ISSN:2395 0056
Volume: 09 Issue: 06 | June 2022 www.irjet.net p ISSN:2395 0072
1 Department of Computer Engineering, Government Polytechnic College, Cherthala, India 2,3,4 Department of Computer Engineering, College of Engineering, Cherthala, India ***
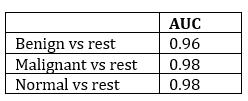
Abstract - Breast cancer is the most happening death from cancer around the globe. Early identification improves the chances of complete recovery and increases life span, but it is a long drawn process that frequently leads to pathologists disagreeing. Computer assisted diagnosis methods could increase diagnostic precision. In this work, we present an innovative and hybrid form of deep Convolutional Neural Network (CNN) based learning integrated with traditional machine learning for classifying Breast Ultrasound (BUS) images. Feature extraction by transfer learning and classification via the Extreme Gradient Boosting (XGBoost) classifier helped us with the task of classifying BUS images in our work. The Non Local Means (NLM) filter is used to preprocess BUS images. This experiment makes use of the Kaggle Breast Ultrasound Images Dataset. We report 96.7% accuracy, 96% AUC for benign vs rest, 98% AUC for malignant vs rest, 98% AUC for normal vs rest, and precision/recall/F score is, 100%/96%/96% for benignclass, 95%/97%/96% for the malignant class and 95%/98%/97% for the normal class. This method, in our opinion, surpasses other commonly used automatic BUS image classification algorithms.
Keywords: Convolutional Neural Network (CNN), Breast Ultrasound (BUS) images, Extreme Gradient Boosting (XGBoost), Non Local Means (NLM) filter, AUC, precision/recall/F score
Cancer disorders are the second biggest mortality cause, the world over, accounting for 9.6 million deaths in 2018. Among such disorders breast cancer is reported to be the most dangerous and extremely prevalent kind of cancer, causing almost 6 lakh deaths per annum. The death rate is reduced when cancer is detected and treated early. The ducts, which are tubes that supply milk to the nipple, and the lobules, which are milk producing glands, are perhaps the more frequent locations where a cancer region is detected in the breast. Among the various imaging
modalities available, ultrasonography is suggested for breastcancerprognosisatanearlystage
For the past forty years, ultrasound is well known for its ability to identify cancerous regions in the breast. Ultrasonography, in addition to mammography, has been showntoincreasesensitivityfordetectingbreastcancerin recent years, especially in women with denser breast tissues, predominantly in young women. Breast ultrasonography is progressively increasing prominence in the physical examination of women considered to have a higher susceptibility to breast cancer, thanks to the introduction of novel technologies such as shear wave elastography and contrast enhanced ultrasound. Although ultrasound takes more time from the radiologist and is operator dependent, it does not use ionizing radiation, gives greater soft tissue contrast, and can guide a biopsy instrument in real time, unlike mammography. Though somestudiesestimateapredictionpositiverateoflessthan 5%, adding ultrasonography to a screening exam may still produce a significant amount of incorrect positive predictions
In order to increase the radiologist's sensitivity when performing mammography, computer aided diagnosis (CAD) software has shown promising outcomes. A lack of medically approved technology for widespread use in breast ultrasonography creating positive findings in recent studies made the problem worse. In recent years, artificial neural networks have shown promising outcomes for a variety of applications [1 4] With the competence of a human in detection and classification steps, a collection of algorithmsknownasdeeplearninghasjustquicklyevolved inquality management in the field of the manufacturing industry [5]. Deep learning techniques handling images belonging to the field of biomedical images fail mainly due to the need for enormous quantities of superior quality train and test dataset, which includes annotated images marked as masks or Ground Truth (GT). ROI texture information gets muddled due to speckle noise, making it
International Research Journal of Engineering and Technology (IRJET) e ISSN:2395 0056
Volume: 09 Issue: 06 | June 2022 www.irjet.net p ISSN:2395 0072
unable to detect malignancy concerns. As a result, creating or employing a good filter can help reduce speckle noise, which helps for quick extraction of features and segmentationlater.Again,segmentationcanbeproblematic due to the machine created artifact. Finally, it may be challenging to find powerful features for predicting cancer risk.
However, feature extraction still heavily depends on the knowledge of radiologists. The difficulty of manually creating characteristics from images drove researchers to develop more recent techniques capable of automatically inferring distinguishable features from images. Deep learning is a technique that helps the extraction of non linear features. Deep learning models have been demonstrated to be very effective in the classification of ultrasound images when pattern identification by hand is challenging[6,7].
Several researchers have given several ways for automated classifications of breast ultrasound images for cancer diagnosis throughout the last few decades. In this regard, some researchers have developed clustering based algorithmsthatusethecircularHoughTransformaswellas avarietyofstatisticalvariablesforimagesegmentationand image classification [8 10]. Histopathological image analysis methods are quickly expanding throughout the field of biomedical image analysis, but a significant need still exists for an automated model capable of producing effectivefindingswithbetteraccuracy[11 13].
Deep learning is a technique that was developed to effectivelyextractpertinent data fromunprocessed images and use it for classification tasks for overcoming all limitations found in existing techniques of the traditional machinelearningapproach.Deeplearningdoesnotrequire manual feature tuning; instead, it uses a general purpose learning approach to learn from data sets. Recently, Convolution Neural Network (CNN) achieved a lot of success in the medical field, such as meiosis cell detection from microscopy images [14,15], detecting the presence of tumours [16], segmenting neural membrane [17], skin disease, and classification [18], immune cell detection and classification [19], and mass quantification in mammograms[20].
TheCNNapplicationperformswellwithlargedatasets, but it struggles with small data sets. Individual CNN architectures can improve their performance after combining the intellect using the concept of transfer learning [21,22], resulting in higher classification accuracy and decreased computation costs. Using pre trained deep
CNN, features are extracted from general images and then applied directly to domain specific and smaller data sets [23]. Training is performed in 2 epochs for single and overlapping regions using the novel transfer learning method known as context based learning, and it is exceptionally good at identifying and classifying breast cancer [24]. Transfer learning has been used in the proposedframeworktoovercomeshortcomingsinexisting malignant tumor detection and classification systems. The following is a summary of this paper's primary contribution:
1. Reduce speckle noise with the help of the Non LocalMeans(NLM)filter.
2. Extract features with the help of transfer learning usingVGG16.
3. Classification of BUS images using XGBoost classifier.
The paper comprises seven sections. The most recent literature review of the classification of BUS images is mentioned in Section 2. Section 3 provides a short description of the data used in this work. The suggested paradigm and technique are discussed in Section 4, which containssubsectionsonpreprocessingandaugmentationof data, the architecture of VGG16, and the technique of transfer learning. The details of how the technique is actually implemented are discussed in Section 5. Section 6 gives a clear picture of the result acquired after implementing the proposed approach, as well as its performance evaluation. Lastly, in Section 7, we bring the study to a close and offer recommendations for additional research.
Using support vector machines (SVM) and discriminantanalysis,R.Rodrigueset al.[25] establisheda fully automatic method for the segmentation and classification of Breast Ultrasound images. To classify the pixel values of BUS images acquired after performing a bunchofimageprocessingmethods ofmultipleresolutions for different values, applying a high pass filter, non linear diffusion operation, applying a low pass filter, and 2 mean curvature forms from Gaussian filtering are used, but the object's edge is strengthened by the use of a filling technique[25]
For the diagnosis and classification of breast cancer, the technique called Linear Discriminant Analysis
International Research Journal of Engineering and Technology (IRJET) e ISSN:2395 0056
Volume: 09 Issue: 06 | June 2022 www.irjet.net p ISSN:2395 0072
(LDA) [26]andLogistic Regression(LOGREG) [27]aretwo often used linear classifiers. LDA's main purpose is to obtain the optimum linear combination of features for distinguishing two or more data classes. [28] utilized LDA to examine data of 400 samples which have 4 features generated automatically. The average area under the ROC curve for 11 independent experiments was 0.87. In a databaseof58individuals,LOGREGwasusedtoassessthe riskofcancer[29].
Back Propagation Neural Networks (BPN) [30], Self Organizing Maps (SOMs) [31], and Hierarchical Artificial Neural Networks (ANN) [32] are three types of neural networks extensively used in the prognosis and classificationofbreastcancer.
Oncetheparametershavebeenestablishedduring the learning phase, a decision tree could be modeledas a classification tool. The method is much easier and quicker to implement than artificial neural networks [33]. It does, however, rely largely on the creation of non terminal node classification rules and threshold values. The decision tree construction method C4.5 [34] is well known. This algorithm is commonly used in artificial intelligence and is included in the free WEKA classifier package (where it is referredtoasJ48).C5.0isanupgradedversionofC4.5with severalnewfeatures.Thedecisiontreein[35]wascreated using algorithm C5.0 for 153 data samples of training and testing data of90samples Thecovariantcoefficient of ROI wasusedasafeatureinthedecisiontree,withanaccuracy of 96 percent (86/90), a sensitivity of 93.33 percent (28/30), and a specificity of 96.67 percent (58/60) on the testingdataset,respectively.
Texturefeatureshavebeenutilizedexplicitlyinthe form of feature vectors to estimate the similarity score in [36], and the downside is the need for a database that should be from the same platform. In [37], a basic set of images were created from the entire database using Principal Component Analysis (PCA), and every image was describedbyalinearcombinationofimages fromthebasic set that was given weights. The newly obtained vector utilizedfordeterminingthesimilarityscorewastheweight vector. With the help of images from a variety of sources, thisstrategyworkedwonderfully.
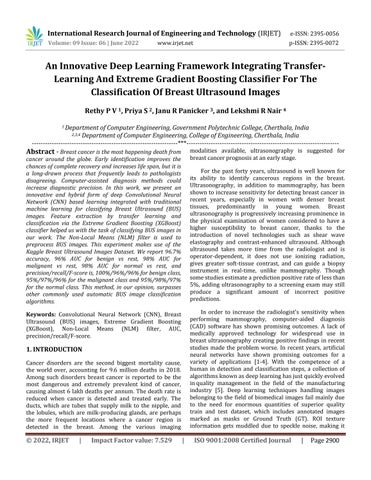
The experiment is based on the Kaggle Breast UltrasoundImagesDataset[38].Breastultrasoundscansof women aged 25 to 75 are collected as part of the baseline data.Thisinformationwasgatheredin2018.Thereare600
female patients in all. The total number of images is 780 withanaverageresolutionof500x500.ThemajorityofBUS images are in grayscale. At Baheya Hospital, they were acquired and kept in a DICOM format. Over a year, the images were acquired and annotated. There are three categories in the BUS dataset: benign, malignant, and normalasdemonstratedintable1
Tothattime,1100photoshadbeenobtained,but780were left after preprocessing. The original images contain insignificant data that cannot be classified in bulk. The result varies with such insignificant information. The scanning operation was carried out using the LOGIQ E9 ultrasound system and the LOGIQ E9 Agile ultrasound system [38]. These technologies are commonly found in high quality image acquisition for radiology, cardiology, and cardiovascular care applications. The images are produced with a resolution of 1280x1024 pixels. 1e5 MHz transducers are used in the ML6 15 D Matrix linear probe [38].AllimagesareinPNGformat.
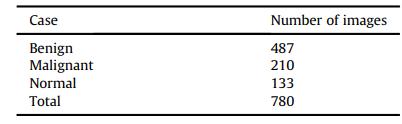
This section explains the proposed approach for extracting features from BUS images and classifying them as normal, benign, or malignant, which is based on CNN architecture and the XGBoost classifier. The Non Local Means Filter (NLM), created by Buades [39], is used to minimizethespecklenoiseinBUSimages.Manyofthelow levelcharacteristicsintheproposedmodelareextractedby VGG16trainedontheImageNet Thefeaturesarethensent to the XGBoost classifier for classification, as shown in Fig 1
International Research Journal of Engineering and Technology (IRJET) e ISSN:2395 0056
Volume: 09 Issue: 06 | June 2022 www.irjet.net p ISSN:2395 0072
Fig1:Proposedmethod
The following subsections give the proposed method in greatdetail.
This stage is mandatory to decrease speckle noise in BUS images. Speckle reduction is a major preprocessing step for obtaining, analyzing, and distinguishing information from medical images taken using ultrasonography. In the proposed method, the NLM filter presentedin[39]isusedtodecreasespecklenoise.
For CNN to enhance its accuracy, it needs a lot of data. Furthermore, CNN's performance diminishes with a small quantityofdata duetotheover fittingproblem. This suggeststhatthenetworkexcelsonthetrainingdatasetbut fails miserably for the test dataset. To enlarge the data set and eliminate over fitting concerns, the proposed method uses a data augmentation technique [40,41]. In this, the quantityofdataisincreasedbyexecutingspatial geometric modifications to the dataset using simple and efficient image transformation techniques. In this way, RGB value adjustment, intensity transforms (translation, scale operation, rotating of images), flip operation, and adding noisedisturbanceallcontributetotheimagedataset[41].
4.2.
of relevant features using pre trained VGG16
A Visual Geometry Group16 (VGG16) architecture is used initially for extracting features in the proposed systemtoclassifybreastcancerinBUSimages.Thefeatures could contain several of them retrieved from a single feature descriptor; which could represent shape descriptorslikecircularity,roundness,compactness,andso on.
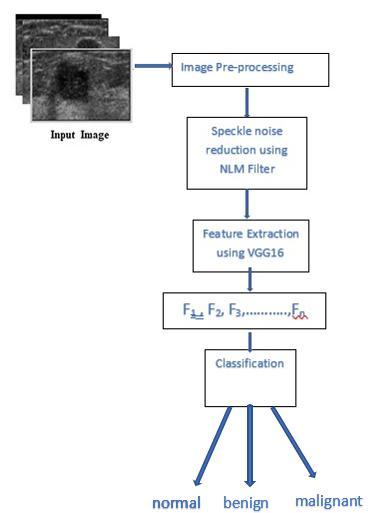
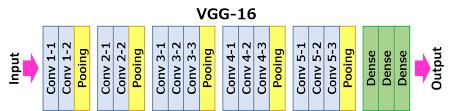
Fig2:VGG16architecture(adoptedfrom[42])
Basedontransferlearningtheory,thisarchitecture is first pre trained for a number of generic image descriptors for images in ImageNet, then appropriate featureextractionfromBUSimages[43]isdone.
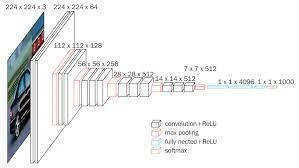
VGG16'slayersareshowninFigure3.The number 16 in VGG16 stands for 16 weighted layers. VGG16 comprises thirteen convolutional layers, five Max Pooling layers, and three Dense layers, for a total of twenty one layers, but only sixteen weight layers, which are learnable or trainable parameters layers. The input tensor size for VGG16 is 224, 244 with 3 RGB channels. The most mentionable feature of VGG16 it does not have a large number of hyper parameters. The convolution filter size is 3x3, padding is the same, the stride is 1, the max pool size is,2x2,and,stride2.
The convolution and maximum pool are arranged in a regular pattern in the entire architecture. The first convolutionlayerhasafiltersizeof64,thesecondlayerhas a filter size of 128, the third layer has a filter size of 256,
International Research Journal of Engineering and Technology (IRJET) e ISSN:2395 0056
Volume: 09 Issue: 06 | June 2022 www.irjet.net p ISSN:2395 0072
and the fourth and fifth layers have a size of 512 Then comesthethreeFullyConnected(FC)layers.
VGG16 trained on images from the ImageNet is used for extracting features from our BUS images without includingthetoplayers,i.e.,FClayers.
In order to train a CNN a big amount of data is needed, yet compiling a large data collection of relevant problemscanbedifficultinsomecases.Inmostreal world applications, the scenario is different, and gathering matching training and testing data is a tough task. The phrase"transferlearning"wascoinedasaresult.Itisavery popular method used in the traditional Machine Learning (ML) approach in which a prior knowledge needed to answer one problem is learned and reused on subsequent problems. Before being applied to the target task, which shouldbelearnedonthetargetdataset,thebasemodelhas beenbuiltontherelevantdatasetforthattask[44].
The two key steps in the transfer learning process are the choice of the network model, the scale of the challenge, and the similarity score. To decide on which model to utilize, the problem linked to the target is identified and used. A high risk of overfitting exists for datasets related to the medical field, motor vehicle department, fingerprint analysis, etc. where the target and source are almost the same [45]. Similarly, if the dataset is larger and the source and target are similar, then it is unlikely, and the pre trained model only has to be fine tuned.
ThesuggestedsystemmakesuseofVGG16toshare itstransferlearningandfine tuningproperties.VGG16was trainedforimagesfromImageNetwiththehelpof transfer learning. As a result, the architecture may learn generic features from a variety of data sets without the need for further training. The XGBoost classifier employs decision tree based classification to identify the normal, malignant, and benign BUS images using the number of features collectedseparatelyfromtheCNNarchitecture.
The Extreme Gradient Boosting classifier, called XGBoost[46]classifierisusedtoclassifytheBUSimagesas normal, benign, or malignant. It is a technique that is suitable for classification as well as regression modeling, extensively used in traditional machine learning problems It's a group of decision trees that have been boosted by gradients. Gradient boosting is a technique for developing
new models that forecast something called a residual or error of the earlier model, which is later combined for reaching a final prediction. In this type of boosting operation, a gradient descent technique is employed to reduceerrors[47]
Toexpeditetheprocess,themethodwaswrittenin Python and tested on the Google Colab environment. The deep learning models were created using the PyTorch package. VGG16 is imported using the Keras application library. We utilized the XGBoost library to create the XGBoost classifier. To optimize the loss, we tried different parameter values to improve the accuracy of the model. Table 2 shows the suggested model'shyperparameter configurationindetail.
Model Hyperparameter Value
XGBClassifier
n_estimators 100 Max_depth 3 Min_child_weight 1.0 learning_rate 0.1 colsample_bylevel 1.0 colsample_bytree 1.0 subsample 1.0 reg_alpha 0 reg_lambda 1.0
Table2:Hyperparameter’svaluesofXGBClassifier
The experimental results for our proposed model are presented in this section. The accuracy score is the major evaluation metric we use. Precision, recall, F1 score, and AUC score are also reported. To generate the aforementioned metrics, the predicted class is compared withtheactualclass.
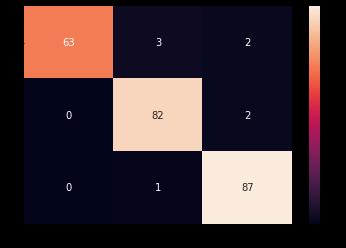
Using the VGG16 model trained in the ImageNet, we extracted image characteristics during stage 1 of training. Then the XGBoostClassifier was used for training on these features. On the test set, the XGBoostClassifier after VGG16 yielded remarkable results, with a 96.67% accuracy. The confusion matrix for the suggested hybrid modelisshowninFigure4.Wehavenoticedthatonlyafew
International Research Journal of Engineering and Technology (IRJET) e ISSN:2395 0056
Volume: 09 Issue: 06 | June 2022 www.irjet.net p ISSN:2395 0072
datasetshavebeenmisclassified WefindthattheXGBoost classification head over VGG16 has a lower false positive rate;thisisimportantinthemedicalfieldbecauseapatient canbe treatedasonewith thediseaseby conducting more checkupstoruleoutthediseasethantoruleouta sickone aftertheincorrectpredictionoffitness[45]
Two essential measures for validating a model used to diagnose in the medical field are sensitivity measureandspecificitymeasure Theconfusionmatrixcan beusedtointerpretthesemetrics(Figure4).
Fig5:TheReceiverOperatingCharacteristics(ROC)curve fortheproposedmodel0:benign,1:malignant,2:normal
AnAUC valueclosetoonesuggeststhat themodel is highly separable. The AUC score for each of the classificationcasesisshownintable4.
Fig4:ConfusionMatrix0:benign,1:malignant, 2:normal
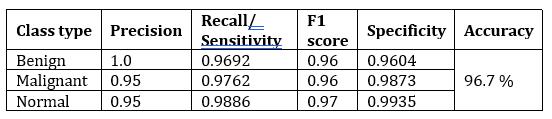
Various performance metrics for the classification resultanalysisaredepictedinTable3.
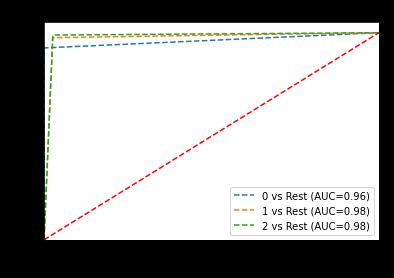
TPR (True Positive Rate) and FPR (False Positive Rate) are AUC/ROC (Area Under the Curve/Receiver Operating Characteristics) measurements that assist estimate how much information the model learns and how effectively it can distinguish between classes. TPR = 1 and FPR = 0 in the perfect condition. The ROC curve obtained fortheproposedmodelforthetestdatasampleisshownin Figure5.
This demonstrates suggested model has high separabilityandproperlyclassifiesthevastmajorityof the cases in the test data set with fewer errors. Furthermore, FPRisnearzeroandtheTPRisnearone,indicatingthatthe modelisworkingwell.
We introduce a VGG16 (CNN backbone) and XGBoost based hybrid classification model in this paper. We extract features from BUS images using the fine tuned VGG16model.Theselearnedcharacteristicsarefedintoan XGBoost model, which serves as the decision maker for classification The suggested hybrid model is able to diagnosebreastcancerwith96.7%accuracyandreliability.
Ifwehaveahugeamountoftrainingdata,thedeep learning approach is ideal. With minimal data, feature engineering and traditional machine learning will yield improved accuracy ( eg, SVM or Random Forest). Simultaneously,youcanconstructyourfeaturesbyutilizing Gabortoadda bunchoffiltersorfilterbanks.Thestrategy
International Research Journal of Engineering and Technology (IRJET) e ISSN:2395 0056 Volume: 09 Issue: 06 | June 2022 www.irjet.net p ISSN:2395 0072
weuseasafeatureextractoristouseapre trainedCNN,in this case, VGG16 trained on ImageNet. With only a few trainingimages,thismethodproducesbetterresults.
We are unable to further examine the model's performance on comparable datasets because there aren't any publicly accessible BUS image datasets. In order to advance research on this topic, we will try to eventually obtainasizabledataset elsecreateasyntheticdatasetwith thehelpofGenerativeAdversarialNetworks Wecanfigure out which algorithms work best for our data by experimenting with alternative algorithms and then utilize that information to increase the accuracy of our model. Another technique to improve accuracy is to explore differentneuralnetworkarchitecturesandidentifytheone thatbestsuitsourdata.
Making the model more interpretable should be a primary focus of future studies. Despite our efforts to comprehend the model using feature maps, the problem remains essentially unsolved. In order for the model to support the classification choice, we would like to make it more explicable in the future. This improved interpretability level of the prognostics model will impart furthercredibilitytothemedicalpractitionersandpatients.
1. Han, S., Kang, H.K., Jeong, J.Y., Park, M.H., Kim, W., Bang, W.C. and Seong, Y.K., 2017. A deep learning framework for supporting the classification of breast lesions in ultrasound images. Physics in Medicine&Biology,62(19),p.7714.
2. Zhang, Q., Xiao, Y., Dai, W., Suo, J., Wang, C., Shi, J. and Zheng, H., 2016. Deep learning based classification of breast tumors with shear wave elastography.Ultrasonics,72,pp.150 157.
3. Shi, J., Zhou, S., Liu, X., Zhang, Q., Lu, M. and Wang, T., 2016. Stacked deep polynomial network based representation learning for tumor classification with small ultrasound image dataset. Neurocomputing,194,pp.87 94.
4. Cheng,J.Z.,Ni,D.,Chou,Y.H.,Qin,J.,Tiu,C.M.,Chang, Y.C., Huang, C.S., Shen, D. and Chen, C.M., 2016. Computer aided diagnosis with deep learning architecture: applications to breast lesions in US images and pulmonary nodules in CT scans. Scientificreports,6(1),pp.1 13.
5. Yang,J.,Li,S.,Wang,Z.,Dong,H.,Wang,J.andTang, S., 2020. Using deep learning to detect defects in manufacturing: a comprehensive survey and currentchallenges.Materials,13(24),p.5755.
6. Brattain,L.J.,Telfer,B.A.,Dhyani,M.,Grajo,J.R.and Samir, A.E., 2018. Machine learning for medical ultrasound: status, methods, and future opportunities.Abdominal radiology,43(4),pp.786 799.
7. Singh, V.K., Abdel Nasser, M., Akram, F., Rashwan, H.A., Sarker, M.M.K., Pandey, N., Romani, S. and Puig, D., 2020. Breast tumor segmentation in ultrasound images using contextual information aware deep adversarial learning framework. ExpertSystemswithApplications,162,p.113870.
8. Kowal, M., Filipczuk, P., Obuchowicz, A., Korbicz, J. and Monczak, R., 2013. Computer aided diagnosis of breast cancer based on fine needle biopsy microscopic images. Computers in biology and medicine,43(10),pp.1563 1572.
9. Filipczuk, P., Fevens, T., Krzyżak, A. and Monczak, R., 2013. Computer aided breast cancer diagnosis based on the analysis of cytological images of fine needle biopsies. IEEE transactions on medical imaging,32(12),pp.2169 2178.
10. George, Y.M., Zayed, H.H., Roushdy, M.I. and Elbagoury, B.M., 2013. Remote computer aided breast cancer detection and diagnosis system basedoncytologicalimages.IEEESystemsJournal, 8(3),pp.949 964.
11. Irshad, H., Veillard, A., Roux, L. and Racoceanu, D., 2013. Methods for nuclei detection, segmentation, and classification in digital histopathology: a review current status and future potential. IEEE reviewsinbiomedicalengineering,7,pp.97 114.
12. Veta, M., Pluim, J.P., Van Diest, P.J. and Viergever, M.A., 2014. Breast cancer histopathology image analysis:Areview.IEEEtransactionsonbiomedical engineering,61(5),pp.1400 1411.
13. McCann, M.T., Ozolek, J.A., Castro, C.A., Parvin, B. and Kovacevic, J., 2014. Automated histology analysis: Opportunities for signal processing. IEEE SignalProcessingMagazine,32(1),pp.78 87.
International Research Journal of Engineering and Technology (IRJET) e ISSN:2395 0056 Volume: 09 Issue: 06 | June 2022 www.irjet.net p ISSN:2395 0072
14. Malon, C.D. and Cosatto, E., 2013. Classification of mitoticfigureswithconvolutionalneuralnetworks and seeded blob features. Journal of pathology informatics,4(1),p.9.
15. Cruz Roa, A., Basavanhally, A., González, F., Gilmore, H., Feldman, M., Ganesan, S., Shih, N., Tomaszewski, J. and Madabhushi, A., 2014, March. Automatic detection of invasive ductal carcinoma in whole slide images with convolutional neural networks. InMedical Imaging 2014: Digital Pathology(Vol.9041,p.904103).SPIE.
16. Cruz Roa, A.A., Arevalo Ovalle, J.E., Madabhushi, A. andGonzálezOsorio,F.A.,2013,September.Adeep learning architecture for image representation, visual interpretability and automated basal cell carcinoma cancer detection. InInternational conference on medical image computing and computer assisted intervention(pp. 403 410). Springer,Berlin,Heidelberg.
17. Ciresan, D., Giusti, A., Gambardella, L. and Schmidhuber, J., 2012. Deep neural networks segment neuronal membranes in electron microscopy images. Advances in neural informationprocessingsystems,25.
18. Esteva, A., Kuprel, B. and Thrun, S., 2015. Deep networks for early stage skin disease and skin cancerclassification.ProjectReport.
19. Chen,T.andChefd’Hotel,C.,2014,September.Deep learningbasedautomaticimmunecelldetectionfor immunohistochemistry images. In International workshop on machinelearningin medical imaging (pp.17 24).Springer,Cham.
20. Dhungel, N., Carneiro, G. and Bradley, A.P., 2015, October. Deep learning and structured prediction for the segmentation of mass in mammograms. In International Conference on Medical image computing and computer assisted intervention (pp.605 612).Springer,Cham.
21. Sharif Razavian, A., Azizpour, H., Sullivan, J. and Carlsson, S., 2014. CNN features off the shelf: an astoundingbaselineforrecognition.InProceedings of the IEEE conference on computer vision and patternrecognitionworkshops(pp.806 813).
22. Donahue,J.,Jia,Y.,Vinyals,O.,Hoffman,J.,Zhang,N., Tzeng, E. and Darrell, T., 2014, January. Decaf: A deep convolutional activation feature for generic visual recognition. In International conference on machinelearning(pp.647 655).PMLR.
23. Nguyen, L.D., Lin, D., Lin, Z. and Cao, J., 2018, May. Deep CNNs for microscopic image classification by exploiting transfer learning and feature concatenation. In 2018 IEEE international symposiumoncircuitsandsystems(ISCAS)(pp.1 5).IEEE.
24. Awan, R., Koohbanani, N.A., Shaban, M., Lisowska, A. and Rajpoot, N., 2018, June. Context aware learning using transferable features for classification of breast cancer histology images. In International conference image analysis and recognition(pp.788 795).springer,Cham.
25. Rodrigues,R.,Pinheiro,A.,Braz,R.,Pereira,M.and Moutinho, J., 2012, November. Towards breast ultrasound image segmentation using multi resolution pixel descriptors. InProceedings of the 21st International Conference on Pattern Recognition(ICPR2012)(pp.2833 2836).IEEE.
26. Lachenbruch, P.A., 1975. Discriminant Analysis, New York: Hafner.Lachenbruch Discriminant Analysis1975.
27. Kleinbaum, D.G. and Klein, M., 2010. Introduction tologistic regression.InLogistic regression(pp.1 39).Springer,NewYork,NY.
28. Horsch,K.,Giger,M.L.,Venta,L.A.andVyborny,C.J., 2002. Computerized diagnosis of breast lesions on ultrasound.Medicalphysics,29(2),pp.157 164.
29. Sehgal, C.M., Cary, T.W., Kangas, S.A., Weinstein, S.P., Schultz, S.M., Arger, P.H. and Conant, E.F., 2004. Computer‐based margin analysis of breast sonography for differentiating malignant and benign masses. Journal of ultrasound in medicine, 23(9),pp.1201 1209.
30. Chen, D.R., Chang, R.F. and Huang, Y.L., 1999. Computer aided diagnosis applied to US of solid breast nodules by using neural networks. Radiology,213(2),pp.407 412.
International Research Journal of Engineering and Technology (IRJET) e ISSN:2395 0056 Volume: 09 Issue: 06 | June 2022 www.irjet.net p ISSN:2395 0072
31. Chen,D.R.,Chang,R.F.andHuang,Y.L.,2000.Breast cancer diagnosis using self organizing map for sonography.Ultrasound in medicine & biology,26(3),pp.405 411.
32. Chen, D.R., Chang, R.F., Huang, Y.L., Chou, Y.H., Tiu, C.M. and Tsai, P.P., 2000, August. Texture analysis of breast tumors on sonograms. InSeminars in Ultrasound, CT and MRI(Vol. 21, No. 4, pp. 308 316).WBSaunders.
33. Cheng, H.D., Shi, X.J., Min, R., Hu, L.M., Cai, X.P. and Du, H.N., 2006. Approaches for automated detection and classification of masses in mammograms.Pattern recognition,39(4), pp.646 668.
34. Quinlan, J.R., 2014.C4. 5: programs for machine learning.Elsevier.
35. Kuo,W.J.,Chang,R.F.,Chen,D.R.andLee,C.C.,2001. Data mining with decision trees for diagnosis of breast tumor in medical ultrasonic images.Breast cancerresearchandtreatment,66(1),pp.51 57.
36. Kuo, W.J., Chang, R.F., Lee, C.C., Moon, W.K. and Chen, D.R., 2002. Retrieval technique for the diagnosis of solid breast tumors on sonogram.Ultrasound in medicine & biology,28(7),pp.903 909.
37. Huang,Y.L.,Chen,D.R.andLiu,Y.K.,2004,October. Breast cancer diagnosis using image retrieval for different ultrasonic systems. In2004 International Conference on Image Processing, 2004. ICIP'04.(Vol.5,pp.2957 2960).IEEE.
38. Al Dhabyani,W.,Gomaa,M.,Khaled,H.andFahmy, A.,2020.Datasetofbreastultrasoundimages.Data inbrief,28,p.104863.
39. Buades, A., Coll, B. and Morel, J.M., 2005. A review of image denoising algorithms, with a new one.Multiscale modeling & simulation,4(2), pp.490 530.
40. Krizhevsky,A.,Sutskever,I.andHinton,G.E.,2012. Imagenet classification with deep convolutional neural networks. Advances in neural information processingsystems,25.
41. Ciregan, D., Meier, U. and Schmidhuber, J., 2012, June.Multi columndeepneuralnetworksforimage classification. In 2012 IEEE conference on computer vision and pattern recognition (pp. 3642 3649).IEEE.
42. Kamilaris, A. and Prenafeta Boldú, F.X., 2018. A reviewoftheuseofconvolutionalneuralnetworks in agriculture.The Journal of Agricultural Science,156(3),pp.312 322.
43. Yosinski, J., Clune, J., Bengio, Y. and Lipson, H., 2014.Howtransferablearefeaturesindeepneural networks?. Advances in neural information processingsystems,27.
44. Yang, L., Hanneke, S. and Carbonell, J., 2013. A theory of transfer learning with applications to active learning. Machine learning, 90(2), pp.161 189.
45. Khan, S., Islam, N., Jan, Z., Din, I.U. and Rodrigues, J.J.C.,2019.Anoveldeeplearningbasedframework forthedetectionandclassificationofbreastcancer using transfer learning. Pattern Recognition Letters, 125,pp.1 6.
46. Chen, T. and Guestrin, C., 2016, August. Xgboost: A scalable tree boosting system. InProceedings of the 22nd acm sigkdd international conference on knowledge discovery and data mining(pp. 785 794).
47. Ramaneswaran,S.,Srinivasan,K.,Vincent,P.M.and Chang, C.Y., 2021. Hybrid inception v3 XGBoost model for acute lymphoblastic leukemia classification. Computational and Mathematical MethodsinMedicine,2021.