International Research Journal of Engineering and Technology (IRJET) e ISSN: 2395 0056

International Research Journal of Engineering and Technology (IRJET) e ISSN: 2395 0056
1,2,3,4 UG Scholar, St. Joseph’s College of Engineering and Technology Palai, Kerala 5Professor ,Department of Civil Engineering ,St. Joseph’s College of Engineering and Technology, Palai, Kerala ***
Abstract: Watershed management is the process of preparingandimplementingplans,programs,andprojects to maintain and improve the sustainable allocation of its resources and the watershed functions that affect the plant, animal, and human communities within it. As a natural entity, watersheds reflect soil, geological, water, and vegetation interactions by providing a common final product flow or stream flow, and the net impact of these interactions on that product. The basic elements for the developmentofourenvironmentandourcountryaresoil, water and biodiversity. High population densities, improper use of resources and unnatural development work put a strain on the environment. This project deals withtheidentificationanddistributionofwaterresources in the Bharananganam Panchayath of Kottayam district. Thisstudyaimstointegratevariousplansandmethodsfor the proper management and protection of Panchayath waterresources.Byconductingsurveys,visitingsites,and with the help of QGIS software, collect maps of specific areasto which resourceshave been allocated.Theoverall balance between the demand and availability of water resources on the premises is analyzed by conducting a water budgeting. This study provides suggestions for appropriate design proposals to properly guide and conservethewaterresources.
Watershed management protectsthequalityof waterand other natural resources by implementing land use and water management practices to comprehensively control the use of water and other natural resources in river basins. And a term used to describe the process of strengthening. It is managed. Opportunities to reduce water pollution In this task, pollution reduction and appropriateness are achieved by determining resources or addressing other pressing environmental issues, prioritizing these opportunities and adopting appropriate river basin management plans. We aim to identify timeframes for resource allocation and habitat improvement. It is located in Bharananganam Panchayat in the Kottayam district. These issues, which pose the greatest risk to human health, specific resources, or the
desired use of resources, can be a top priority for managementandmitigation.
This project aims to manage and protect the water resources of the area with appropriate design proposals that may include the construction of dams and barriers. Infrastructure improvements, including more frequent maintenanceorinadequatestormwatertreatmentsystem upgrades or replacements of municipal storm water systems, and identification and elimination of illegal connectionstomunicipalstormwatersystems.
Include various plans to secure the population's water demand.Reductionofpavedareasandotherimpermeable surfaces, especially near water bodies and wetlands. Zoning and subdivision regulations include reducing land cover / impermeable cover, reducing road width, encouraging cluster and less impactful development, limiting land turbulence such as grading and land reclamation,andincreasingdevelopmentsetbacks.Canbe revised to address the issue of. Reduce flood impacts through proper river system analysis and acquisition, green road planning, and establishment of vegetation buffersalongwaterbodiesandwetlands
Identify other suitable household practices for homeownersandlandowners(promotingtheuseofgrass covered buffers adjacent to water bodies and wetlands, withlawnareasandfertilizersappliedtothem.Reducethe amountof chemicals).Identifyand evaluateopportunities for unstructured flood control efforts. Improve waste management, pollution control and measures rather than land leveling. 3. Hydraulic engineering and irrigation and drainage engineering need to work together effectively in levelingprojectstoadaptmeasuresthatapplytothelocal situationandthenaturalshapeoftheoriginalriverwithin thecatchmentarea.Thepurposeofthisstudyistoachieve an overall balance between the demand and conservation of the site's water resources. Take appropriate measures for the sustainable and proper use of water resources, includingthewaterbalanceofthearea,forthepurposeof determiningtheavailabilityofwaterinthearea.
Volume: 09 Issue: 06 | Jun 2022 www.irjet.net p ISSN: 2395 0072 © 2022, IRJET | Impact Factor value: 7.529 | ISO 9001:2008 Certified Journal | Page2695
International Research Journal of Engineering and Technology (IRJET) e ISSN: 2395 0056
Bo WeiLiu, Ming HuangWang (2020) [1] implemented green infrastructure practices for sound watershed management. Water management in different countries around the world provides a comprehensive understanding of international movements for sound watershed management. Pioneer countries are using greeninfrastructureapplicationstoimprove resilienceto climate change by adopting adaptive solutions and mitigating sources of pollution. This paper provides an overview of the implementation of green infrastructure usingexamplesofbioretentioninurbandevelopmentand ecosystem conservation. By applying data from other studies, excellent techniques for bioretention and improved soil stability have been established. Injecting rainwatersemi directlywiththebiosheathistwoways to maintain bioretention function to reduce peak flow. Previous studies have reported maximum pollutant reduction efficiency with bioretention, including 99% phosphorus, 82% nitrate, 92% heavy metals, and 96% suspended solids. Finally, a final profit analysis of green infrastructure was carried out from an ecological, economicandsocialperspective.
LeahL.Bremer,ChristopherA.Wada(2021)[2]createda framework for linking land cover and water balance models to prioritize watershed investment. 1) Protection of primary forest from conversion to non primary forest and2)of basinmanagementactivitiesintermsofspecific complexlandcoverandhydrologicalmodelingtoquantify the cumulative recovery benefit of 50 years of recovery. Hydrological studies characterizing relative effectiveness Distribution of primeval forests in non primitive grasslands. The highest priority areas of primary forest conservation (80th percentile of profit) are designed to prevent the loss of excessive recycling efforts at 48,600 m3 municipal facilities and businesses with a hectare of replenishment over 50 years. Incorporating a land cover change model (rather than assuming that all areas are equally vulnerable to invasion) shifts to low to medium elevation methic forest areas and is invasive. The risk of invasion by canopy species is highest. Cloud forest areas at high risk of conversion to non conventional grasslands orbareland.Restorationofprimaryforestsisexpectedto recover more than 88,900 m3 per hectare in 50 years in areasofhighestpriorityforsignificantfogturbulence,but lessrecoveryinareasoflessfogturbulence.Alsonotethis studyprovidesaframework forprioritizinginvestmentin forest conservation and restoration for groundwater recharge in a way that explains both the threat of transformation and changes in water flow. Frameworks andresultsareavailabletocurrentadministratorsandcan be updated as new eco hydrological data become available.Theresultsalsoprovidecomprehensiveinsights into the link between watershed management and groundwater recharge, especially in other areas where
islands and species invasion threaten watersheds and groundwateristhemainsourceofwater.
QiangXu, ChenGuo (2021) [3] conducted a GLC project with bidirectional impacts on soil erosion. The impact of land use on space and time erosion is relevant. In this study, two types of land use management methods were applied to the Loess Plateau. The GullyLandConsolidation (GLC) and Land Consolidation (LC) projects. Spatial distribution, spatiotemporal development, and soil erosion susceptibility maps were analyzed by spatial analysis, statistical methods, and frequency ratio (FR) modelsbasedon soilerosionthatoccurredbetween2010 and 2019. The results showed that the implementation of the GLC project could have two impacts on soil erosion. First, much of the slope erosion was caused by slope excavation in the GLC basin. Second, the amount and extent of gully erosion was effectively controlled by hydraulicengineering.Inaddition,theirrationalhydraulic engineering of LC projects can cause widespread soil erosion. Three aspects of engineering optimization measures for the GLC project were proposed. 1. This projectrequiresdifferentmeasures,especiallythoseatthe top of the slope, so it is necessary to reduce slope excavation and implement various slope safety measures. ..2.2.Fordrainswithina1.2kmradiusofGullyHead,more attention should be paid to soil and water protection measuresthansiteleveling.Asanewapproachtolanduse management, our results show that little is known about theimpactof GLCprojectsonsoilerosion,andourresults provide specific guidance for the next scenario. Can be provided. However, both in situ and out of habitation water harvesting structures caused slight changes in overallwateryieldsunderclimaticscenarios.Weconclude that by implementing an in situ rainwater harvesting structure, we can increase green water without reducing bluewater.
Perrine Hamel, Leah L. Bremer (2020) [6] reviewed how hydrological information is used in watershed management programs. Investing in watershed services programs promises the protection and restoration of ecosystemsandwaterresources.Although thedesignand implementation of such programs often involves hydrological modeling and monitoring, the role of hydrologicalinformationinmeetingtheneedsofprogram managers remains unclear. In the Camboliou basin in Brazil, we examined the value of hydrological modeling andmonitoringfromtwoaspects.Scientificreliabilityand the use of knowledge generated in the design, implementation and evaluation of watershed management programs. They use a combination of semi structured interviews, focus groups, and water modeling at different levels of data availability to provide information that improves models and data availability builds reliability and helps decision makers. I checked when it could be offered. Model sophistication and data
Volume: 09 Issue: 06 | Jun 2022 www.irjet.net p ISSN: 2395 0072 © 2022, IRJET | Impact Factor value: 7.529 | ISO 9001:2008 Certified Journal | Page2696
International Research Journal of Engineering and Technology (IRJET) e ISSN: 2395 0056
availability improved the reliability of hydrological information, but did not affect actual program design decisions.Hydrologicalmonitoringdatawasimportantfor model calibrationandhigh resolutionlanduseand cover data. This study suggests that hydrological modeling and monitoring efforts need to be determined by identifying howhydrologicaldatainfluencesdecisionmaking.
Naseer Ahmed Abbasi, Manuel Esteban Lucas Borja (2019) [4] investigated numerous dams around the world.Damsareawidespreadandeffectivesoilandwater conservation structure around the world. This review provides an overview of the use of dams for soil and water management and runoff control, with examples from the literature, based on field measurements from four continents. Over 150 years of research have shown that damsarea landmark incivil engineeringaroundthe world. Of all engineering structures, dams are probably the most iconic torrent barrier. They have been used for centuries and can be found all over the world. Over the last few hundred years, people have become increasingly awareofthedesirablebenefitsofdams,including:B.Land development, environmental improvement, agricultural production, canyon stability improvement, and severe flood mitigation. Optimal size, location and type have had a significant impact on the efficiency of dams in the basin. In addition, dams have been shown to be useful tools for controlling soil erosion and floods at the catchment level, both theoretically and practically. This paper helps policy makers extend dam projects to all erosiveareas.
GebrekidanWorku, AmareBantider (2020) [5] have developedalternativestowatershedmanagementthatcan ensure optimal benefits in climate change adaptation under various climate scenarios. Climate scenarios were developed using statistically biased multi model ensemble averages and RCP4.5 and RCP8.5 emission scenarios. The hydrological impact of climate change was assessedusing a multi gaugecalibratedandvalidatedsoil and water assessment tool (SWAT) model. Watershed managementalternatives wereprioritizedusing multiple criteria decision analysis, which compares watershed management criteria with alternatives through analytic hierarchy process. The results showed consistent reductionsinprecipitation,surfacerunoff,andtotalwater yield under all climate and climate impact scenarios. Stormwater harvesting structures were the highest priority watershed management option to reduce the effects of climate change. More than half of the Jemma basin is very well suited for on site water harvesting in baseline and future climatic scenarios. The observed terrace and expected in situ rainwater harvesting structures significantly reduced surface runoff (p <0.05), thereby significantly increasing soil moisture under baselineandfutureclimaticscenarios.ricefield.However, both in situ and out of habitation water harvesting structures caused slight changes in overall water yields
under climatic scenarios. We conclude that implementing an in situ rainwater harvesting structure can increase green water without reducing the blue water scenario. However, both in situ and out of habitation water harvesting structures caused slight changes in overall wateryieldsunderclimaticscenarios.Weconcludethatby implementing an in situ rainwater harvesting structure, wecan increasegreenwaterwithoutreducingbluewater.
Visits the waterbodies, drainages and all the plots in the watershed and conducts a detailed survey of the area. Boundaries,geographicallocation,majorwaterbodiesand drainage maps of selected area are determined. Surveys are conducted to determine the water shortage in the surroundingregionsandpresentwatertable.
A questionnaire is prepared to conduct the survey. The survey was conducted to get the details about the water shortage problem faced during the summer season, loweringofwellwaterlevel,whetherborewellisusedfor meeting the water requirements during dry season and will enquire about the presence of any rainwater harvesting methods opted in the house. It helps to determine the variation of water in their wells during monsoonandsummerseasons.
Geographic Information Systems (GIS) technology has played critical roles altogether aspects of watershed management, from assessing watershed conditions through modeling impacts of human activities on water quality and to visualizing impacts of other management scenarios.QGISisthatthebestGIStoolwithinthefreeand open sourcesoftware(FOSS)community.
Withthehelpof QGIS Softwaregeomorphologymap,land use map, soil map, Geology/Structure maps are obtained. With the collected details and data and maps from Panchayath, slopemap, base map, watershed map, village mapandcontourmapofareaisprepared.
A water budget could be a measure of the quantity of water entering and also the amount of water leaving a system. It's how to guage all the sources of supply and therefore the corresponding discharges with relevancy a basin or aquifer. It's a basic tool that may be wont to evaluate the occurrence and movement of water through the natural environment. to take care of a balance within the ecological system, one must account for the incoming (source of water) and outgoing (water losses within the
Volume: 09 Issue: 06 | Jun 2022 www.irjet.net p ISSN: 2395 0072 © 2022, IRJET | Impact Factor value: 7.529 | ISO 9001:2008 Certified Journal | Page2697
International Research Journal of Engineering and Technology (IRJET) e ISSN: 2395 0056
Volume: 09 Issue: 06 | Jun 2022 www.irjet.net p ISSN: 2395 0072
system) water resources. A water budget is also accustomed manage development of water resources within an area, and to make sure a sustainable supply of waterovertime.
All the collected details are examined in detail and evaluate the need of an effective watershed management in the Panchayath. Based on the detailed study of all the collected information will propose effective watershed managementpractices.
The best opportunities for water conservation lie in the control of the portion of precipitation which is normal runoff. Retaining surface water on the land surface for a extendedtimeincreasesthequantityofwaterenteringthe soil.
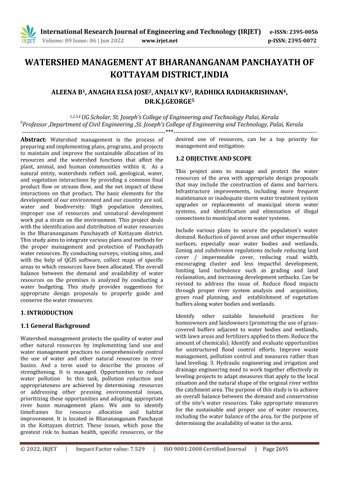
TherearemainlyfivewatershedareasinBharananganam panchayatandeachoftheseisdenotedbydifferentcolour in the map being prepared with application of QGIS software. Through this map the boundaries of each watershed area can clearly identified and analyzed. The fivewatershedareasaredenotedbelow;
IDAPPADYWATERSHED 12M32a
CHOONDACHERRYWATERSHED 12M22a
PRAVITHANMWATERSHED 12M21i ULLANADWATERSHED 13M21h
KAYYOORWATERSHED 12M25b
Among these we have covered the area of pravithanm watershedandconductedthestudies
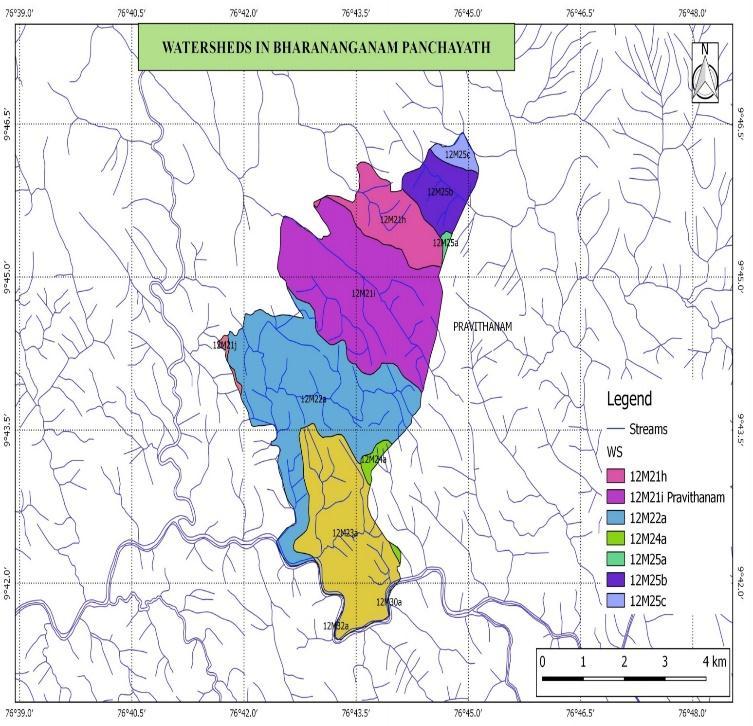
Thelocation ofthePemanalcheckdamisbeingplottedin thismap.Thewatershedareacanalsobeidentifiedinthis mapbeingplotted.
4.2WATER BUDGETING WATER DEMAND
4.2.1.DOMESTIC WATER DEMAND
Asper2011censusreportpopulationofKottayamdistrict is 1974551.While referring previous reports population growth rate is about 2%.But as per the reports of BharananganamPanchayathpopulationis15848,whichis lessthanthepopulationgrowthrateofthedistrict.Asper data,waterrequiredfordomesticpurposeisshowninthe tablebelow.
Table4.1.DomesticWaterDemand
YEAR 2022 2030 2050 Population 16000 16450 17084 Water Demand (M.C.M)
0.7949 0.8105 0.8418
© 2022, IRJET | Impact Factor value: 7.529 | ISO 9001:2008 Certified Journal | Page2698
International Research Journal of Engineering and Technology (IRJET) e ISSN: 2395 0056
4.1.2.1.CROPSUNIT WATERREQUIREMENT
Table4.2.CropsUnitWaterRequirement
CROP UNITWATERDEMAND (CUM)
Paddy 9293 Coconut 1493.27 Banana 2682.60 Vegetables 545 Tapioca 2921.25 Othertubers 6830.769 Spices 5465.573 Rubber 457.64
Amount of water required for crops as per existing farming practices and water required in future if cultivationareaisexpandedandcroprotationispracticed isshownbelow.
Table4.3.CropWaterDemand
CROP AREA(HECTARE) WATER DEMAND (M.C.M)
Paddy 1 0.009293
Coconut 275 0.41065 Banana 69 0.1851 Vegetables 12 0.00654 Tapioca 20 0.058425 Othertubers 39 0.2664 Spices 61 0.3334 Rubber 1173 0.53682 1.806453 SAMPLECALCULATION: Cropwaterdemand=Area*unitwaterdemand Waterdemandforpaddy=1*9293=0.009293M.C.M
Table5.4.Areawheremorecultivationcanbeexpanded
CROP AREA (HECTARE)
WATERDEMANDM.C.M 2030 2050
Paddy 1 0.009293 0.009293
Coconut 275 0.41065 0.41065
Banana 69 0.1851 0.1851
Vegetables 12 0.0190806 0.0190806 Tapioca 20 0.058425 0.058425
Othertubers 39 0.2664 0.2664 Spices 61 0.3334 0.3334 Rubber 1173 0.53682 0.53682 1.8189936 1.8189936
4.1.3.LIVESTOCK WATER DEMAND 4.1.3.1.LIVESTOCK UNITWATERDEMAND
Table4.5.UnitWaterDemand
LIVESTOCK WATERDEMAND(cum)
Cow 9.124 Buffalo 14.963 Goat 2.0065 Otheranimals 2.0074 Hen 0.0127 Broiler 0.12774
While comparing with State, number of livestock in BharananganamPanchayathisdecreasingeveryyear.Data regarding existing number of livestock and their water demandisshownbelow.
Table4.6.Dataregardingexistingnumberoflivestock
LIVESTOCK 2022 WATERDEMAND(M.C.M)
Cow 868 0.00792 Buffalo 11 0.0001646 Goat 1066 0.002139
Otheranimals 189 0.0003794
BIRDS Hen 6508 0.00008313 Broiler 19320 0.002468 0.0139023
Volume: 09 Issue: 06 | Jun 2022 www.irjet.net p ISSN: 2395 0072 © 2022, IRJET | Impact Factor value: 7.529 | ISO 9001:2008 Certified Journal | Page2699
International Research Journal of Engineering and Technology (IRJET) e ISSN: 2395 0056


Livestockwaterdemand=number*unitwaterdemand Waterrequirementofcow=868*9.124=0.00792M.C.M
Whilereferringtopresentsituation,thereisnovariations inthenumberoflivestock.Sotherewillnotbechangein futurelivestockwaterdemand
Table4.7.LivestockWaterDemand
YEAR 2022 2030 2050 Livestockwater demand(mcm) 0.0139023 0.0139023 0.0139023
Industrial unitsarecomparativelylessinBharananganam Panchayath, however Rubber sheet manufacturing industries are located at various parts of Panchayath. Waterisneededfortheseunits.A2%increaseisexpected in the number of industries.Table 8.8. Industrial Water Demand
YEAR 2022 2030 2050 Industrialwater demand(mcm) 0.0039 0.004536 0.005976
Asthereisnopowergenerationrelatedprojectsin BharananganamPanchayathwaterisnotneededinthis sector.
WateravailabilityinBharananganamPanchayathfrom majorwatersourcesareshownbelow:Table5.10.Water Availability
Volume: 09 Issue: 06 | Jun 2022 www.irjet.net p ISSN: 2395 0072 © 2022, IRJET | Impact Factor value: 7.529 | ISO 9001:2008 Certified Journal | Page2700
International Research Journal of Engineering and Technology (IRJET) e ISSN: 2395 0056 Volume: 09 Issue: 06 | Jun 2022 www.irjet.net p ISSN: 2395 0072
Table5.11.Analysis
WaterAvailability 2.478(M.C.M) WaterDemand 2.61885(M.C.M)
We can find that there exists a gap between water availability and water demand which is expected to increaseinfuture.Sothereisaneedforproperwatershed managementinBharananganamPanchayath.
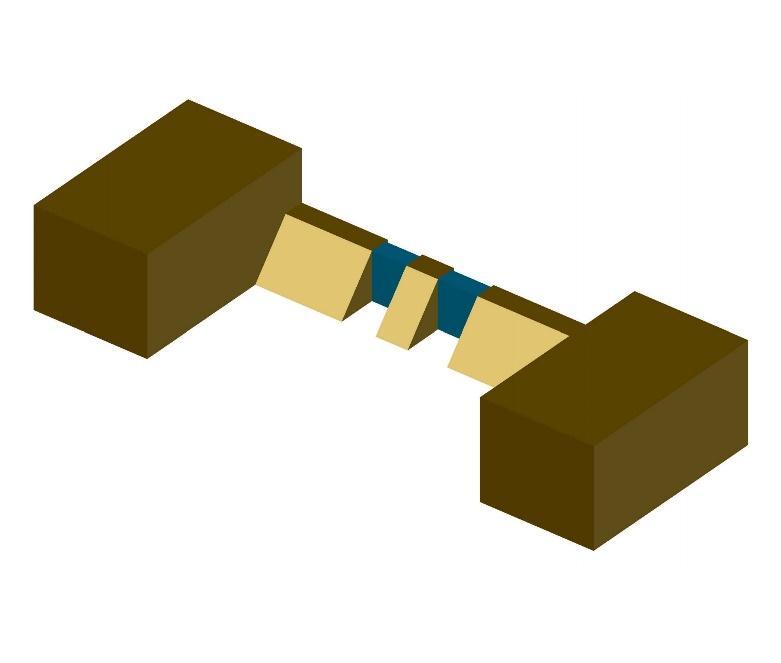
In pemanal, the existing check dam has inefficiency in its purpose due to deterioration and lack of proper working structure. During rainy season when the water overflows the solid waste gets accumulated in the checkdam resulting in poor functioning of its designed purpose. Based on our survey we had designed a model to reconstructthecheckdamconsideringthesite. Thefigure shows the 3D view of model being designed for reconstruction.Ithasawidthof5mandaheightof1.5m.
Our study area Bharanaganam panchayat is really enrichedwithbiodiversityandlandscape.Eventhoughthe small streams dry up in summer, due to the flow of Meenachil river through this panchayat the presence of ample quantity of water could be identified. But during summer season many of these water resources dry up. Many designs and structures for the proper management ofwaterresourcesarethereinthewatershedareasofthe panchayat. Mainly there are five watershed areas in the panchayat and we have reach out to the Pravithanam watershed. In Pravithanam we have visited and analyzed the efficiency of all the structures being designed to performthefunctionsofwaterresourcemanagement.The structures include ponds, check dams, VCB’s etc…Following are the conclusion drawn up from the studies;
We have identified areas which require proper management of water resources on the basis of watershed. By conducting water budgeting we wereabletofigureouttheavailabilityofwaterin the panchayat and it enables us to adopt suitable workplandesignsfortheefficientmanagementof resources.
By conducting surveys among the local inhabitants in the area we have identified the necessity for a proper resource management. We havespottedanareawhichisPemanalcheckdam situated in 3rd ward of Bharananganam panchayat, which has the need for a renovation for the existing check dam structure for better utilizationandincreasing theavailabilityofwater tothelocalinhabitants.
By proper analysis we have planned a model for the check dam design which can be incorporated tobringachangetotheexistingoneforthebetter efficiency and usage to the inhabitants in the watershed area. In addition, determination of the boundaries of the streams and removal of the accumulated silt and debris will ensure greater waterconservation.
Sun.Y, Ruifang Hao & HongXue(2020) Function zoning and spatial management of small watersheds based on ecosystem disservice bundles.
Worku.G, Yihun T&Teferi.E (2020) Prioritization of watershed management scenariosunderclimatechange.
International Research Journal of Engineering and Technology (IRJET) e ISSN: 2395 0056
Volume: 09 Issue: 06 | Jun 2022 www.irjet.net p ISSN: 2395 0072
Abbasi, N.A , Manuel Esteban &Liu.B (2019) Theuseofcheckdamsinwatershedmanagement projects.
Bremer L.L& Kimberly M (2021) Priority watershed management areas for ground rechargeanddrinkingwaterprotection.
Liu, B.W &Chiang,P.C (2020) Establishment and implementation of green infrastructure practice forhealthywatershedmanagement.
Qiang Xu &Wanlin Chen (2021) Effects of land usemanagementonsoilerosion.
Satalova.B&Kenderessy.P (2019) Assessmentof water retention function as tool to improve integratedwatershedmanagement.
Hamel.P&Leah.L.B (2020) The value of hydrologic information for watershed managementprograms.
© 2022, IRJET | Impact Factor value: 7.529 | ISO 9001:2008 Certified Journal | Page2702