International Research Journal of Engineering and Technology (IRJET) e ISSN: 2395 0056

Volume: 09 Issue: 06 | June 2022 www.irjet.net p ISSN: 2395 0072
International Research Journal of Engineering and Technology (IRJET) e ISSN: 2395 0056
Volume: 09 Issue: 06 | June 2022 www.irjet.net p ISSN: 2395 0072
Eldhose M Manjummekudiyil2, Anjitha Rajan1, Liniya Merin Mathew1 , Mariya Thankachan1 , Remitha P J1
1Student, Dept. of Civil Engineering, Mar Athanasius College of Engineering, Kerala, India
2Professor, Dept. of Civil Engineering, Mar Athanasius College of Engineering, Kerala, India ***
Abstract Increased traffic and speed have increased the structural demand on conventional tracks. Earlier while improving the track system, the blanketing layer was not considered as important. Later it is found that the design of a blanketing layer on top of the formation is a necessity for the stability of tracks, proper drainage, and strength. The blanket layer is the layer between the ballast and subgrade that spread over the entire width. It is of specified coarse and granular materials of designed thickness. The absence or improper design of a blanket layer causes speed restriction, high maintenance costs, and difficulty in maintenance.
This study is an attempt to develop an economic and optimum proportion of coarse and granular material to reach a good quality blanket layer. The investigations are all to meet the specifications as recommended by RDSO. The mix proportion is based on gradation analysis, standard proctor compaction test, and CBR test.
Key Words: Blanketing material, Soil, Aggregate, CBR value
Overtheyears,increasesintrafficandspeedshaveplaced a greater structural demand on conventional tracks, constructed initially to cater for lighter traffic. Gradual improvement of track system has been to track superstructure. Track sub structure below ballast has received less attention. It has also become important to make sure the quality of tracks for safe, comfortable, and cost effectivepassageoftrainsindesignedsituations.
The provision of a blanket layer on top of formation has becomeanecessitybecauseitsabsencemayleadtospeed restrictions,andcostlymaintenancepracticesaswellhave become an obstacle to the introduction of higher speed and higher axle load. The blanket layer is the layer between the ballast and subgrade that spread over the entire width. It is of specified coarse and granular materialsofdesignedthickness.Theblanketlayerhelpsin spreading the load on formation, limiting subgrade stresses within the subgrade strength thereby ensuring thelong termsafeutilityofthetracks.
RDSO has issued GE: G 0014 guidelines regarding the materialtobeusedintheBlanketlayer.
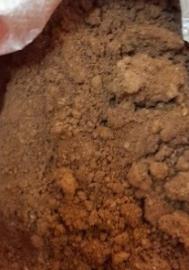
Traditionally, a blanket layer of single specified material was recommended, which becomes very costly and difficult to provide. Under the circumstances, a two layer blanketsystemhasbeenstudiedforuseinthetopportion of formation from strength as well as economic considerations. In this project, we are mixing soil and aggregatesamplesaccordingtodifferentproportionsona trial and error basis and arriving at an optimum proportiongivenstrengthandeconomy.
Todesignanappropriatemixproportionofblanketing material below railway track as per RDSO guidelines and ISspecifications.
In the scenario of large scale development of Railway through laying of new track, conversion of existing single tracks to double or more ones, modernizing of old tracks to accommodate high speed trains, blanketing layer designhasgainedawideacceptanceduetoitsimportance in tracks for safe and comfortable and cost effective passageofthetrain
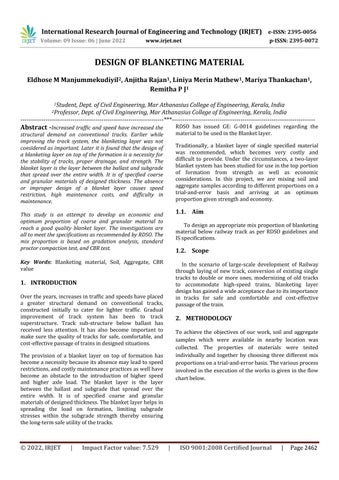
To achieve the objectives of our work, soil and aggregate samples which were available in nearby location was collected. The properties of materials were tested individually and together by choosing three different mix proportionsonatrial-and-errorbasis.Thevariousprocess involvedintheexecutionoftheworksisgivenintheflow chartbelow.
International Research Journal of Engineering and Technology (IRJET) e ISSN: 2395 0056
Volume: 09 Issue: 06 | June 2022 www.irjet.net p ISSN: 2395 0072
The grain size analysis of the soil sample was conducted according to IS 2720 Part IV of BIS. The observation with theresultisshowninTable1
Particle size (mm) Percentage weight retained (%) 40 0 20 0 10 0 4.75 22.9 2.36 12.4 1.18 21.7 0.6 16 0.3 15.4 0.15 7.2 0.075 2.2 PAN 2.2
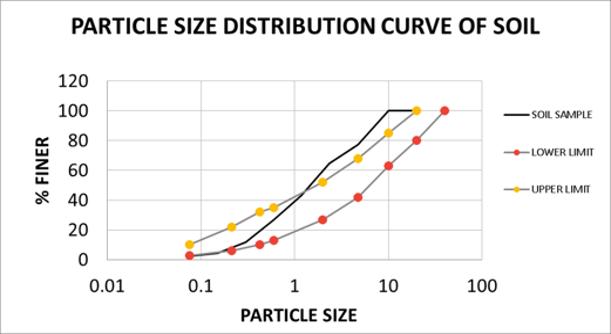
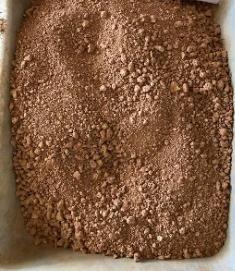
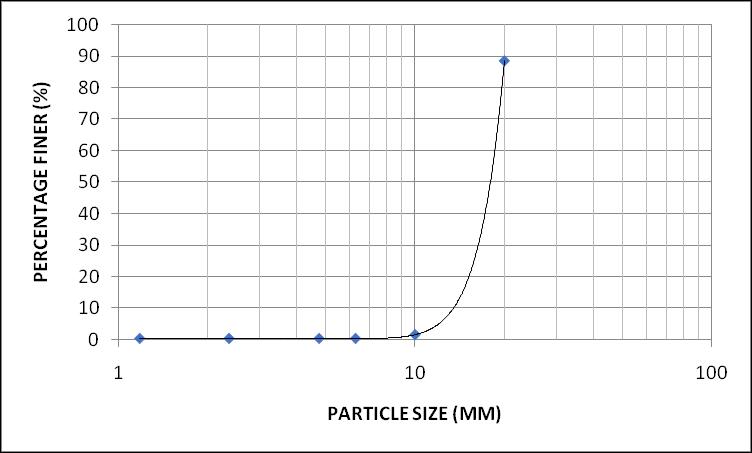
Sieve analysis showed that the soil sample can be classified under coarse grained soil. As per the unified classification system (USCS), it is classified as poorly graded sand. The gradation curve is shown in Figure 2, andtheresultstoclassifythesoilaregiveninTable2
Table2 ResultofSieveAnalysisofSoilSample
Percentage gravel 22.9% Percentage sand 74.9% Percentage fines 2.2% Coefficient of curvature 0.895 Uniformity coefficient 7.89
Figure2GradationCurveofSoilSample
International Research Journal of Engineering and Technology (IRJET) e ISSN: 2395 0056
Volume: 09 Issue: 06 | June 2022 www.irjet.net p ISSN: 2395 0072
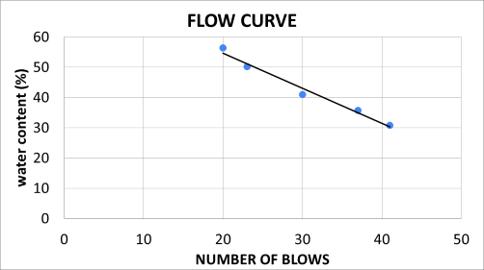
Atterberg limit test results are shown in Figure 3 Flow Curve. The liquid limit is 48.014 %, plastic limit 41.86% and plasticity index 6.15%. For the obtained plasticity indexblanketlayerthicknessneededis45cm.
The standard proctor compaction test was conducted as perIS2720PartVIIoftheBISspecification.Theoptimum moisture content and maximum dry density obtained are 19% and 1.635g/cc. The compaction curve is shown in Figure4
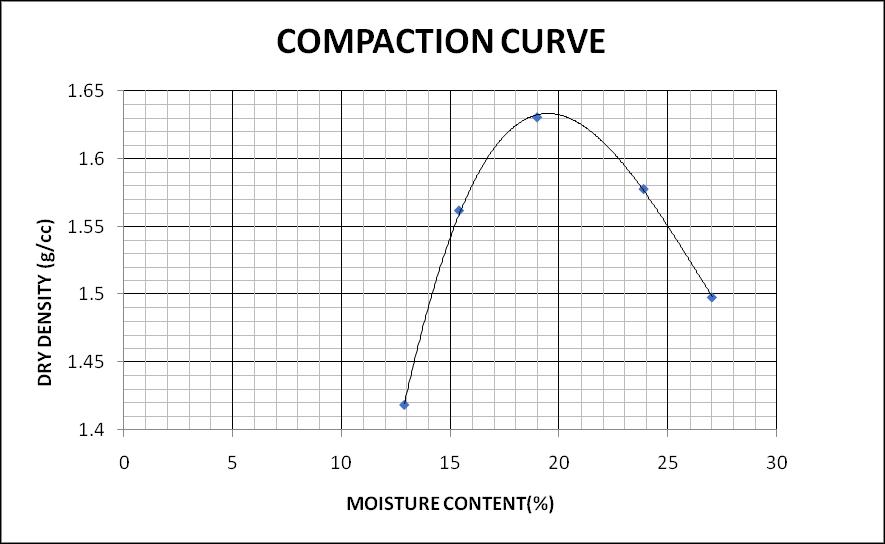
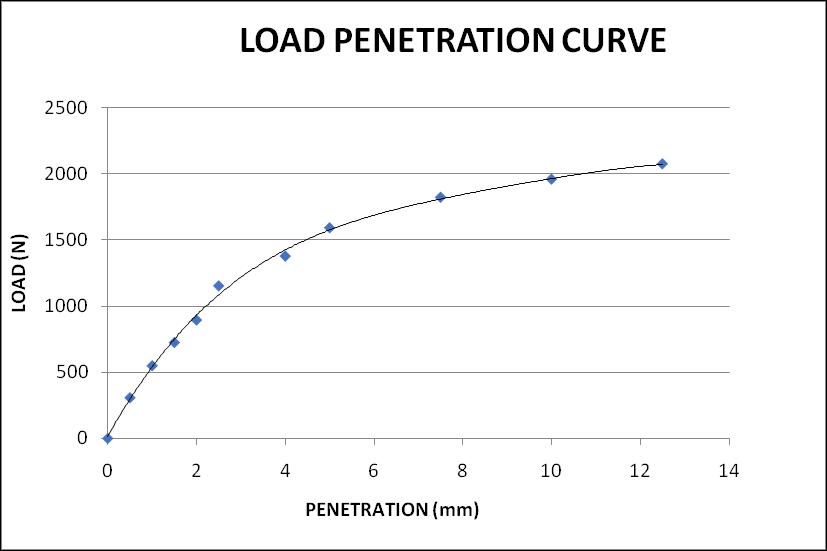
Table3ResultofCBRTestonSoil
CBR at 2.5 mm 7.92%
CBR at 5 mm 7.68%
Final CBR value 7.92%
3.2.1.
CBRtestonsoilwasconductedaccordingtotheprocedure conformingtotheIS2720PartXVIofBISspecificationand theobservationisreportedbelowinFigure5
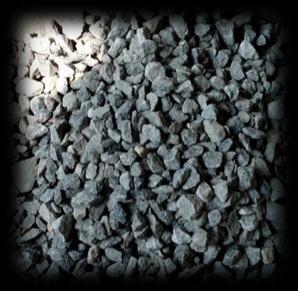
The grain size analysis of the aggregate sample was conducted according to the procedure conforming to the IS 2720 Part IV of BIS. The observation with the result is shown in Table 4and the gradation curve is shown in Figure7.
Particle size (mm) Percentage weight retained (%) 40 0 20 11.45 10 87 6.3 1.24 4.75 0 2.36 0 1.18 0 PAN .15
3.2.2.
International Research Journal of Engineering and Technology (IRJET) e ISSN: 2395 0056
Volume: 09 Issue: 06 | June 2022 www.irjet.net p ISSN: 2395 0072
Figure7GradationCurveofAggregates
The abrasion test for the aggregate sample supplied was performed in Los Angeles Abrasion Machine conforming to the procedure specified by IS 2386 Part IV. The Abrasionvalueobtainedis34.4%.
3.3. Design mix of proportion soil: aggregate:: 75:25
3.3.1. Sieve analysis
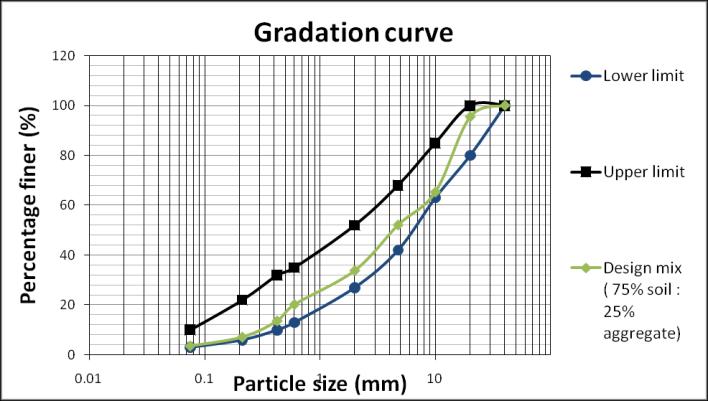
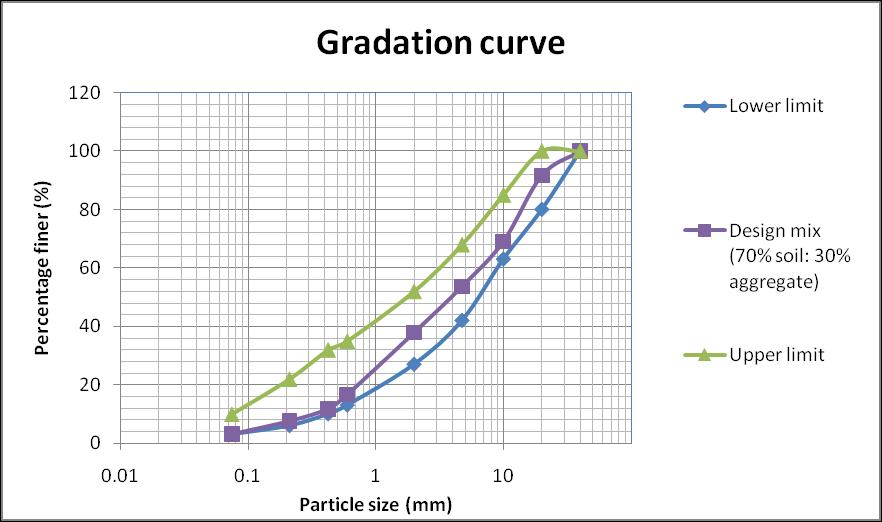
Thegrainsizeanalysisofthedesignmixoftheproportion of 75% soil and 30% aggregate was conducted and the observation with the result is shown in Table 5 and the gradationcurveisshowninFigure8.
Table5ObservationofGradationAnalysis
3.3.2.
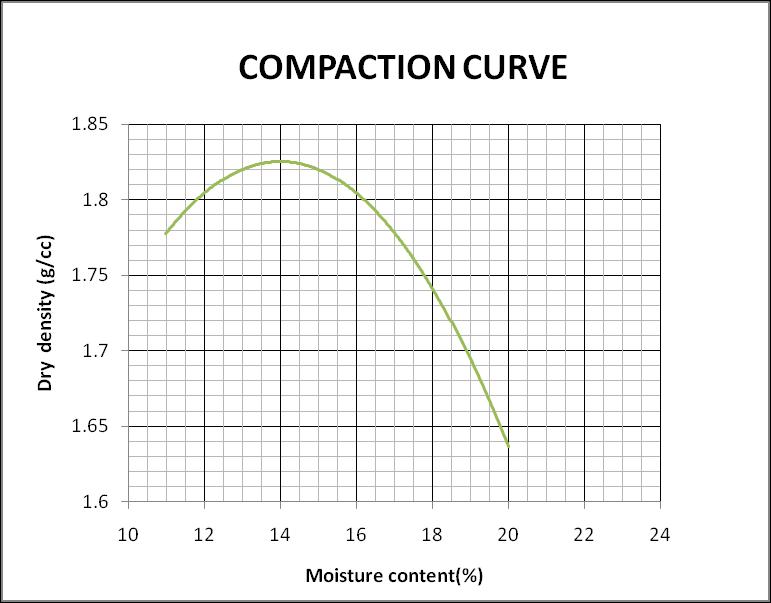
The heavy proctor compaction test was conducted as per IS 2720 Part VII of the BIS specification. The optimum moisture content and maximum dry density obtained are 14% and 1.825g/cc. The compaction curve is shown in Figure9
3.3.3.
Figure9CompactionCurve
CBRtestonthedesignmixwasconductedaccordingtothe procedure conforming to the IS 2720 Part XVI of BIS specification and the observation is reported below in Figure10andTable6.
International Research Journal of Engineering and Technology (IRJET) e ISSN: 2395 0056
0 1000 2000 3000 4000 5000 6000 7000 0 5 10 15
Load (N) Penetartion (mm)
Figure10 LoadPenetrationCurve
Table6ResultofSoakedCBRTestonDesignMix
CBR at 2.5 mm 18.73% CBR at 5 mm 20.44% Final CBR value 20.44%
3.4. Design mix of proportion soil: aggregate:: 65:35
3.4.1. Sieve analysis
Thegrainsizeanalysisofthedesignmixoftheproportion of 65% soil and 35% aggregate was conducted and the observation with the result is shown in Table 7 and the gradationcurveisshowninFigure11.
Table7ObservationofGradationAnalysis
Particle size (mm) Percentage weight retained (%) 40 0 20 6 10 27.5 4.75 17.5 2 16.85 0.6 18 0.425 3 0.212 2.06 0.075 3.25 PAN 2.9
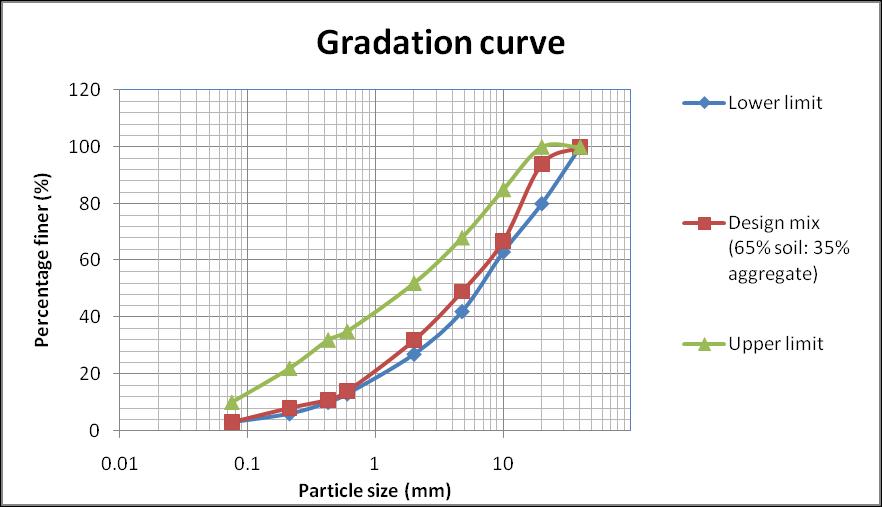
Figure11GradationCurveofDesignMix
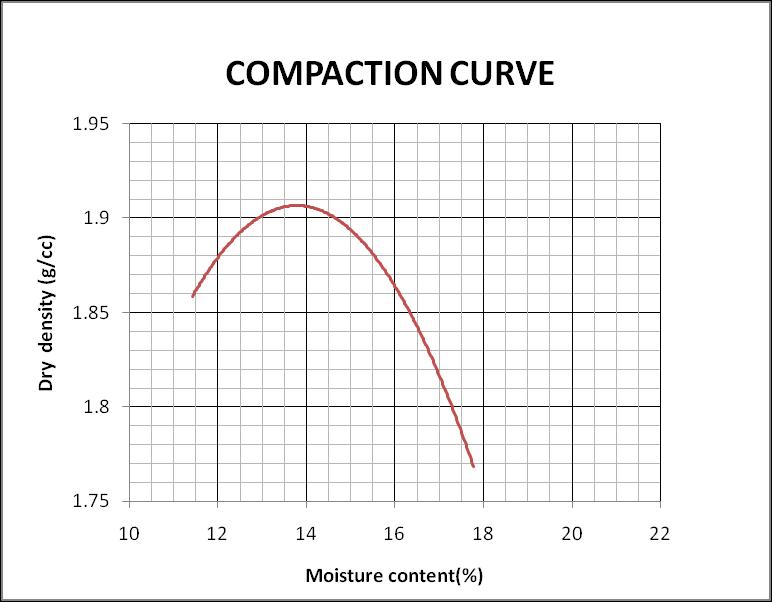
3.4.2. Heavy proctor compaction test
The maximum dry density obtained is 13.75 % and 1.91 g/cc.ThecompactioncurveisshowninFigure12
Figure12CompactionCurve
3.4.3. Soaked California Bearing Ratio test
Load pentartion curve
Load penetration curve 0 1000 2000 3000 4000 5000 6000 7000 0 5 10 15
load (N) Penetration (mm)
Figure13LoadPenetrationCurve
Volume: 09 Issue: 06 | June 2022 www.irjet.net p ISSN: 2395 0072 © 2022, IRJET | Impact Factor value: 7.529 | ISO 9001:2008 Certified Journal |
International Research Journal of Engineering and Technology (IRJET) e ISSN: 2395 0056
Volume: 09 Issue: 06 | June 2022 www.irjet.net p ISSN: 2395 0072
Table8ResultofSoakedCBRTestonDesignMix
CBR at 2.5 mm 24.84% CBR at 5 mm 25.2% Final CBR value 25.2%
3.5. Design mix of proportion soil: aggregate:: 70:30
3.5.1. Sieve analysis
Thegrainsizeanalysisofthedesignmixofaproportionof 70%soiland30%aggregatewasconducted.
Table9ObservationofGradationAnalysis
Particle size (mm) Percentage weight retained (%) 40 0 20 8.4 10 22.6 4.75 15.4 2 15.8 0.6 21.2 0.425 4.9 0.212 4.2 0.075 4.5 PAN 3
Figure14GradationCurveofDesignMix
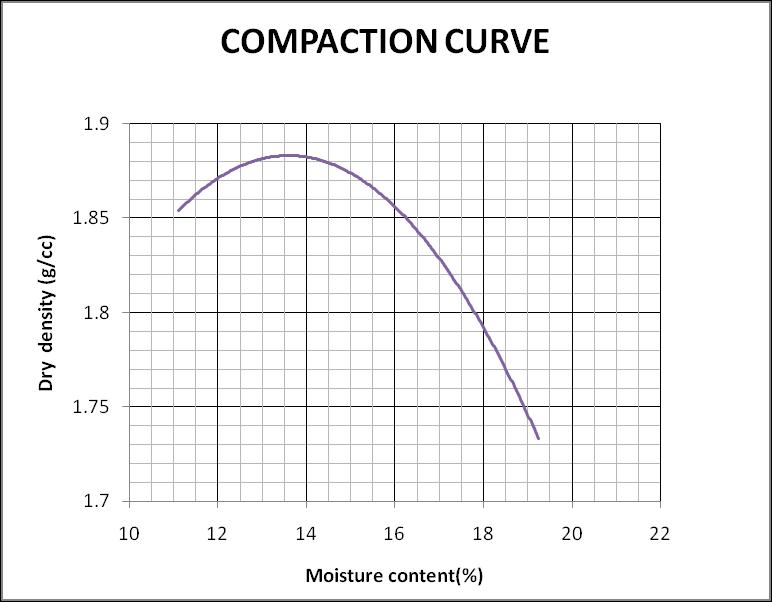
3.5.2. Heavy proctor compaction test
Theoptimummoisturecontentandmaximumdrydensity obtainedare13.5%and1.885g/cc.Thecompactioncurve isshowninFigure15
Figure15CompactionCurve
3.5.3. Soaked California Bearing Ratio test
Load penetration curve
Load (N)
0 1000 2000 3000 4000 5000 6000 7000 8000 0 5 10 15
Penetartion (mm)
Figure16LoadPenetrationCurve
Table10ResultofSoakedCBRTestonDesignMix
CBR at 2.5 mm 21.16% CBR at 5 mm 23.35%
Final CBR value 23.35%
Table 11 shows the results obtained from the gradation analysis.Fromthat, wecan interpretthat the proportions soil:aggregate::75:25andsoil:aggregate::65:35arewithin thelimitforwell gradedsoil.
© 2022, IRJET | Impact Factor value: 7.529 | ISO 9001:2008 Certified Journal | Page 2467
International Research Journal of Engineering and Technology (IRJET) e ISSN: 2395 0056
Proportion (soil: aggregate) Coefficient of curvature Uniformity coefficient
75:25 26.06 1.074
70:30 20.46 0.939 65:35 24.46 1.026
When we compare the compaction curves of three proportions the one with more percentage of aggregates gives the highest dry density. Figure 17 Comparison of Compaction Curves gives the comparison between the compaction curves. The optimum moisture content for everyproportionisalmostequal.
COMPACTION CURVES
The design mix with 65% soil and 35% aggregate by weight conform to the specifications for gradation and CBRvalue.
Soil and aggregate samples were collected from the site and all the necessary laboratory tests were conducted. After analyzing their properties, the soil sample failed to meet the mandatory specifications proposed for the blanketing material. So, we blend soil and aggregate in threedifferent proportions (suchassoil:aggregate65:35, 70:30, 75:25) to choose the one which is best suitable for the design of the blanketing layer in all desired aspects. Later, Soaked California Bearing Ratio tests were conducted on each proportion after performing the preliminarytestsrequiredtodeterminetheirstrength.
From the results obtained the following conclusion are drawn:
1.9
1.85
1.8
1.75
1.7
1.65
DRY DENSITY (G/CC) MOISTURECONTENT(%)
1.95 0 2 4 6 8 10121416182022
Poly.(soil: aggregate:: 65:35)
Poly.(soil: aggregate:: 70:30)
Poly.(soil: aggregate:: 75:25)
• With the addition of aggregate to soil, there is an increase in California Bearing Ratio value and henceanincreaseinstrengthcanbeobserved.
• So to obtain a stronger blanketing material, the product obtained as the result of soil aggregate mixing was found to be more effective than soil usedalone.
1.6
From the analysis of load penetration curves of three proportionsthesoil: aggregate::65:35gives themaximum California Bearing Ratio value. Figure gives the comparisonbetweentheloadpenetrationcurves.
• When the amount of adding aggregate increased considerably,itwasfoundtobeuneconomical.
• Hence 35% of the total weight of the mix can be takenastheoptimumamountofaggregate.
• Thesoil:aggregateproportionof65:35alsogives the higher California Bearing Ratio value as well asrequiredCaliforniabearingratiovalue.
Analyzing the above points we are finally arriving at the result that the mix proportion that meets all the criteria fordesigningagoodblanketinglayeris65%soiland35% aggregate. With this desired output we are concluding withtheprojectworks.
[1]Research Design and Standard Organisation (2003)GUIDELINES FOR EARTHWORK IN RAILWAY PROJECTS Guideline No.GE: G 1 (including correction slip no. 1), Publication of Government of India, Ministry of Railway,Lucknow
[2]Research Design and Standard Organisation (2009) Guidelines and Specifications for Design of Formation for Heavy Axle Load RDSO/2007/GE:0014, Publication of GovernmentofIndia,MinistryofRailway,Lucknow
Volume: 09 Issue: 06 | June 2022 www.irjet.net p ISSN: 2395 0072 © 2022, IRJET | Impact Factor value: 7.529 | ISO 9001:2008 Certified Journal | Page 2468
[3] Shri Ashutosh Gupta, Dy C.E.(C), C.R., Shri S.S. Tomar/XEN (C), C.R., Shri Ashok Kumar J.E. (Works) (2015). Laying of Blanket for Nerul/Belapur Seawood UranRailwayProject,IRICEN Journal ofCivil Engineering, Volume8,No.2
[4]Singh,H.(2021).Designofblanketbyaddingdifferent percentagesofsoil.77,459 465. https://doi.org/10.1007/978 981 15 5195 6_36
International Research Journal of Engineering and Technology (IRJET) e ISSN: 2395 0056 Volume: 09 Issue: 06 | June 2022 www.irjet.net p ISSN: 2395 0072 © 2022, IRJET | Impact Factor value: 7.529 | ISO 9001:2008 Certified Journal | Page