ANALYSIS ON INTERDEPENDENCE OF WEATHER PARAMETERS USING SPSS SOFTWARE
1Professor, Department of Civil Engineering, Mar Athanasius College of Engineering, Kothamangalam 2Student, B.Tech Civil Engineering, Mar Athanasius College of Engineering, Kothamangalam 3Student, MSc Statistics, Nirmala College, Muvattupuzha ***
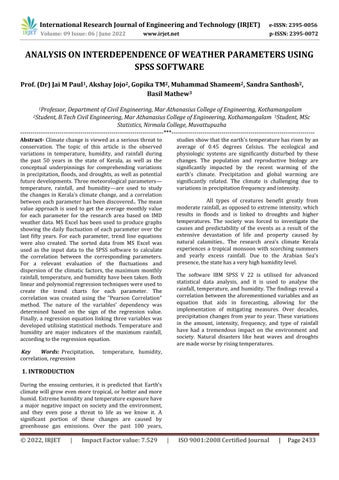
Abstract Climatechangeis viewedasa serious threat to conservation. The topic of this article is the observed variations in temperature, humidity, and rainfall during the past 50 years in the state of Kerala, as well as the conceptual underpinnings for comprehending variations inprecipitation,floods,and droughts,as well aspotential futuredevelopments.Three meteorologicalparameters temperature, rainfall, and humidity are used to study the changes in Kerala's climate change, and a correlation between eachparameterhasbeen discovered. The mean value approach is used to get the average monthly value for each parameter for the research area based on IMD weather data. MS Excel has been used to produce graphs showing the daily fluctuation of each parameter over the last fifty years. For each parameter, trend line equations were also created. The sorted data from MS Excel was used as the input data to the SPSS software to calculate the correlation between the corresponding parameters. For a relevant evaluation of the fluctuations and dispersion of the climatic factors, the maximum monthly rainfall,temperature,andhumidityhavebeentaken.Both linearandpolynomialregressiontechniqueswereusedto create the trend charts for each parameter. The correlation was created using the "Pearson Correlation" method. The nature of the variables' dependency was determined based on the sign of the regression value. Finally, a regression equation linking three variables was developed utilising statistical methods. Temperature and humidity are major indicators of the maximum rainfall, accordingtotheregressionequation.
Words: Precipitation, temperature, humidity, correlation,regression

1. INTRODUCTION
During the ensuing centuries, it is predicted that Earth's climatewill grow even moretropical,or hotter and more humid.Extremehumidityandtemperatureexposurehave a major negative impact on society and the environment, and they even pose a threat to life as we know it. A significant portion of these changes are caused by greenhouse gas emissions. Over the past 100 years,
studiesshowthattheearth'stemperaturehasrisenbyan average of 0.45 degrees Celsius. The ecological and physiologic systems are significantly disturbed by these changes. The population and reproductive biology are significantly impacted by the recent warming of the earth's climate. Precipitation and global warming are significantly related. The climate is challenging due to variationsinprecipitationfrequencyandintensity.
All types of creatures benefit greatly from moderaterainfall,asopposedtoextremeintensity,which results in floods and is linked to droughts and higher temperatures. The society was forced to investigate the causes and predictability of the events as a result of the extensive devastation of life and property caused by natural calamities. The research area's climate Kerala experiences a tropical monsoon with scorching summers and yearly excess rainfall. Due to the Arabian Sea's presence,thestatehasaveryhighhumiditylevel.
The software IBM SPSS V 22 is utilised for advanced statistical data analysis, and it is used to analyse the rainfall, temperature, and humidity. The findings reveal a correlationbetweentheaforementionedvariablesand an equation that aids in forecasting, allowing for the implementation of mitigating measures. Over decades, precipitation changes from year to year. These variations in the amount, intensity, frequency, and type of rainfall have had a tremendous impact on the environment and society. Natural disasters like heat waves and droughts aremadeworsebyrisingtemperatures
© 2022, IRJET | Impact Factor value: 7.529 | ISO 9001:2008 Certified Journal | Page2433
International Research Journal of Engineering and Technology (IRJET) e ISSN: 2395 0056 Volume: 09 Issue: 06 | June 2022 www.irjet.net p ISSN: 2395 0072
Prof. (Dr) Jai M Paul1, Akshay Jojo2, Gopika TM2, Muhammad Shameem2, Sandra Santhosh2 , Basil Mathew3
Key
Volume: 09 Issue: 06 | June 2022 www.irjet.net p ISSN: 2395 0072
Design Methodology
3. Study Area
Kerala, an Indian state on the southwest coast, is the subject of the study. Except for the Thiruvananthapuram district, where the climate is tropical savanna with seasonally dry and hot summer weather, Kerala has a tropical monsoon climate withseasonal excessive rainfall and scorching summers. For climatological purposes, the entire state is categorised as a single meteorological sub division.Fourseasonscanbeused tocategorisetheyear. The hot season lasts from March to the end of May. The SouthwestMonsoonseasonthenbeginsandlaststhrough early October. The Northeast Monsoon season runs from October to December, while the months of January and February are winter months.. From September through February, the weather is pleasant. Due to the high temperaturesandhumidity,thesummermonthsofMarch through May are miserable. Due to the Arabian Sea's presence to its west, the state experiences exceptionally highhumiditylevels.
Humidity: Relative humidity is often high over the State because it runs from north to south and has the Arabian Seatoitswest.BetweenJanuaryandMarch,theafternoon humiditydropsto60to63percent,rangingfrom35to71 percent along the shore. Depending on how close the sea is, the highest daily variation in relative humidity during this time is from 4 to 16 percent. During the monsoon season, the state's relative humidity increases to roughly 85%.Thistimeperiod'sfluctuationisminimal.
Temperature: Except during the monsoon season, when they decrease by roughly 3 to 5°C, daytime temperatures over the plains remain essentially constant throughout the year. Over the plateau and at high altitude stations, temperatures are lower during the day and at night than overtheplain.Daytimetemperaturesareloweralongthe coast than they are inland. With a mean maximum temperatureofroughly33°C,Marchisthehottestmonth. When there is a lot of rain and clouds in the sky in July, the mean maximum temperature is at its lowest. The
average temperature for the entire state in July is 28.5°C, rangingfromaround28°Cinthenorthtoroughly29°Cin the south. Beginning in May, both the maximum and lowest temperatures begin to drop, the latter quite quicklyandtheformergradually
Rainfall: The State receives an average of 180 cm of rainfall in the south and 360 cm across its northernmost regions.TheStatereceivesover70%ofitsannualrainfall duringthesouthwestmonsoon,whichoccursfromJuneto October. From 83 percent in the northernmost district of Kasaragode to 50 percent in the southernmost district of Thiruvananthapuram,monsoonrainfallasaproportionof annual rainfall declines from north to south. Northeast monsoon rainfall increases from north to south as a percentage of annual rainfall, ranging from 9% in Kasaragode,inthenorth,to27%inThiruvananthapuram, inthe south. Asthe height ofthe Western Ghatsdeclines, sodoestheamount ofrainfall intheState.Byaround the first of June, the southwest monsoon begins to cover the State's southern regions, and by the fifth of June, it has covered the entire State. The rainy season are June and July,whichtogetheraccountforaround23%oftheyearly rainfall. Distribution of Kerala's average and actual monthlyrainfallduringthepasttenyears.
4. Data
Thepastfiftyyearsrainfall,temperature,humiditydata collectedfromINDIANMETEOROLOGICALDEPARTMENT (IMD). The data includes rainfall, temperature, humidity readingsfromfourteenstationswithinKerala.
Table:4.1 Datawascollectedfromthefollowing weatherstations
International Research Journal of Engineering and Technology (IRJET) e ISSN: 2395 0056
© 2022, IRJET | Impact Factor value: 7.529 | ISO 9001:2008 Certified Journal | Page2434 2.
Thiruvananthapuram
43371 ThiruvananthapuramAirport 43372 Punalur 43354 Alappuzha 43352 Kottayam 43355 KochiAirport 43353 CIALKochi 43336 Vellanikkara 43357 Palakkad 43335 KaripurAirport 43320 KozhikodeCity 43314 Kannur 43315
Station Index Number
City
Volume: 09 Issue: 06 | June 2022 www.irjet.net p ISSN: 2395 0072
5. Data Analysis
5.1 Data Analysis Using MS Excel
The average value of relative humidity, maximum temperature, rainfall from fourteen different weather stations across Kerala was found out and this average value was analysed. Scatter graphs were plotted each parameter with time (number of days) on X axis and weatherparametersonYaxis.


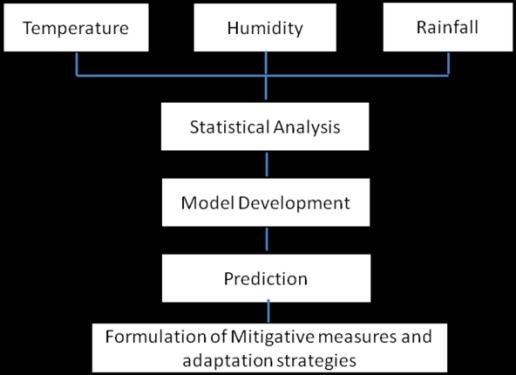
The trend line of rainfall time graph indicates that there were only negligible variations in rainfall in the past fifty years.
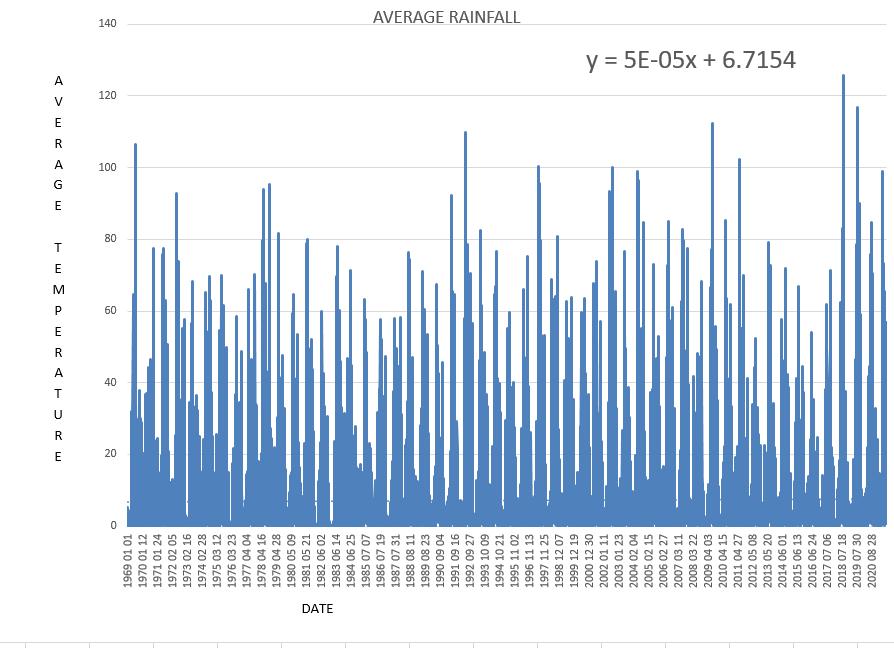
Fig.5.1.1 Relativehumidity timegraph
The trend line of relative humidity time graph indicates that there were only negligible variations in relative humidityinthepastfiftyyears.
Fig 5.1.3 Maximum temperature timegraph
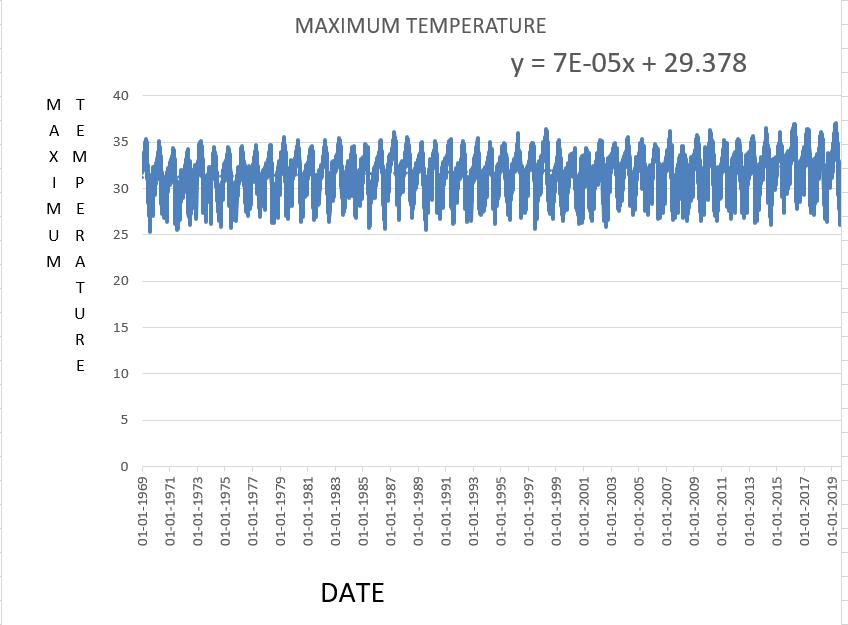
Trendlineofmaximumtemperature timegraphindicates that there is was a gradual increase in maximum temperatureinthepastfiftyyears.
5.2 Data Analysis Using SPSS Software IBM SPSS V 22 SOFTWARE
For advanced statistical data analysis, many different types of researchers utilise SPSS, which stands for Statistical Package for the Social Sciences. It is simple to use and learn. Excellent charting, reporting, and presentation tools are provided by SPSS. Data sorted in MS Excel was applied as input to the SPSS Software. In this project, data was converted to suit our analysis. The given data consists of daily values, so monthly maximum for eachyearwastaken for analysingthe data,otherwise theanalysisbecomesmeaninglessasmostofthevaluesof the variable "AVERAGE RAINFALL" is zero. The data also contain missing values which can be compensated by fillingthosevalueswiththepreviousvaluesinthedata.In this way, new dataset was prepared for SPSS analysis. Tools used for the analysis constitute linear regression, polynomialregressionandmultipleregressions.
Fig 5.1.2 Rainfall timegraph
International Research Journal of Engineering and Technology (IRJET) e ISSN: 2395 0056
© 2022, IRJET | Impact Factor value: 7.529 | ISO 9001:2008 Certified Journal | Page2435
International Research Journal of Engineering and Technology (IRJET) e ISSN: 2395 0056
Volume: 09 Issue: 06 | June 2022 www.irjet.net p ISSN: 2395 0072
5.3 INTERPRETATIONS
CORRELATIONBETWEENTHEVARIABLES
Table 5.3.1 Correlationbetweenthevariables
Parameter
Variables Rainfall Humidity Temperature
Rainfall Pearson Correlation 1 0.799 0.422
Sig.(2 tailed) 0.000 .000
N 632 624 632
Humidity Pearson Correlation 0.799 1 0.596 Sig.(2 tailed) 0.000 0.000 N 324 624 624
Temperature Pearson Correlation 0.422 0.596 1
Sig.(2 tailed) 0.000 0.000 N 632 624 632
ANOVA Table
Here the significance value is 0.000 which is less than 0.05. Hence, we can conclude that there is a significant impact of relative humidity on average rainfall. The regressionequationis,��=1.63��2−5.24��+0.04.
Fig
5.3.3
Scatterplotbetweenrainfallandhumidity
Model Summary Table
MultipleR value 0.799whichisthecorrelation between relative humidity and average rainfall. This shows a positivecorrelationbetweenthevariables.RSquarevalue 0.666 which means that 66.6% change in average rainfallcanbeaccountedbyrelativehumidity.
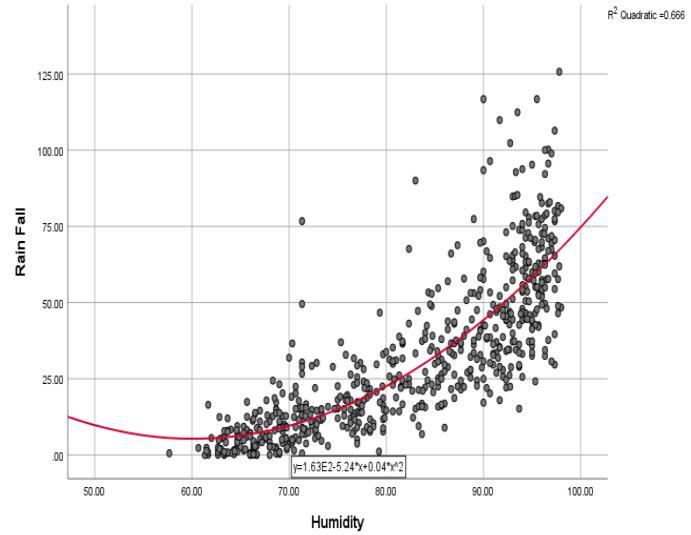
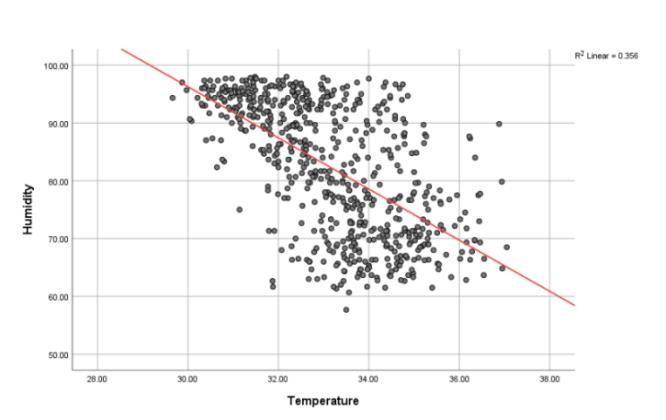
Fig 5.3.2 Scatter plot between temperature and humidity
Model Summary Table
MultipleR value 0.596whichisthecorrelation between temperatureandrelativehumidity.Thisshowsanegative correlation betweenthevariables.R Squarevalue 0.356 which means that 35.6% change in temperature can be accounted by relative humidity. The regression equation is, ��=2.29��2−4.42.
ANOVA Table
Herethesignificantvalueis0.000whichislessthan0.05. Hence,wecanconcludethatthereisasignificantimpact oftemperatureonhumidity
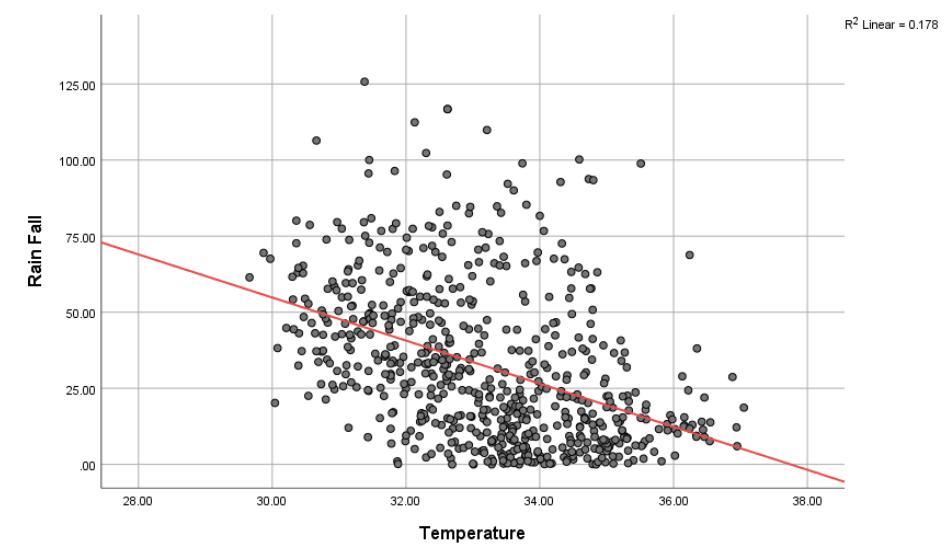
Fig 5.3.3 Scatterplotbetweentemperatureandrainfall
© 2022, IRJET | Impact Factor value: 7.529 | ISO 9001:2008 Certified Journal | Page2436
Volume: 09 Issue: 06 | June 2022 www.irjet.net p ISSN: 2395 0072
Model Summary Table
MultipleR value 0.422whichisthecorrelation between temperature and average rainfall. This shows a negative correlation betweenthevariables.R Squarevalue 0.178 which means that 17.8% change in temperature can be accountedbyrelativehumidity.
Theregressionequationis,��=2.67��2−7.08��
ANOVA Table
Here the significance value is 0.000 which is less than 0.05. Hence, we can conclude that there is a significant impactoftemperatureonaveragerainfall
6. RESULT AND MODELLING
To formulate an equation connecting temperature, humidity and rainfall based on statistical data. The regressionequationconnectingthesethreevariablesis, �� = − 164. 354 + 1. 900ℎ + 1. 214 where �� is the average rainfall, ℎ is the relative humidity and �� is the maximum temperature.
Model Summary Table
R Square value 0.642, which means that the predictors relativehumidityandmaximumtemperatureaccountsfor 64.2%ofthevarianceinaveragerainfall.
ANOVA Table
Herethep valueisequalto0.000whichislessthan0.05. Therefore, we can say that the regression model is significant.Here,(3,621)=557.111
Coefficients Table
Here,wearecheckingthep valueofthepredictors.Thep value of the coefficient humidity is 0.000 which is less than 0.05 as well as the p value of temperature is 0.016 which is also less than 0.05. Therefore, we can say both humidity and temperature are significant predictors for averagerainfall.
6.1 Validation
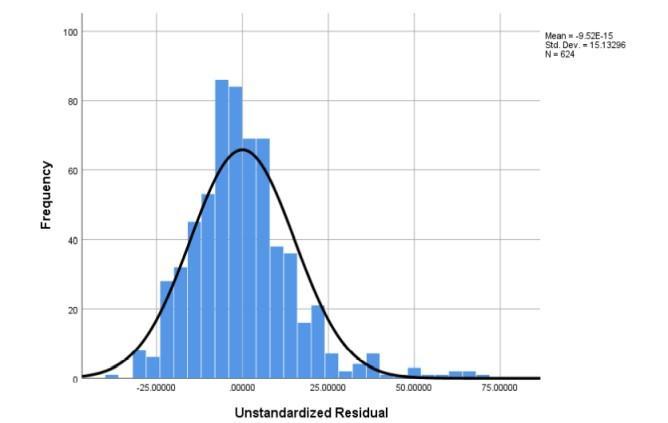
Fig 6.1.1 Histogramofresiduals
From this histogram we can conclude that the residual values are concentrated near 0 more than expected. The graph shows a strict decline in frequency as the residual value changes from 0 which means that the predicted valuesareextremelygood
, T., Smale, D.A. and Thomsen, M.S., 2012. A decade of climatechange experiments onmarine Therefore, wecan saythattheequationbestfitsthedata.
Table 6.1.1 Validationofaveragerainfall
YEAR MONTHS AVG RAINFALL (OBSERVED)
AVG RAINFALL (PREDICTED)
1969 6 57.43 56.06198
1974 6 17.16 45.24608
1979 6 81.68 62.4762
1984 6 71.26 53.2293
1989 6 71.09 58.46392
1994 6 66.93 57.29841
1999 6 62.72 57.27166
2004 6 96.42 46.54321
2009 6 66.47 52.97437
2014 6 42.41 48.50711
2019 6 46.41 53.5241
2020 6 44.57 55.33695
International Research Journal of Engineering and Technology (IRJET) e ISSN: 2395 0056
© 2022, IRJET | Impact Factor value: 7.529 | ISO 9001:2008 Certified Journal | Page2437
International Research Journal of Engineering and Technology (IRJET) e ISSN: 2395 0056
Volume: 09 Issue: 06 | June 2022 www.irjet.net p ISSN: 2395 0072
CONCLUSION
In this study we were able to establish a correlation between temperature, humidity and rainfall. Here, Trend line graph helps to analyse the future temperature variation. From this analysis it was found out that significantvalueofcoefficienthumidityis0.00andthatof temperature is 0.016 both are less than 0.05, so we conclude that both humidity and temperature are the significant predictors of average rainfall. After validating the equation, it found out that it is 85% accurate, so we canusethisequationforfurtherprediction.
REFERENCES
[1] Wern berg organisms: procedures, patterns and problems. Global Change Biology, 18(5), pp.1491 1498..
[2] Barreca, A.I., 2012. Climate change, humidity, and mortality in the United States. Journal of Environmental Economics and Management, 63(1), pp.19 34.
[3] McCarty,J.P.,2001.Ecologicalconsequencesofrecent climate change. Conservation biology, 15(2), pp.320 331
[4] Cong, R.G. and Brady, M., 2012. The interdependence between rainfall and temperature: copula analyses TheScientificWorldJournal,2012.
[5] Sreenath, A.V., Abhilash, S., Vijaykumar, P.et al.West coastIndia’srainfallisbecomingmoreconvective.npj ClimAtmosSci 5, 362022
© 2022, IRJET |
7.529 | ISO 9001:2008 Certified Journal | Page2438
Impact Factor value: