International Research Journal of Engineering and Technology (IRJET) e ISSN: 2395 0056

Volume: 09 Issue: 06 | Jun 2022 www.irjet.net p ISSN: 2395 0072

International Research Journal of Engineering and Technology (IRJET) e ISSN: 2395 0056
Volume: 09 Issue: 06 | Jun 2022 www.irjet.net p ISSN: 2395 0072
Dr. Bindiya M K1, Abhijna S2, Abhishek Rawat3, Anushri N R4, Indudhar L Gowda5
1Associate Professor, Department of Computer Science and Engineering, SJB Institute of Technology 2,3,4,5Student, Department of Computer Science and Engineering, SJB Institute of Technology ***
Abstract - Each year, a huge number of students apply to post graduate programs allover the worldinorder toadvance their careers. In this project, we focus on the students applying for Masters programs in universities abroad, particularly the universities in the United States of America. Here, we present a new universityadmissionpredictionsystem using machine learning algorithms by recognizingthe factors that affect the likelihood of admission. We use severalmachine learning algorithms to statistically analyze the admission predictability of such factors. The objective is to predict the list of universities that a student might get into rather than the chance of admit.
Key Words: Post-graduate admission prediction, Machine Learning, Masters programs, PCA, MLR, SVM
Applying to universities abroad is often difficult. Studentsfindithardtoestimateexactlywheretheystand.It involvesmanystepsandprocedurestofollow.Researching the universities and programs is itself an arduous and lengthy task. Choosing the right universities to apply to is definitely a hurdle students have to face. Many students applyfortheuniversitiesinwhichtheyhaveaslimchanceof acceptance.Universityapplicationsalonecancosthundreds of dollars. This can take a toll on the finances of students comingfromapooreconomicbackground.Studentshaveto throwawaylotsofhard earnedmoneyfornothingiftheyget rejectedbytheseuniversities.
In this project, we will be using the admission_predict dataset in CSV format to predict the universities that a student might get into based on several academic performancemeasurements.
Parametersthathelppredicttheuniversities:
1. GREScores(outof340)
2. TOEFLScores(outof120)
3. UniversityRating(outof5)
4. StatementofPurposeandLetterof RecommendationStrength(outof5)
5. UndergraduateGPA(outof10)
6. ResearchExperience(either0or1)
Thisprojectwillbeimplementedusingseveralmachine learning algorithms, Python programming language and Flaskwebframework.Toyieldthemostaccurateresult,we will be going through several steps such as data pre processing,exploratorydataanalysis,featureselection,cross validation,modelselection,trainingthemodelandsoon.
Asubstantialnumberofresearchprogramshavebeen carriedoutonsubjectsrelatedtouniversityadmissions.Each onehasuseddatasetsfromvarioussourcesandisspecificto acertaincourseoruniversity.Hence,thepredictionmaynot beaccurateforeverystudent.
Previousstudiesdoneinthisareaevaluatedthechance ofstudentadmissionintorespectiveuniversitiesprimarily basedonasingleparameter theGREscore.Thedownsideis thattheyonlyconsideredtheGREscoreandleftoutallthe otherfactorsthatmightcontributetoadmissionprediction.
Our base research paper has considered all these parameters, but the machine learning model has low accuracy.Anotherconisthatthedatasetusedisspecificto Indianstudentsandisnotgeneralized.
Themaindrawbackofallthepreviousresearchcarried out is that it only predicts the chance of admission of a student.Abettersystemwouldpredicttheuniversitiesthata studentmightgetinto,ratherthanthechanceofadmission. Inthisway,astudentwouldbeabletoapplytouniversities wheretheyhaveabetterchanceatgettingadmission.
Problem Understanding: Wefirstneedtounderstandthe problemsfacedbystudentsduringtheuniversityapplication processandfigureoutwaystoovercomethem.Precisegoals must be set. A clear path to achieve the set goals must be apparent.
Data Understanding: Weneedtounderstandthetrendsin eachdatasetandconsiderthemostdiverseoneinorderto getageneralizedmodelthatcanbeusefulforeverystudent. Exploratorydataanalysisisperformedforthesame.During thisphase, wewill alsoget a deeperunderstandingof the data and will be able to estimate which machine learning modelmightgivegoodresults.
International Research Journal of Engineering and Technology (IRJET) e ISSN: 2395 0056
Volume: 09 Issue: 06 | Jun 2022 www.irjet.net p ISSN: 2395 0072
Data Preparation: Data should be cleaned for it to be suitableforthemachinelearningalgorithm.Inordertodo this,weneedtoperformdatapre processingsteps.Here,we willbesplittingthedatasetintoXandYcolumns,checking foranymissingvalues,categoricalvalues,outliersandsoon anddealingwiththeminaneffectivemanner.[4]
Building Models: WeneedtoexperimentwithvariousML modelsinordertoidentifythebestfitforourdataset.
Evaluation: Inthisstep,weanalyzehowwellthemodelfits our data. We check for any chances of overfitting or underfittingofthedata.Wealsostriveforagoodaccuracy andmakesuretheerrorrateisminimal.
Creation of an interface: After modeling the right ML algorithmwemoveontocreationofawebsite.Wewill be usingFlaskasa webframework withHTML forstructure, CSSforstyling,JavaScriptforinteractivity,andBootstrapfor aresponsivewebsiteandSQLiteforbackend.[5]
interpretabilityandatthesametime,minimizesthelossof information. PCA is an unsupervised algorithm and most commonlyusedasadimensionalityreductionalgorithm.
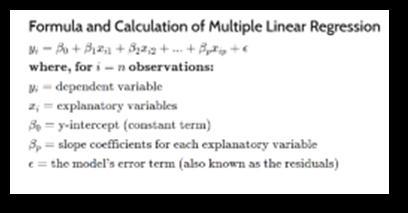
MultipleLinearregressionisastatisticaltechniquethatis used to model the linear relationship between several explanatoryvariablesandoneresponsevariable.
We first import all the required libraries, and the dataset. Data preprocessing in order to make the data suitable for machinelearningmodels.ExploratoryDataAnalysis(EDA)is done on the dataset in order to understand the data and applyappropriatemodels.FeatureScalingisperformedon the independent variables of the dataset to bring every featuretothesamefooting,withoutanyupfrontimportance of one over the other. PCA is then performed on the standardizeddata.Here,wehaveoptedforthreefeaturesas thatexplainsover85%ofthevarianceinthedata
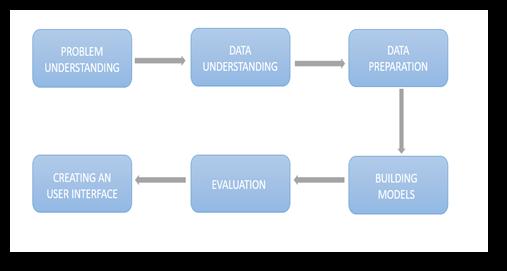
Fig 1: Methodology
Thedataisthensplitintotrainandtestsets.Duetosample variabilitybetweenthetrainandtestsets,machinelearning modelsmaygiveabetterpredictiononthetrainingdata,but failtogeneralizeoverthetestdata.Thisleadstoahightest error.Inordertoavoidsuchasituation,wehaveoptedforK fold Cross Validation. This method gave us an accuracy of 0.8949.UsingtheK foldCrossValidationmethodincreased theaccuracyofthemodelbyover12%.
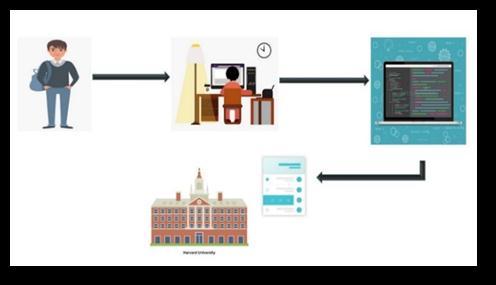
Fig – 2: User’sperspectiveoftheworkflow
Large datasets are increasingly common in Machine Learning. While a large dataset is necessary for a good model, this introduces a great deal of complexity and difficultyininterpretation.PrincipalComponentAnalysisisa technique that is popularly used for reducing the dimensionality of such datasets. It helps in increasing
Random Forest Regression (RFR) is another popular machine learning algorithm that uses the concept of ensemblelearning.RandomForestisasupervisedlearning method that can be used for classification as well as
International Research Journal of Engineering and Technology (IRJET) e ISSN: 2395 0056
Volume: 09 Issue: 06 | Jun 2022 www.irjet.net p ISSN: 2395 0072
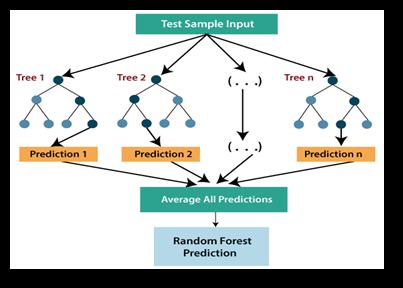
regressionproblems.RandomForestcontainsanumberof decision treeson varioussubsetsofthegiven datasetand takes the average of the results to improve the predictive accuracy of the dataset. An upside to this model is that it preventstheproblemofoverfitting.
Inthismodel,wefollowedaslightlydifferentapproachthat transforms the regression problem that we have, into a classification one. The approach here is to have a binary column called ‘Status’ that takes the value True for applicantsthathavemorethan83%ofchanceofadmit.This valuewastakenasthethresholdafteracarefulstudyofthe datadistribution.
Thisapproachgaveus anaccuracyof96%.Theconfusion matrixrevealedthat3out100studentsthatwererejected werepredictedasadmittedand1outof100ofstudentsthat wereadmittedwerepredictedasrejected.
rejected were predicted as admitted and 2 out of 100 of studentsthatwereadmittedwerepredictedasrejected.
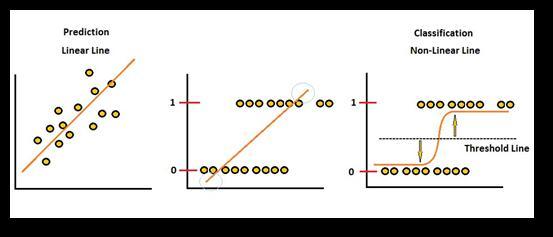
LogisticRegressionisasupervisedlearningtechniquethatis usedtopredictacategoricaldependentvariableusingaset ofindependentvariables.Thedependentvariableisabinary value,butinsteadofgivingtheexactbinaryvalues,itgives theprobabilisticvaluesthatliesbetween0and1.Logistic regressionandlinearregressionarequitesimilar.Inlogistic regression, instead of fitting a regression line, we fit an S shaped curve or a logistic function. The curve from the logisticfunctionindicatesthelikelihoodofsomething,such asthechancesofastudentgettingadmissioninaparticular university.
Theclassificationapproachdiscussedearlierisusedhereas well.Thisgaveusanaccuracyof97%.Theconfusionmatrix revealed that 2 out 100 students that were rejected were predictedasadmittedand1outof100ofstudentsthatwere admittedwerepredictedasrejected.
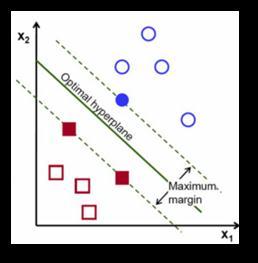
SupportVectorMachineisasupervisedlearningalgorithm that can be used for classification as well as regression. Althoughitcanbeusedforregression,itisbestsuitedfor classification problems. The objective of SVM is to find a hyperplane in an N dimensional space that distinctly classifiesthedatapoints.Thedimensionofthishyperplane dependsonthenumberoffeatures.
Thisisthe bestaccuracythatwecouldachieve.Itgave us satisfactoryresults.
We initially set out to collect data so as to predict the universitiesinsteadofthechanceofadmit.Duetoalackof enough data, we decided to map the chance of admit predictedinthecurrentdatasettouniversities.Todoso,we collected the cut off GRE and TOEFL scores of several universitiesandusedthisdatasetformappingpurposes.
The universities thus obtained are then categorized as ‘Dream Universities’, ‘Safe Universities’ and ‘Backup Universities’. The students can divide their resources and applyforacombinationoftheseuniversities.
Here,we’veusedthesameclassificationapproachdiscussed earlier. This gave us an accuracy of 96% as well. The confusionmatrixrevealedthat2out100studentsthatwere
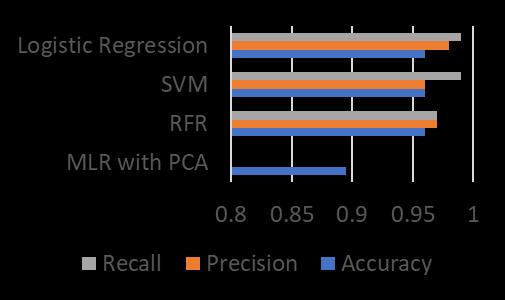
As demonstrated in the previous section. The logistic regressionmodelgavethebestresults,followedbySVMand RFR,thenMLRwithPCA.
The central concept of this application is to allow the students to predict the universities that they can get
International Research Journal of Engineering and Technology (IRJET) e ISSN: 2395 0056
Volume: 09 Issue: 06 | Jun 2022 www.irjet.net p ISSN: 2395 0072
admission into. This allows the student to manage their funds and save money during the university application process,byonlyapplyingtothoseuniversitiesthattheyhave a highchanceofgettinginto.Awebsitewascreatedusing HTML,CSS,Bootstrapforfrontend,andSQLitefordatabase. Flaskwasusedasawebframework.
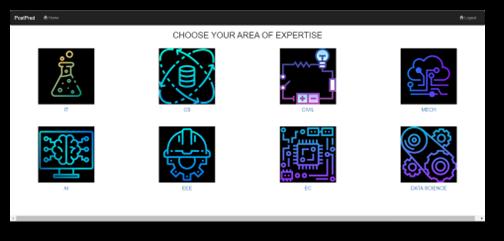
Fig 11showsthe expertisepage. Thispageletstheuser enterhis/herareaofexpertise.Oncetheselectionisdone, theuserisredirectedtoapredictionpage.

Fig 9showsthehomepageofourwebsite,PostPred.Thisis thepagethattheuserencountersonceheopensthewebsite.
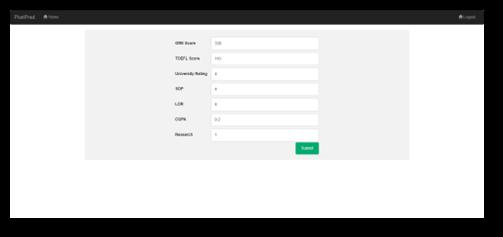
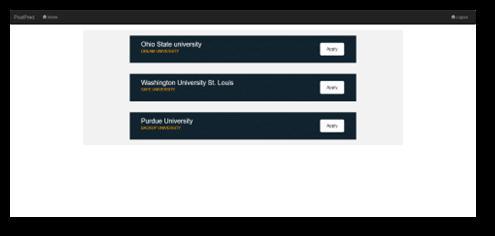
The page shown in Fig 13 shows the prediction results basedonthepreviousscores.Theresultsarepredictedby the Machine Learning model. The universities are characterized as Dream University, Safe University and BackupUniversity.
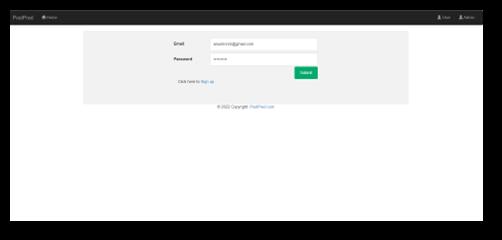
Fig 10showstheuserloginpage.Theusercanentertheir emailIDandpasswordinordertoaccesstheiraccount.Ifthe userdoesn’talreadyhaveanaccount,he/shecancreateone usingtheSignUpbuttonbelow.
Fig
International Research Journal of Engineering and Technology (IRJET) e ISSN: 2395 0056
Volume: 09 Issue: 06 | Jun 2022 www.irjet.net p ISSN: 2395 0072
Fig 14 shows the application page of Purdue University. The user is redirected to the application of the respective universitieswhenhe/sheclicksontheapplybuttonnextto theuniversityasshowninFig 13.
The central concept of this application is to allow the students to predict the universities that they can get admission into. This allows the student to manage their funds and save money during the university application process,byonlyapplyingtothoseuniversitiesthattheyhave ahighchanceofgettinginto.
We’veusedmultiplemachinelearningmodelsforprediction ofthesame.Thebestonei.e.,LogisticRegressionisusedasa pickle file and used in the Flask web framework. A user friendlyinterfaceisthusprovidedtomaketheprocesseasier forusersfromanon technicalbackground.
[1] “Prediction fora University Admission Using Machine Learning”byChitraApoorvaD.A,MalepatiChanduNath, Peta Rohith, Swaroop S, Bindushree S Blue Eyes Intelligence Engineering & Sciences Publication. International Journal of Recent Technology and Engineering(IJRTE)ISSN:2277 3878,Volume 8,Issue 6 March2020.
[2] “MachineLearningBasicswiththeK NearestNeighbors Algorithm” https://towardsdatascience.com/machine learning basics with the k nearest neighbors algorithm
[3] “Random Forest Regression” https://www.kaggle.com/dansbecker/random forests
[4] “Data pre processing & Machine Learning” https://archieve.ics.uci.edu/ml/index.php
[5] “User Interface Design” https://pidoco.com/en/help/ux/user interface design
[6] “Graduate Admission Prediction Using Machine Learning”bySaraAljasmi,AliBouNassif,IsmailShahin, Ashraf Elnagar ResearchGate Publication, December 2020.
[7] Sujay S “Supervised Machine Learning Modelling & AnalysisForGraduateAdmissionPrediction”Published in International Journal of Trend in Research and Development (IJTRD), ISSN: 2394 9333, Volume 7 | Issue 4,August2020.
2022, IRJET | Impact Factor value: 7.529 | ISO 9001:2008 Certified