International Research Journal of Engineering and Technology (IRJET) e-ISSN: 2395-0056

Volume: 09 Issue: 06 | June 2022 www.irjet.net p-ISSN: 2395-0072
International Research Journal of Engineering and Technology (IRJET) e-ISSN: 2395-0056
Volume: 09 Issue: 06 | June 2022 www.irjet.net p-ISSN: 2395-0072
1Assistant Professor, Department of Civil Engineering, Viswajyothi college of Engineering and Technology, Vazhakulam Kerala, India
2,3,4,5UG Scholar, Department of Civil Engineering, Viswajyothi college of Engineering and Technology, Vazhakulam Kerala, India ***
Abstract Urban traffic congestion has been identified has a big problem in the country, having a considerable impact on the economy, travel behaviour, land use and causing pain to millions of motorists. In India, due to rapid increase in population along with urbanization and improved living condition, the vehicular population have increased massively. Traffic congestion has become a major problem at intersections. The project main goal is to analyse traffic problems at the Perumbavoor crossroad and provide a different solution. In this study, we have taken signalized intersection at Perumbavoor. After analysis and structures. According to IRC: SP: 90 2010, manual for grade separators and elevated structures the maximum volume a rotary can handle is specified as 5000 pcu/hr Therefore, a simple grade separator, that is, a flyover is provided at the intersection over the road having greater traffic volume count. A large amount of traffic volume may be shifted to the bridges as a result of the flyover bridge at the intersection, and time delays could be minimised over the same time frame.
Key Words: Urbanization, Traffic congestion, Alternative solution.
Inthispaper,trafficcongestionsareevaluatedatselectedintersectionsanddataregardingthetrafficvolumearecollected manually. Following the analysis of the acquired data, several remedial procedures concentrating on junction improvementandalternativeplansarepresented.Despiteofhugeinvestmenttobelaid,congestioncouldbereducedtoa certainextentbyprovidingsignalizedtrafficjunctions,providingroundabouts,flyoversandinterchanges,etc
The projects’ main goal is to analyse the traffic problems at the Perumbavoor crossroads and provide a solution that includes grade separator and elevated. Collected data various remedial measures are proposed focusing on junction alternativeandimprovementoperationplan.Despiteofthehugeinvestmenttobelaid,congestionscouldbereducedtoa certainextentbyprovidingsignalizedtrafficjunctions,providingroundabouts,flyovers,interchanges,etc
• Todeterminethecapacityofapproachroadsofintersections.
• Toestimatethedelayandcapacityofintersection.
• ToevaluatetheperformanceofsignalizedintersectionatPerumbavoor.
• Tosuggestsomemethodsforimprovingtheperformanceofintersection.
• Toplananddevelopcurrentandnewtrafficoperationfacilitiesontheroad.
• Toachieveefficientandrapidflowoftrafficatintersection.
• Toincreasetrafficcapacityofroads.
• Toreducethedelaysinroadjourneysandimprovespeedofthevehicle.
International Research Journal of Engineering and Technology (IRJET) e ISSN: 2395 0056
Volume: 09 Issue: 06 | June 2022 www.irjet.net p ISSN: 2395 0072
Themethodologyconsists of6steps,fromselectingtheintersectiontoprovidinglayoutofthealternativesolution.After choosing the right approach road at intersection based on the analysis on the tabulated data, field measurements are takenforthesameintersection.Thenanalternativesolutionissuggestedforreducingthetrafficcongestion.
Chart 1 FlowChart
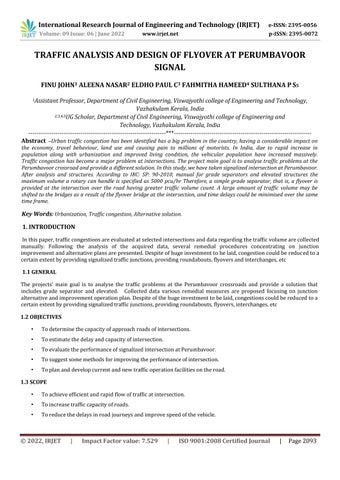
The selection of the research area is the initial step in research process. The study’s location determines the research activities that must be carried out in light of current traffic behaviour and transportation frame work. In this study, an existingroadjunctionisstudiedandanalysedbyusingvolumecountsurvey.Someimplementationwillresultfromdata analysisinordertoimprovetheroad’scondition.Itwillhaveagoodeffectontheinhabitantsintheareaaswellasother road users. This research will aid in minimising traffic flow issues, hence lowering the rate of accidents and lowering pollution levels. During peak hours, data for this study was obtained from perumbavoor’s signalized intersection. The traffic is extremely diverse, with little adherence to lane discipline. Figure shows the aerial view of the signalised intersectionselectedforthestudy.ItistheintersectionofAluva Munnarroad(SH16)andMCroad(SH1).
Volume: 09 Issue: 06 | June 2022 www.irjet.net p ISSN: 2395 0072
Chart 2 AerialmapofintersectionatPerumbavoor
There are mainly 2 categories in traffic counting, they are manual counts and automatic counts. The manual counting method is used in this investigation, and is done with tally marks. Following that the raw data from the inventories is organised for analysis. The traffic on each arm is counted and recorded separately for each movement. Automatic counting is an alternate method that employs a number of equipment each with its own set of the most widely used instruments include pneumatic tubes, inductive loops, weigh in motion sensors, micro millimetres, and video cameras. Here the method adopted is manual counting of different category of vehicles, since it is a direct and easy method involvingnoexpensiveequipment.
ThePassengerCarUnit(PCU)isa relative weightagefactorusedtothetrafficvolumeofindividualvehiclecategoriesto accountforvariabilityinamixedtrafficenvironment.Tofar,alargenumberofstudieshavebeenundertakentoestimate PCUforvariousvehicleclassifications.Thenatureoftrafficflowisoftenheterogeneous.Thedegreeofheterogeneity,on theotherhand,variesdependingonthesituation.Itisusuallymorefordevelopingcountries,forexample.Becauseofthis diversity, traffic studies are frequently required. The Passenger Car Unit (PCU) is a widely used method for converting diverse traffic volumes into homogenous traffic volumes. The measure of relative interaction between a vehicle and a trafficstreamincontrasttoanormalpassengerautomobileunderasetofroadwaycircumstances,accordingtothePCU.
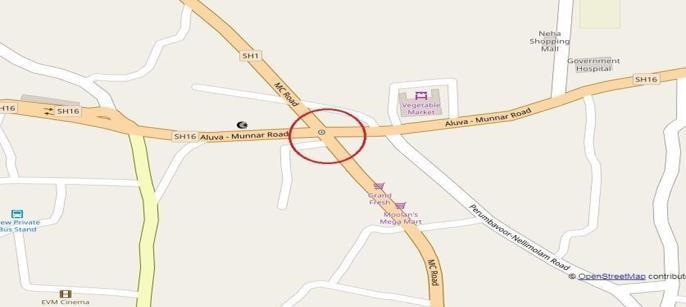
Table 1 TotalvehicularcountinPCUUnit
FROM TO DAY 1 TOTAL IN PCU 9:30 10:30 AM
DAY 1 TOTAL IN PCU 4:30 5:30 PM
DAY 2 TOTAL IN PCU 9:30 10:30 AM
DAY 2 TOTAL IN PCU 4:30 5:30 PM
Muvattu puzha Aluva 610 750 634 772 Angamaly 883 1095 876 1111 Kotha mangalam 539 778 550 741 Angamaly Muvattu puzha 964 1127 932 1173 Aluva 630 870 649 934 Kotha mangalam 623 741 635 731 Aluva Muvattupuzha 682 681 697 832 Angamaly 817 913 834 887 Kotha mangalam 665 718 689 744 Kotha mangalam Muvattu puzha 596 866 608 870 Angamaly 760 861 773 790 Aluva 504 807 510 813
TOTAL 8273 10215 8387 10398
International Research Journal of Engineering and Technology (IRJET) e ISSN: 2395 0056
Volume: 09 Issue: 06 | June 2022 www.irjet.net p ISSN: 2395 0072
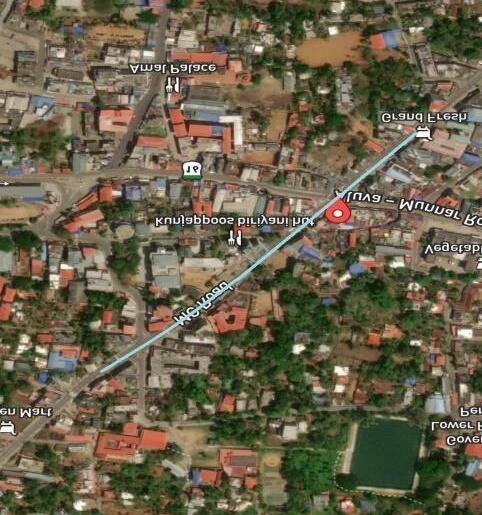
Field measurements of Perumbavoor intersection was taken using total station. On 2nd April 2022 we had surveyed nearby junction of Perumbavoor signal that is Oushadhi junction and on 5th April 2022 we had surveyed Perumbavoor intersection.
Chart 3 JoinedlineddiagramofexistingroadproducedfromAutoCAD
AfteranalysingthePerumbavoorintersectionitisclearthatMuvattupuzha Angamaliroadhaspeakvaluesthatis around 1000 PCU/Hr. From the capacity calculations made from field data it is evident that this intersection would fail to cater to the future traffic demands. The traffic volume that a roundabout can handle efficiently is 3000 PCU/hr, according to IRC: 65 2017, Guidelines for planning and design of roundabouts. The maximum volumearotarycanhandleissetas5000PCU/hrinIRC:SP:90 2010,Manualforgradeseparatorsandelevated structures, and an elevated structure could be provided beyond this limit. A simple grade separator, such as a flyover,wouldbethemostpracticaloptiontoseparatethehugevolumeoftrafficatthiscrossroads.Whiletraffic ontheroadgrowseverydayandthereisnomorespaceinbothdimensions,theonlyalternativeleftistoproceed tothethirddimension,whichisaccomplishedentirelybyflyoverconstruction.
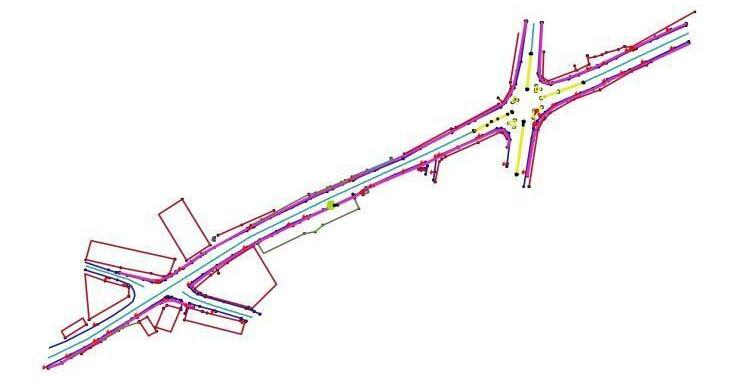
2DlayoutoftheflyoverisplottedinAutoCADconsideringtheexistingmeasurements.Themedianofexistingand theproposedlayoutarekeptthesameandlanesareoffsetfromthemediantoboththesides.
Chart 4 2DLayout
International Research Journal of Engineering and Technology (IRJET) e ISSN: 2395 0056
Volume: 09 Issue: 06 | June 2022 www.irjet.net p ISSN: 2395 0072
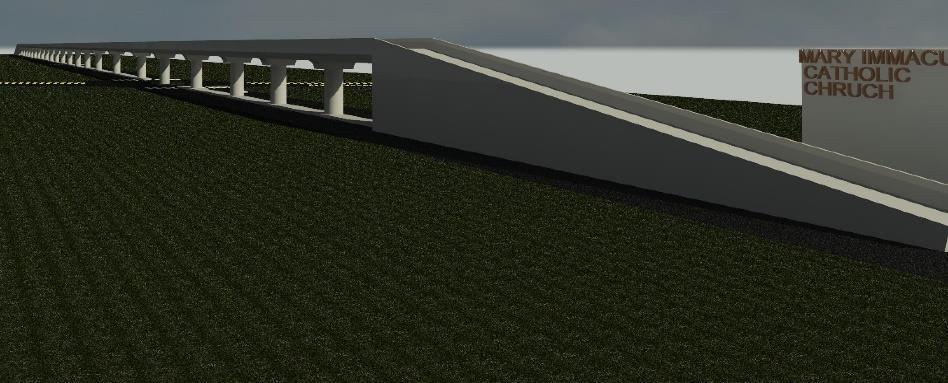
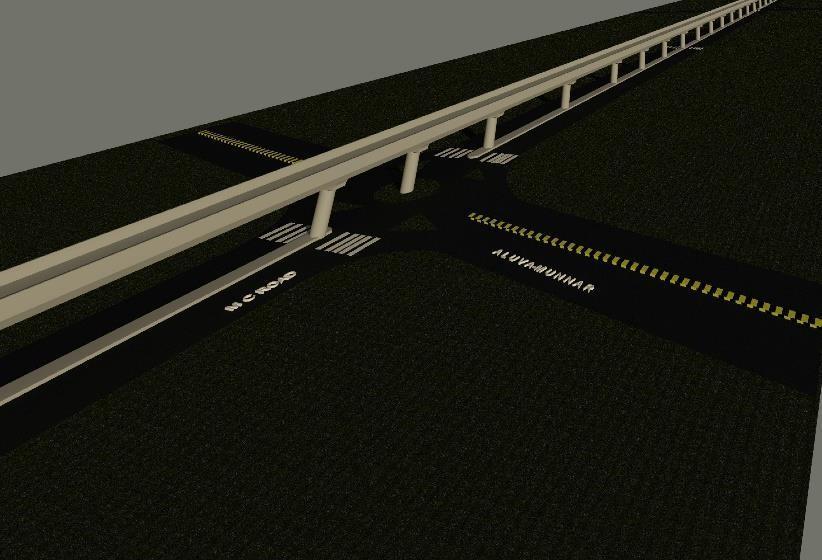
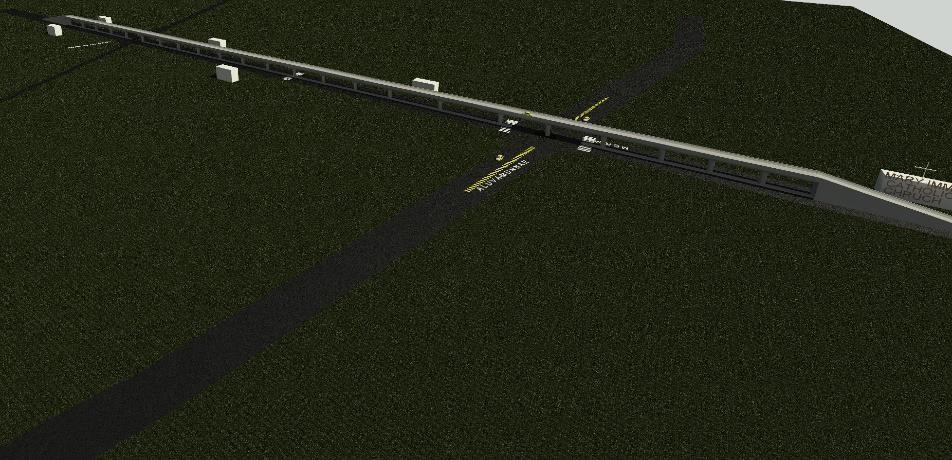
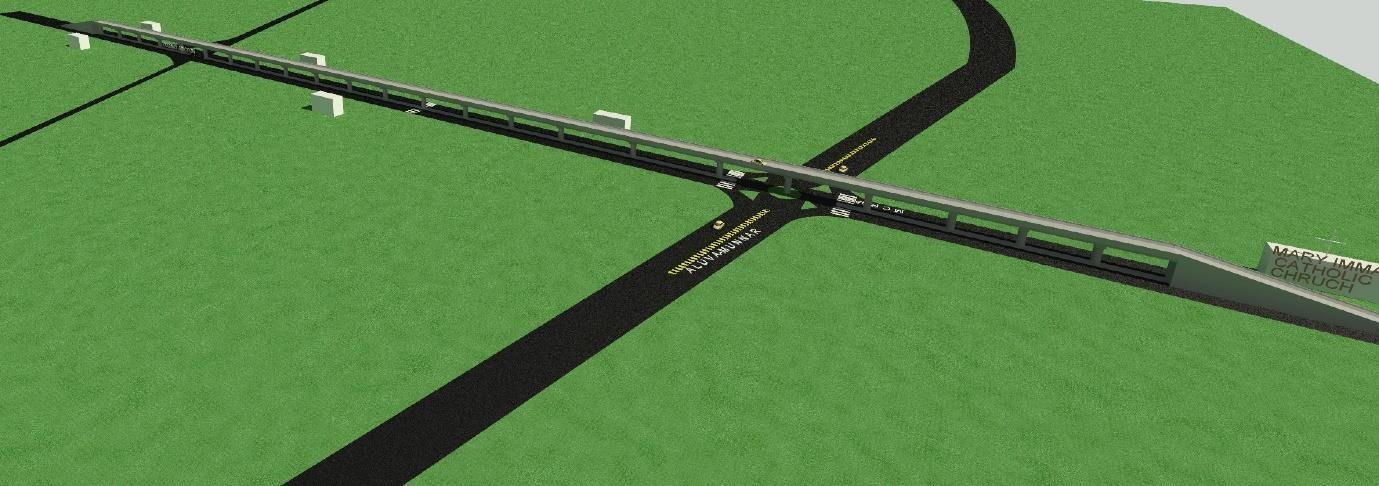
Dataobtainedfromsurveyusingtotalstationisusedtodesignaflyover.AsthedetailedfileisimportedfromAutoCADto Revit software. In general length of the flyover is 580.5m. Standard estimations of path width (3.5m), shoulder width (0.6m to 1m), middle (2m) are given in IRC: SP: 73 2015, Manual for determinations and norms for two coating of thruways. As indicated by IRC:3 1983, Dimensions and Weights of street plan vehicles, no vehicle other than multilevel buses will have a level surpassing 3.8m for ordinary application and multilevel buses might have a level not surpassing 4.75m.Therefore,according toIndianStandards,theheightofflyovershouldbe5.5m.Totalwidthoftheflyoveris7.6m. Slopeoftherampis15°.Pillarsareprovidedatanintervalof7mthroughoutthelength.Pillardiameteris75cmand83 numberofpillarsareprovided.
Flyovers contain a few benefits, yet limits emerge simply because of a few mix ups committed at some stage in their development or, in all likelihood due to ill advised arranging, etc. Flyovers are not, when in doubt, proper for created regions as they need a colossal region and furthermore it is costly. Absence of legitimate overseeing inside flyover developmentcouldcreatebunchesofissues.Differentdesigningstudieswerecompletedforappropriatepreparationand planning of grade separator at proposed intersection. The significant expectation is to get better current situation immeasurably and make relationship of traffic helpful to conceivable expand, albeit a totally contrast free circumstance can't be perceived. The essential plan norms executed for foundational layouts are according to necessities set down in latestversionsofIndianRoadsCongresscodesofpracticesandcustomarydetailsofMinistry ofRoadTransportaswellas Highways. Land acquisition is also required for its construction. This project deals with traffic analysis and proposing a designlayoutforaflyover,henceitisnotdetailingaboutthestructuralaspect.
Expanded in populace and fast urbanization of India have brought about expanded utilization of vehicles and transportation offices, which thus brings about gridlock and related issues. The project study is based on 4 main intersection and the traffic data is collected through manual counting on peak hours and converted to PCU/Hr. After comparingthevaluesof4roadsMuvattupuza Angamalyhasthehighestpeakvalue.Thetotalvehicularcountisaround 10000PCU/Hr.Fieldmeasurementsaredoneusingtotalstation.Themaximumvaluearotarycanhandleis5000PCU/Hr and elevated highways can carry beyond this limit. So, an alternate solution suggested is the design of a flyover. Data obtainedfromsurveyusingtotalstationisusedtodesignaflyover.AsthedetailedfileisimportedfromAutoCADtoRevit software.Overalllengthoftheflyoveris580.5m.Standardmeasurementsoflanewidth(3.5m),shoulderwidth(0.6mto 1m),median(2m)areprovidedinIRC:SP:73 2015,Manualfordeterminationsandnormsfortwocoveringofhighways. Althoughgovernmentsmayneverbeabletoeliminateroadcongestion,withtheflyoverconstructionitcouldbereduced toa certain extentandcrisiscanbemitigated well.Despiteofhugeinvestmenttobelaid,itwouldprovide an easy,safe andfasttransportation.Iftheprojectisimplementedthepresentandfuturedemandsoftrafficmaybesatisfied.
1) Chandra,SikdarandP.K.(1993):‘DynamicPCUforIntersection[2] Capacity Estimation’, Indian Highways, Volume115.
2) Arasan, V.T. and Koshy (2005): ‘Methodology for Modelling Highly Heterogenous Traffic Flow’, Journal of TransportationEngineering,ASCE2005,Volume131.
3) Arasan,V.T.andArkatkar(2010):‘MicrosimulationStudyofEffectofVolumeandRoadWidthonPCUofVehicles UnderHeterogenousTraffic’,JournalofTransportationEngineering,ASCE2010,Volume181.
International Research Journal of Engineering and Technology (IRJET) e ISSN: 2395 0056
4) Praveen, Arasan, V.T (2013): ‘Influence of traffic mix on PCU value of vehicles under heterogenous traffic conditions’,IJTTE2013,Volume210.
5) Naveen Kuma (2014): ‘Performance evaluation of at grade intersection and improvement using signal coordination’,IJSRET2014,Volume131.
6) Satyajit Mondal, Vijay Kumar Arya, Ankit Gupta and Samsi Gunarta (2020): ‘Comparative analysis of saturation flowusingvariousPCUestimationmethods’,TransportationResearchProcedia2020,Volume48
Volume: 09 Issue: 06 | June 2022 www.irjet.net p ISSN: 2395 0072 © 2022, IRJET | Impact Factor value: 7.529 | ISO 9001:2008 Certified Journal | Page2099