International Research Journal of Engineering and Technology (IRJET) e ISSN: 2395 0056

Volume: 09 Issue: 06 | Jun 2022 www.irjet.net p ISSN: 2395 0072
International Research Journal of Engineering and Technology (IRJET) e ISSN: 2395 0056
Volume: 09 Issue: 06 | Jun 2022 www.irjet.net p ISSN: 2395 0072
1M. Tech Student, Department of Civil Engineering, College of Engineering Pune, India 411 005 2Professor, Department of Civil Engineering, College of Engineering Pune, India 411 005 ***
Abstract An Agricultural drought is a type of natural disaster that seriously impacts food security. It's difficult to accurately identify a drought scenario because the interactions between short term rainfall, soil moisture, and crop growth are so complicated. To cope with drought in the current climate change scenario, it is vital to understand the features of agricultural droughts in water scarce regions in order to design prudent plans for the use of water resources. Drought indices based on remote sensing, as well as Geographic Information Systems (GIS), are critical tools for mapping and monitoring agricultural droughts The primary goal of the present study is to monitor agricultural drought dynamics over the semi arid region of Buldhana District (WesternVidarbha) during the year 2011to2021byusingthe Normalized Difference Vegetation Index derived (NDVI) and Standard Precipitation Index (SPI) from time series remote sensing data products. The study clearly indicates NDVI and SPI's potential as reliable indices for assessingandmonitoring agricultural droughts.
Key Words: Agricultural drought, Food security, climate change, GIS, Indices, NDVI, SPI
Foodsecurityhasbecomeacrucialissueformany developingcountriesastheworldpopulationcontinuesto grow. Furthermore, global climate change increases the severityandfrequency of extremeclimate events,such as droughts,reducingwateravailabilityandposingathreatto livelihoods and global food security. Drought is a severe climatic hazard that occurs when the amount of water available falls below the predicted level for an extended period of time, which is a form of hydrological extreme. Droughtisthemostdamagingofallnaturalhazardsinterms of societal damage. Droughts occur in practically every regionoftheworldhowever,theiroccurrence,duration,and intensity vary depending on climatic and hydrological regimes.Duringthedroughtperiod,waterscarcityaffectsall human activities in general and agricultural activities in particular,leadingtoreductionsinagriculturalproduction andproductivityinthearidandsemi aridregions.Drought isanaturaloccurrencecausedbyalackofrainfallinaregion that is less than its typical distribution. Drought is a non permanentandrepeatingphenomenon,whichoccursdueto deficiencyofprecipitationoveranextendedperiodoftime, as compared to long term average conditions and it is
prevalent and more frequent especially in semi arid ecosystems. Drought inagriculturerefersto a decrease in crop yield due to inconsistent rainfall and insufficient soil moistureinthecrop rootzones. Droughtisa complicated phenomenonthatisinfluencedbyavarietyofhydrological variables such as precipitation, evaporation, runoff, infiltration,surface,andgroundwaterstorages.Droughtsare frequently classified as meteorological, agricultural, hydrological,orsocioeconomic.Hightemperaturesandlow precipitation cause a meteorological drought, resulting in water shortages. Crops suffer from water shortages as a result of meteorological drought, resulting in agricultural drought. Agriculture droughts are more difficult to comprehend than other droughts due to the complex relationshipbetweenvegetationandclimate.
In India, about 15.8% (50.8Mha) of the geographical area is arid and nearly 37.6% (123.4Mha) is characterizedbysemiaridclimaticconditions,around68% ofthecountryisvulnerabletodroughtindifferentdegrees mainlyinarid,semi arid,andsub humidregionsofwestern andpeninsularIndia.SinceMaharashtraisadrought prone state,identificationandprojectionofdroughtarethemain focusofhydrologicalstudies.Althoughitisanexampleofan industrialized state, more than 50% of the population depend on the agriculture and allied activities for their livelihood, which increases the vulnerability of drought disaster.Therefore,droughtisoneofthemajordisasters,as it affects the agrarian economy of the state. That’s why, droughtmonitoringiscriticalforprovidingscientificdatafor policyformulationanddroughtriskmitigation.Traditional methodologiesandpoint baseddatasetsareinsufficientfor monitoringandassessingtheagriculturaldroughtontheir own. The assessment of the relationship between environmentalconditionsandvegetationcoverisrequired in arid and semi arid regions to understand the spatiotemporalvariationsofagriculturaldroughtsinorder toplanandmanagethem.
Various drought indicators have recently been developedtoassessdroughtcharacteristics,particularlyits severityandspatialextent.Remote sensingbaseddrought indices are more trustworthy than site based drought indices for monitoring the spatio temporal pattern of droughtconditions.Thedroughtindicesderivedfromtime seriessatellitesarehighlyreliabletomonitorandassessthe droughtseveritybyitsspatio temporalresolutionespecially
International Research Journal of Engineering and Technology (IRJET) e ISSN: 2395 0056
Volume: 09 Issue: 06 | Jun 2022 www.irjet.net p ISSN: 2395 0072
wherelimitedgaugestationsareavailableInrecentyears, the Climate Hazards Group Infrared Precipitation with Stations(CHIRPS)datasethasbeenusedasasubstituteto ground based precipitation data for the assessment of droughts Vegetation response depends on many factors, which include duration, severity and intensity of drought, vegetationphenology,andotherenvironmentalfactorslike soiltype, agricultural practices,and elevationofthegiven location. Many vegetation indices have been developed to monitorvegetationconditionsintimeandspace.NDVIisone ofthemostwell knownvegetationindices,anditisusedto monitor and analyse drought occurrence and vegetation health, particularly in semi arid environments where vegetationcovers<30%ofthearea.MODISoffersreal time landsurfacetemperature(LST)dataandtheaccessibilityof such surface temperature data is helpful to monitor and quantify the association between seasonal and inter seasonal vegetation dynamic with changes in surface temperature.LSTretrievedfromremotesensingdatafound to be an essential environmental variable in drought monitoring.Time seriesremotesensingdataplayavitalrole inthedetection,assessment,andmonitoringofagriculture drought with its real time data availability and different rangeofspatialandtemporalcoverage.
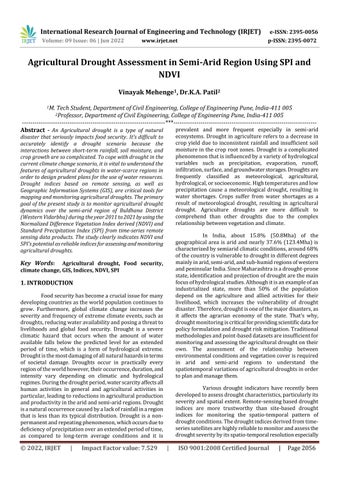
BuldhanadistrictisastudyareainthewesternVidarbha regionandatthenorthernendofMarathwada.Thisstudy areaisspreadinlatitudes19°51′to21°17′inNorth,75°57′ to76°59′longitudestowardsEastanditcoversabout9670 km2 of India. In 2011, the population of Buldhana was 2,586,258 people. Normal rainfall inthe districtisaround 713mm.Thenetirrigatedareaof1.55lakhhaaccountsfor 21.95 percent of the net sown area of 7,06,300 ha, with 1,17,100 ha being cultivated multiple times. The cropping intensity is 116.58%. Ground water (well irrigation) provides irrigation facilities to about 63,689 ha which is 41.09%ofthenetirrigatedarea.Whilecanalnetworkand other surface water sources including rivers provide irrigationfacilitiestoabout91280hawhichis58.91%ofthe net irrigated area The district's main source of income is agriculture.23%oflandholdingsarecategorizedassmall thatincreasesthevulnerability.
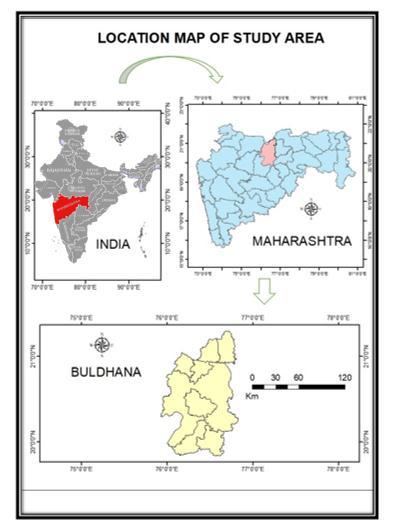
Fig 1:StudyArea
CHIRPSdataat1 monthtemporalresolutionand5km spatial resolution were obtained from the UCSB Climate Hazards Group (CHG) website (https://www.chc.ucsb.edu/data/chirps) for January to Decemberforaperiodof10years(2011to2021)andthe samedatasetswereusedtocompute1 monthSPI.MOD13Q1 dataproductsofMODISwith250m16dayscompositeand MOD11A2 8 days composite data products at 1 km resolution for 10 years (2011 to 2021) were downloaded (https://lpdaac.usgs.gov)todevelopmonthlyNDVI
International Research Journal of Engineering and Technology (IRJET) e ISSN: 2395 0056
Volume: 09 Issue: 06 | Jun 2022 www.irjet.net p ISSN: 2395 0072
datasets for the same period. The SPI for one month was calculatedusingthefollowingmathematicalformula
Where,“Xij"representsrainfallfortheith stationandthejth observation, "Xim" represents the mean rainfall for the ith station,and‘σ’representsthestandarddeviationfortheith station.
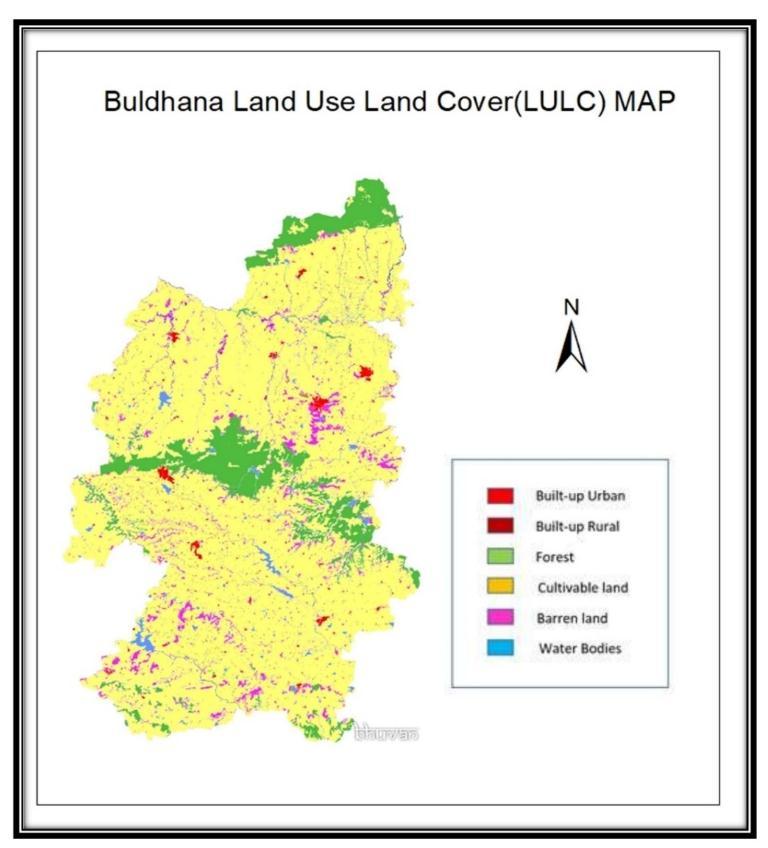
Fig 2:Mapofthestudyareawithgenerallanduse/land coverclasses.
Inthestudy,themonthlyCHIRPSrainfalldataat5 km resolution for the period of 10 years (2011 to 2021) wereused.Therasterwasthentransformedintoapointin ArcGIS using the 'raster to point' tool. The values of each pointwerethenderivedfrommonthlyrainfallrastersusing theArcGIS'extractvaluestopoints'tool.Subsequently,the monthly rainfall data were interpolated by using the IDW interpolation technique in ArcGIS and generated monthly rainfalldataproducts,thendownscaledto250mbyusing the‘bilinearresamplingtechnique’toachieveparitywiththe MODIS250mproductsutilisedinthestudy
As a drought indicator, the SPI is calculated using the probability of precipitation for each given time scale. A gamma probability density function is fitted to a given frequency distribution of precipitation totals for a certain station.UsingtheSPItool,a1 monthSPIwascomputedfor 10 years (2011 to 2011) from monthly rainfall data generatedfromCHIRPSdataproductstoexaminelong term monthly dry and wet conditions. Following that, using the IDWinterpolationapproachinArcGIS,aseasonalSPIraster (June September) was created for the period 2011 2021 based on 1 month SPI rasters for further study with vegetation indices produced from time series satellite
The MODIS Terra vegetation index 16 days NDVI compositewith250mresolution(MOD13Q1)wasobtained forthegrowingseasonfromJunetoSeptember,spanningthe Juliandatesfora10 yearperiod(2011to2021).Usingthe MRT tool downloaded from LPDAAC (https://lpdaac.usgs.gov/lpdaac/tools), the downloaded datasets were re projected from the sinusoidal projection system to the Universal Transverse Mercator (UTM) projectionsystemwithWGS84datumandthenclippedwith the study area boundary. Clouds and other atmospheric disturbances characterise the MODIS NDVI, lowering the qualityofNDVItime seriesdatasets.Thequalitycontrolflags were calculated using the MODIS LDOPE (Land Data OperationalProductsEvaluation)toolandArcGISsoftwareto createbetterfiltereddatasets. Togetthequalitygradefile corresponding to NDVI, the CMD batch programme of the LDOPEtoolwasusedtodecodethequalityinformationofthe red and near infrared bands in batches, and ArcGIS was utilized for batch grading synthesis. The atmospherically correctedNDVIproductswereeventuallyusedtoconstruct monthly NDVI composites for the growing season (June September)andgrowingseasonmeanNDVIcompositesfora 10 yearperiod(2011 2021).
International Research Journal of Engineering and Technology (IRJET) e ISSN: 2395 0056
Volume: 09 Issue: 06 | Jun 2022 www.irjet.net p ISSN: 2395 0072
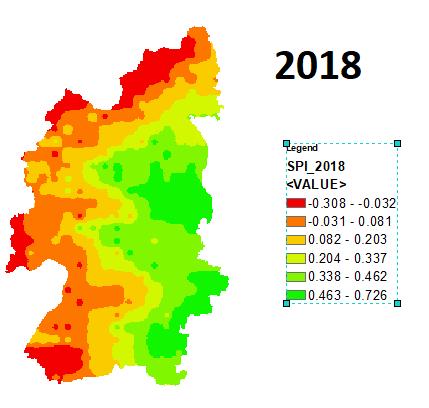
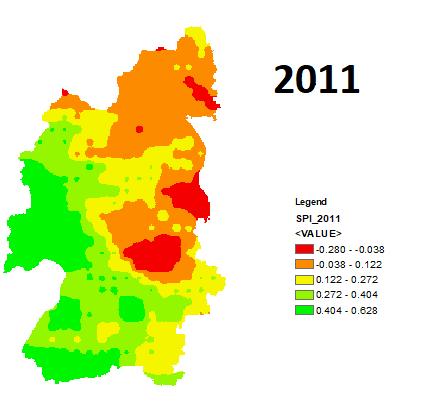
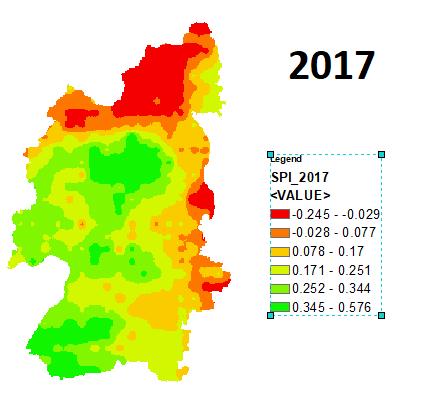
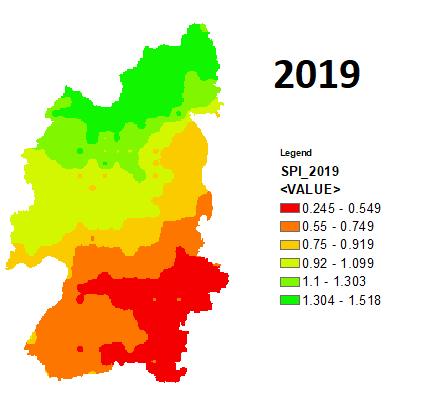
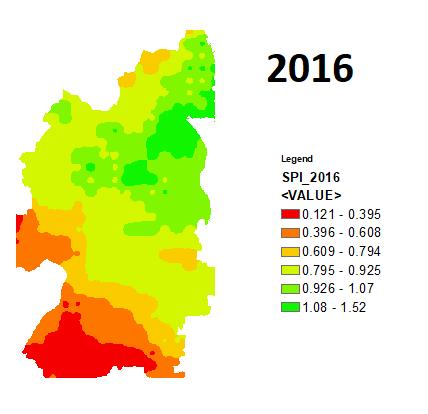
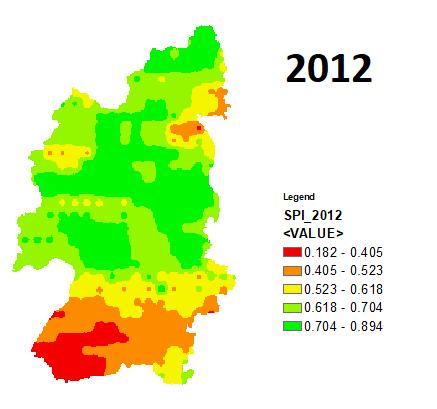
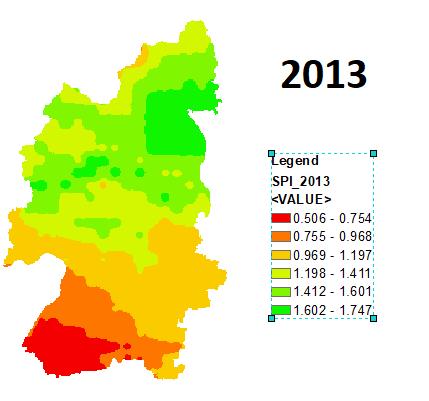
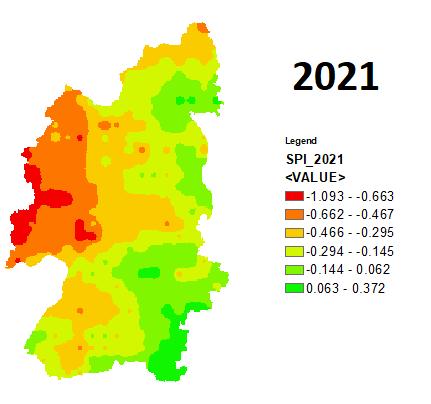
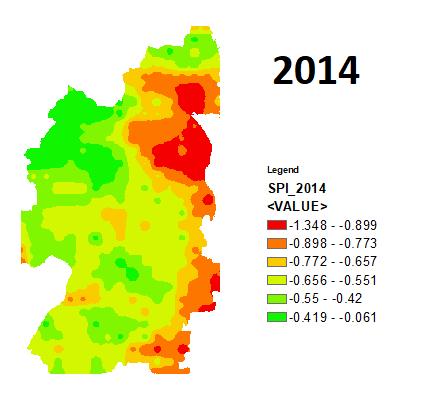
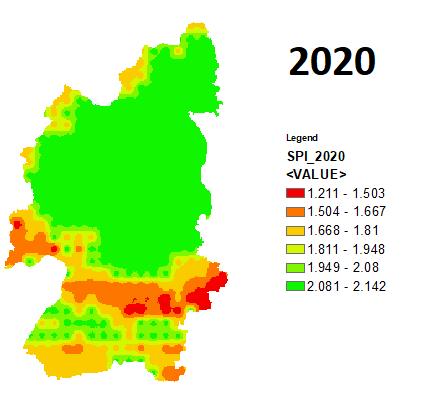
Fig. 3. Spatio-temporalpatternsof1-monthSPIofthegrowingseasonoverthestudyareaduringtheperiodfrom2011to 2021
International Research Journal of Engineering and Technology (IRJET) e ISSN: 2395 0056
Volume: 09 Issue: 06 | Jun 2022 www.irjet.net p ISSN: 2395 0072
Fig. 4.Spatio temporalpatternsofmeanLSTofthegrowingseasonoverthestudyareaduringtheperiodfrom2011to 2021
2022, IRJET | Impact Factor value: 7.529 | ISO 9001:2008 Certified Journal
International Research Journal of Engineering and Technology (IRJET) e ISSN: 2395 0056
Volume: 09 Issue: 06 | Jun 2022 www.irjet.net p ISSN: 2395 0072
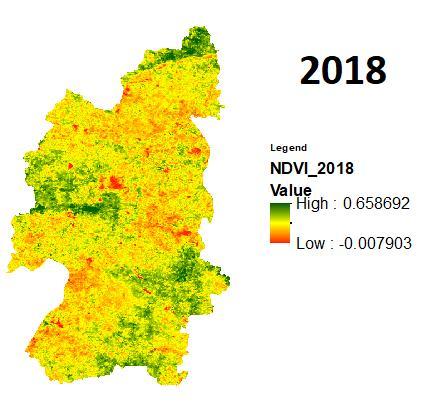
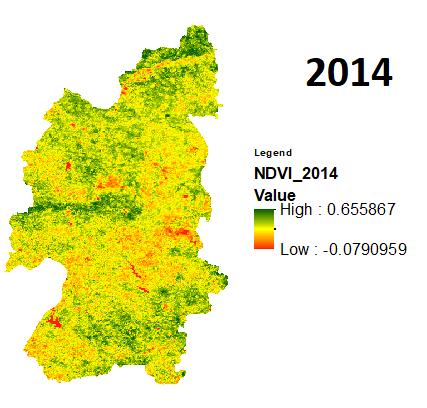
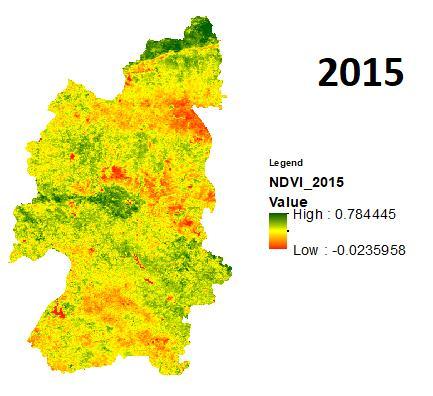
Thetemporalanalysisof1 monthSPIandNDVIfor the growing season indicates that drought is a frequent phenomenoninthemajorityoftheyearsduringtheperiod from2011to2021intheBuldhanaDistrict.Duringtheyear of2014thedistrictreceivedthelowestrainfallofthedecade andhencewasaffectedbythemostseveredroughtofthe decade with the lowest SPI value of about 1.34 and corresponding years min NDVI was observed to be 0.07. Thefollowingyearwasalsonogoodforthedistrict,thisyear of2015 wasalsodrybecauseofthelow monsoon rainfall withSPI 0.8,leadingtoamoderatetoseveretypeofdrought withaNDVIindexof 0.07.
Year Min Max Min Max Remark
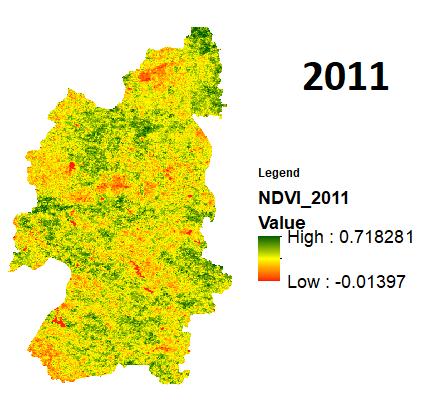
2011 0.28 0.62 0.01 0.71 Moderate Drought
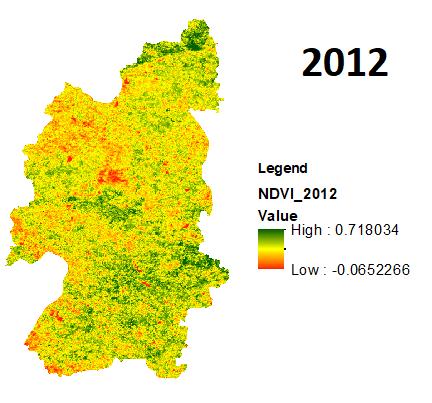
2012 0.18 0.89 0.06 0.71
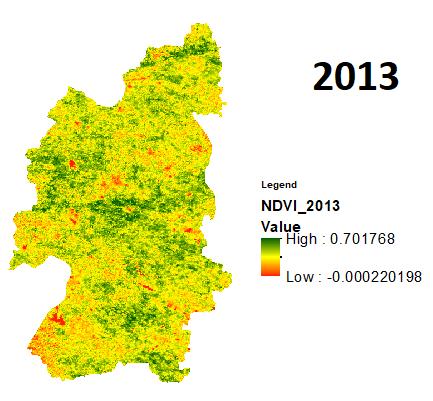
2013 0.51 1.75 0.00 0.70
2014 1.34 0.06 0.07 0.65 SevereDrought
2015 0.8 0.37 0.02 0.78 Moderate Drought
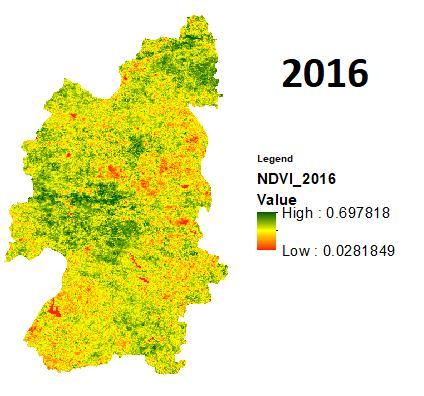
2016 0.12 1.52 0.02 0.69
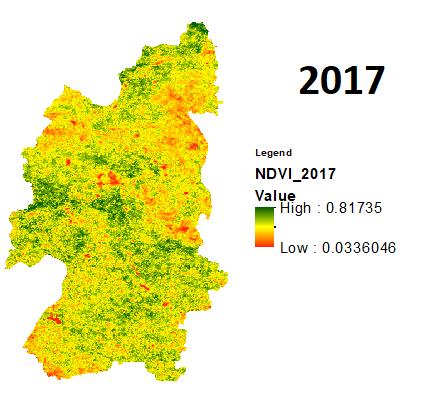
2017 0.24 0.57 0.03 0.81 Moderate Drought
2018 0.30 0.72 0.00 0.65 Moderate Drought
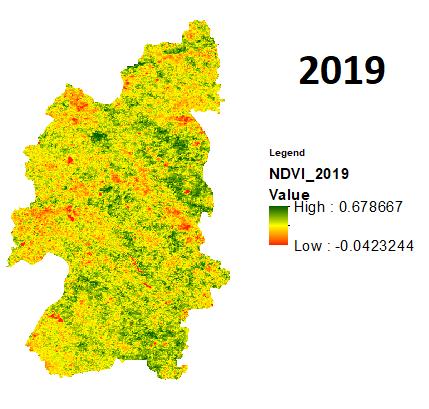
2019 0.24 1.51 0.04 0.67
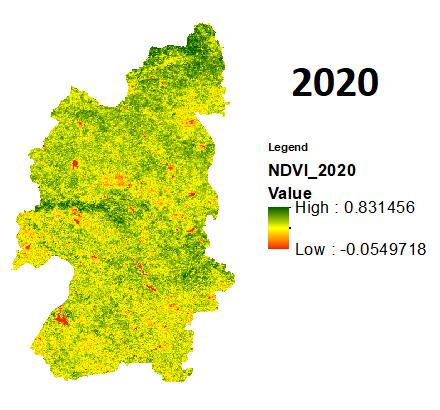
2020 1.2 2.14 0.05 0.83
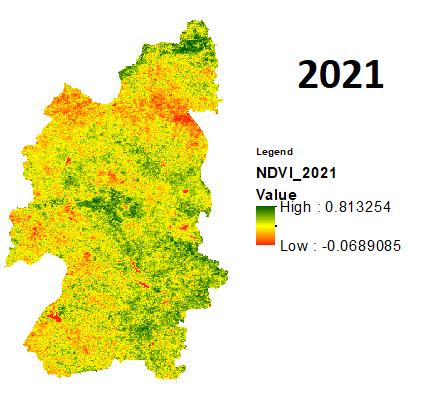
2021 1.09 0.37 0.06 0.81 SevereDrought
Table1.TemporalanalysisofdroughtusingSPIandNDVI.
Onceagainrecentlyintheyear2021theduethedeficitin rainfall during the monsoon with a minimum SPI of 1.09 andtheeffectofsamewasobservedonthevegetationwith the min NDVI of 0.06. The year of 2011,2017,2018 even though received lower rainfalls as compared to normal rainfall of the district but received better rainfall than the previousdiscussedyearswiththerespectiveSPIindicesas 0.28, 0.24, 0.30andNDVIsas 0.01,0.03,0.00.Intheyearsof 2012,2013,2019themonsoonwasgoodwhileintheyearof 2020 the district received the best rainfall of the decade producinganSPIvalueof1.20.
Year Affected Area Affected Area
2011 North East East 2012 South North West 2013 South South West 2014 East East 2015 East/South West East/South 2016 South West East/South West 2017 North/East North/East 2018 West/North West North/North East 2019 South/South East West 2020 2021 West West
Table2.SpatialAnalysisofdrought
Affected Area Frequency
North 2 South 4 East 7 West 4 North East 1 North West 2 South East 1 South West 4
Table3.
AscanbeseenfromtheaboveSpatial Frequencyanalysis itcanbeobservedthatthemostofthetimewhenthedistrict isaffectedbythedrought,theeasternpartofthedistrictis seen to be affect by the agricultural drought. In the last decadeitselfitwasaffectthemostthatis7times.Afterthat thesouthern,WesternandSouth Westernpartofthedistrict were seen to be drought affected 4 times in the previous decade.
The spatio temporal investigation of 1 month SPI derivedfromCHIRPSrainfallproductsforthegrowingseason from the year 2011 to 2021 indicates that agricultural drought is a frequent phenomenon in the majority of the yearsintheBuldhanadistrict.TheanalysisofmeanNDVIof thegrowingseasonfortheperiodfrom2011to2021clearly illustratesthattheregionwitnessedconsistentagricultural
International Research Journal of Engineering and Technology (IRJET) e ISSN: 2395 0056
Volume: 09 Issue: 06 | Jun 2022 www.irjet.net p ISSN: 2395 0072
droughts,especiallyineastern,southern,WesternandSouth Westernparts.Duringtheyear2015theregionexperienced moderatetoseveredrought.However,intheyear2020the region was free from the agricultural droughts. The years 2012,2013,2016and2019experiencedmilddroughts.While the years 2014 and 2021 were severely affected by the drought. The study clearly illustrates the utility of NDVI generated from time series in mapping and monitoring agricultural drought in semi arid regions, as it provides consistent and reliable spatio temporal coverage for developingappropriatedroughtmitigationandadaptation measures.Thoughagriculturaldroughtsarecomplicatedand influencedbyavarietyoflocaltoglobalclimatevariables,the study's wide framework for obtaining multiple vegetation indices from time series was used. Satellite data could be used in the assessment and monitoring of agricultural drought,especiallyinaridandsemi aridzones,withminimal alterationstosuitlocalconditions.
[1] Alamdarloo, E.H., Manesh, M.B., Khosravi, H., 2018. Probability assessment of vegetation vulnerability to droughtbasedonremotesensingdata.Environ.Monit. Assess.190,702.
[2] Bhuiyan, C., Singh, R.P., Kogan, F.N., 2006. Monitoring drought dynamics in the Aravalli region (India) using differentindicesbasedongroundandremotesensing data.Int.J.Appl.EarthObser.Geoinfor.8,289 302.
[3] Chen, J., Jonsson, I., Tamura, M., Gu, Z., Matsushita, B., Eklundh,L.A.,2004.Simplemethodforreconstructinga high quality NDVI time series data set based on the Savitzky Golay filter. Remote Sens. Environ. 91, 332 344.
[4] Du,L.,Tiana,Q.,Yub,T.,Meng,Q.,Jancsoc,T.,Udvardyc, P., Huang, Y., 2013. A comprehensive drought monitoringmethodintegratingMODISandTRMMdata. Int.J.Appl.EarthObser.Geoinfor.23,245 253.
[5] Gao,F.,Zhang,Y.,Ren,X.,Yao,Y.,Hao,Z.,Cai,W.,2018. Evaluation of CHIRPS and its application for drought monitoring over the Haihe River Basin, China. Nat. Hazards.1 18.
[6] Gillespiea,T.W.,Ostermann Kelmb,S.,Donga,C.,Willis, K.S., Okina, G.S., MacDonalda, G.M., 2018. Monitoring changes of NDVI in protected areas of southern California.Ecol.Ind.88,485 494.
[7] Hua,L.,Wang,H.,Sui,H.,Wardlow,B.,Hayes,M.J.,Wang, J., 2019. Mapping the spatial temporal dynamics of vegetationresponselagtodroughtinasemi aridregion. RemoteSens.11(1873),1 22.
[8] Karnieli,A.,Agam,N.,Pinker,R.T.,Anderson,M.,Imhoff, M.L.,Gutman,G.G.,Panov,N.,Goldberg,A.,2010.Useof NDVI and land surface temperature for drought assessment:meritsandlimitations.J.Clim.23,618 633.
[9] Mahajan, D.R., Dodamani, B.M., 2016. Spatial and temporaldroughtanalysisintheKrishnaRiverbasinof Maharashtra,India.Cogent.Eng.3,1 15.
[10] Nichol, J.E., Abbas, S., 2015. Integration of remote sensing datasets for local scale assessment and predictionofdrought.Sci.TotalEnviron.505,503 507.
[11] Patel,N.R.,Yadav,K.,2015.Monitoringspatio temporal patternofdroughtstressusingintegrateddroughtindex overBundelkhandregion,India.Nat.Hazards.77,663 677.
[12] Reddy,G.P.O.,Kumar,N.,Sahu,N.,Srivastava,R.,Singh, S.K., Naidu, L.G.K., Chary, G. R., Biradar, C.M., Gumma, M.K., Reddy, B.S., Kumar, J.N., 2020. Assessment of spatio temporal vegetation dynamics in tropical arid ecosystemofIndiausingMODIStime seriesvegetation indices.Arab.J.Geosci.13,704.
[13] Sreekesh, S., Kaur, N., Naik, S.R.S., 2019. Agricultural droughtandsoilmoistureanalysisusingsatelliteimage based indices. Int. Arch. Photogramm. Remote Sens. SpatialInf.Sci.507 514.
[14] Swain, S., Wardlow, B.D., Narumalani, S., Tadesse, T., Callahan,K.,2011.Assessmentofvegetationresponseto drought in Nebraska using Terra MODIS land surface temperature and normalized difference vegetation index.GISci.RemoteSens.48,432 455.
2022, IRJET | Impact Factor value: 7.529 | ISO 9001:2008 Certified Journal