International Research Journal of Engineering and Technology (IRJET) e ISSN: 2395 0056
Volume: 09 Issue: 06 | Jun 2022 www.irjet.net p ISSN: 2395 0072
International Research Journal of Engineering and Technology (IRJET) e ISSN: 2395 0056
Volume: 09 Issue: 06 | Jun 2022 www.irjet.net p ISSN: 2395 0072
Harpreet Kaur1 , Dr. Sanjay Sharma2
1Post Graduate Student, Dept. of Civil Engineering, National Institute of Technical Teachers Training and Research, Chandigarh (India)
2Professor, Dept. of Civil Engineering, National Institute of Technical Teachers Training and Research, Chandigarh (India) ***
Abstract - The construction of wastewater treatment plants based on latest emerging treatment technologies with effectiveness is necessary. It must be based on an environmentally friendly approach to reduce problem of water pollution which is rising rapidly on global scale, especially in those regions where accessibility to pure water is in challenging phase. The conventional technologies employed for waste water treatment have become less effective to treat the ever increasing loads of wastewater. Thus, resulting in high energy consumptions and malfunctions. Additionally, these facilities engulfed by the cityscape, razing land and diminishing value transforms into unsustainable in the long run. Therefore, for improvement & efficiency of service delivery especially in urban sanitation sector the set of Standardized Service Level Benchmark has been formulated to tackle the problem of pollution. National Green Tribunal (NGT) has taken a serious view of pollution in the drains, streams and rivers and is monitoring the quality of rivers. The objective of this study is based on the comparative study of different technologies adopted in Wastewater Treatment Plants and outline a set of criteria for selecting an appropriate technology. In the proposed work, SBR Technology based STP is selected on the basis of the criteria evolved. SBR Technology produces effluent of high quality and meet regulatory standard. The overall treatment efficiency in terms of removal of BOD, COD, SS, Ammonia Nitrogen (N), Total Kjeldahl Nitrogen (TKN) and Total Phosphorous (TP) founds to be satisfactory against the treatment of the organic load
Key Words: Technologies, Effectiveness, Appropriate, Regulatory Standard.
Wastewater contains a spread of organic and inorganic constituents thus, one amongst the foremost critical issue for environmentdegradationbecauseofitschemicalandtoxicconstituents,anditsbacteriologicalstatus.So,beforedischargingthe wasteproductsintowaterbodies,effectivetreatmentofwastewaterisincrediblycrucialtotakecareofthehealthyanddisease freelife.Themostimportantchallengeinwastewatermanagementindevelopingcountriesnowadaysistheapplicationoflow costwastewatertreatmenttechnologiesthatcanproducetheeffectiveeffluenttomeettheregulatorystandardfordomestic, agricultural,andindustrialpurposes(Jhansi,2013).Sincewastewateralsocontainsreusableresourcessuchaswater,carbonand nutrientsthatcouldberecoveredorreused(Crawford,2010).Theseobjectivescanbemetifasewagetreatmentsystemiswell designed.Themainconcernshouldbetowardsthepreventionofspreadofdiseases,recoveryofnutrient,reuseofwaterandto conservethewaterresources.Itmustbeensuredthatqualityoftreatedwaterisimprovedtoreachthepermissiblelevelofwater forre utilizationortobedischargedintowaterbodiesasperthelatestguidelinesofH’onorableNationalGreenTribunal(NGT). TheNGTorderrequiresahigh qualityeffluent,moreemphasisshouldbelaidtorecycleorreusethetreatedwastewaterwith littleornoneedforadditionaltreatmenttoavoidfuturewatershortagesandtoreducethedamagetotheenvironment.
Thewastewatercontainshugequantityofmacrobiotic,inorganicandtoxicmatterwhicharedangerousforaquatic,humanand environmentlife.Duetoweakregulations,impropermanagement,economicsituationandselectingunsuitabletechnologies,the goalofwastewatertreatmentisnotachievedandtheproblemcontinues.Thus,traditionalwastewatertreatmentsneedtobe upgradedintosustainabletreatmentstoachievetoday’soverallgoalsofwastewatertreatmenttoachievetherevisedlimitsset bytheNationalGreenTribunal.Selectingsuitabletechnologyiscrucialtosolvetheproblem.Moreemphasisistobelaidon differentdegreesoftreatmentdependingonthefinaluseofthisreclaimedwaterandproperdischarge.Thus,theprimary objectiveofthisresearchstudyistoevaluatetheperformanceofdifferenttypesoftreatmenttechnologiessoastodevelop guidelinesforadoptingthemostappropriatetechnologyundergivenconditions.Theprimeobjectiveofthisstudyistoreview andcomparedifferentwastewatertreatmenttechnologiesinordertoselectanappropriatetechnologybasedonsustainability, efficiency, and reliability to meet the desired standards of treated effluent. In order to achieve this, common treatment technologiesbeingemployedareidentified,studiedandcompared.Then,asetofdecisioncriteriaforselectinganappropriate wastewatertreatmentprocessbasedonefficiency,capitalcostandlandrequirementisdeveloped
2022, IRJET | Impact Factor value: 7.529 | ISO 9001:2008 Certified Journal

International Research Journal of Engineering and Technology (IRJET) e ISSN: 2395 0056
Volume: 09 Issue: 06 | Jun 2022 www.irjet.net p ISSN: 2395 0072
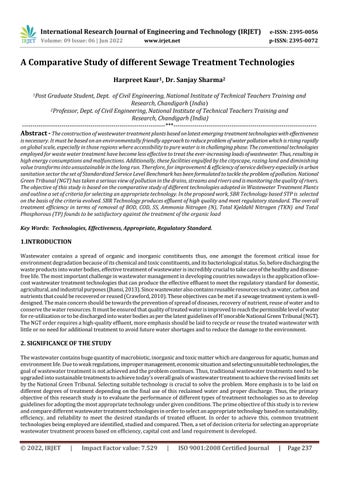
Fundamentally,therearethreeimportantcriterianamelyperformance,cost,andsustainabilitywhichneedstobeevaluatedfor selectingtheappropriatetreatmenttechnologyforwastewatertreatment
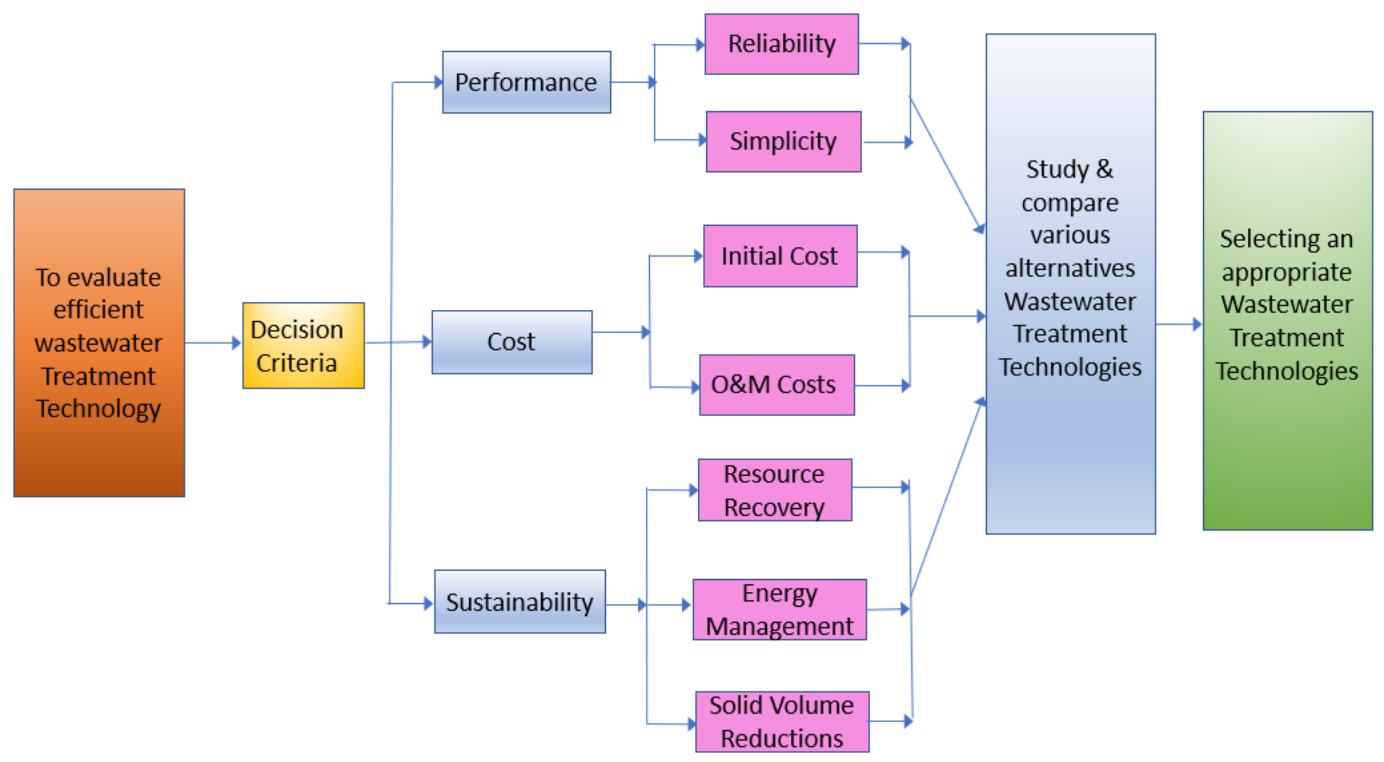
Chart 1: Flow Chart showing Selection Criteria (Wongburi P. et. al, 2018)
Inordertoassessthelateststatusonwastewatergeneration,itismostimportanttostudythegroundrealityofwaterand wastewatertreatmentscenarioinIndia.ThissectionofthereportisbasedonthecomprehensiveassessmentofSewage TreatmentPlantsinIndiacarriedoutbyCPCBintheyear2020 21.Thedatasuchaslocation,capacity,andtotalnumberof treatmentplantsbasedonvarioustreatmenttechnologiesiscollectedandusedtodeterminethemostprevailingtechnology beingeffectivelyusedinthecountry.ThetreatmentcapacitydistributioninpercentageamongvariousStatesisdepictedin Chart 2andSewageTreatmentCapacityDistributionTechnology wiseisshowninChart 3.
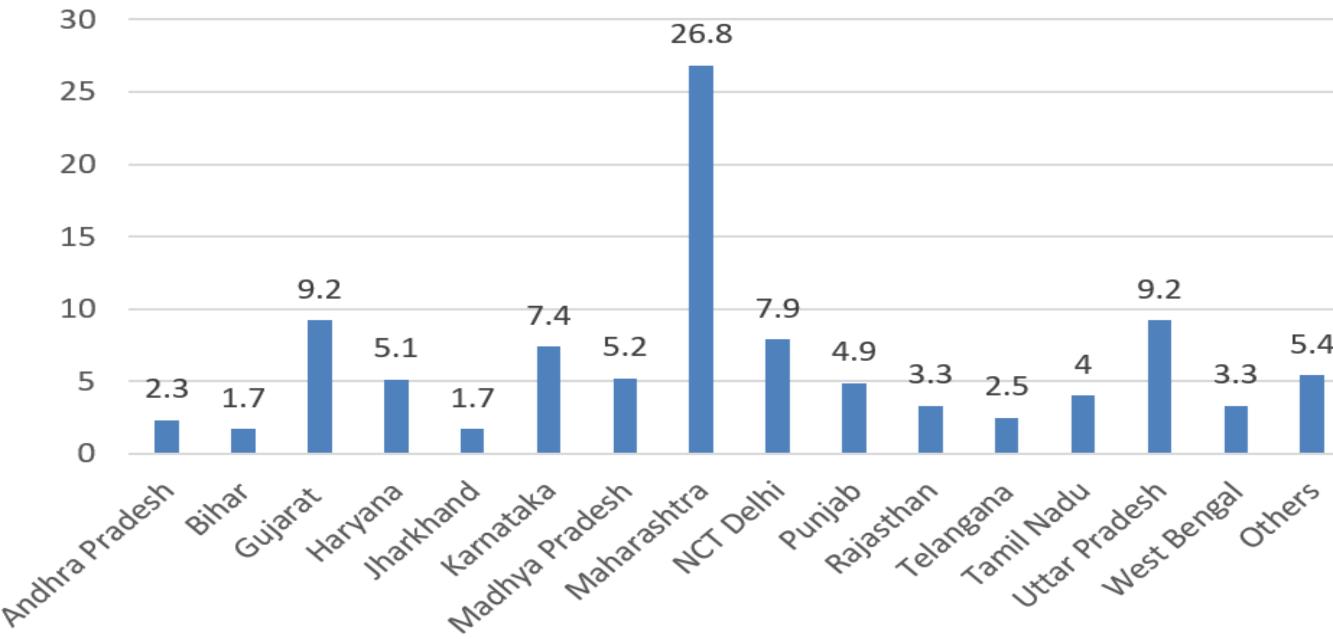
Chart 2: Sewage treatment capacity distribution (in Percentage)
2022, IRJET | Impact Factor value: 7.529 | ISO 9001:2008 Certified Journal
International Research Journal of Engineering and Technology (IRJET) e ISSN: 2395 0056
Volume: 09 Issue: 06 | Jun 2022 www.irjet.net p ISSN: 2395 0072
FromChart 2,itisinferredthatStatesofMaharashtra,Gujarat,UP,NCTofDelhiandKarnatakahaveinstalledsignificantsewage treatmentfacilities
Chart 3: Technology wise sewage treatment capacity distribution (in Percentage)
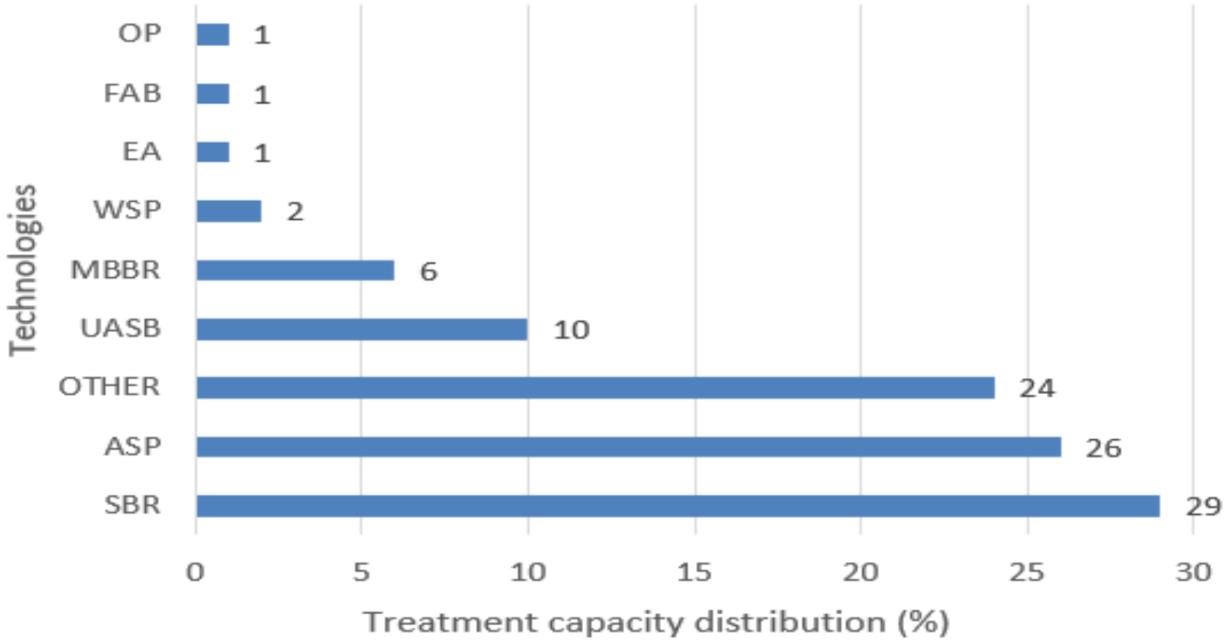
From above Chart 3, it is observed that Sequential BatchReactor(SBR)and Activated Sludge Process(ASP) are the most prevailingtechnologiesadoptedinthecountry.
ThereviewofvariousstandardsfordischargeoftreatedeffluentlaiddownbyCPHEEO,MinistryofEnvironment,Forestand ClimateChange(MoEF&CC),CentralPollutionControlBoard(CPCB),PunjabPollutionControlBoard(PPCB),NationalGreen Tribunal(NGT)hasbeenmadeandisdiscussedasunder:
Table 1: Comparison of
standards by different Pollution Controlling Bodies
AComparativestudyofdifferentTechnologiesforwastewaterTreatmenthasbeenmadeconsideringkeyparameterssuchas performance,efficiency,treatmentcosts,O&Mcosts,energycostandlandrequirement.Theproposedworkisbasedonthe researchstudyconductedbyvariousorganizationsintheyear2010andarediscussedbelow:
2022, IRJET | Impact Factor value: 7.529 | ISO 9001:2008 Certified Journal
International Research Journal of Engineering and Technology (IRJET) e ISSN: 2395 0056
Volume: 09 Issue: 06 | Jun 2022 www.irjet.net p ISSN: 2395 0072
Table 2: Comparison of performance after Secondary Treatment of major technologies (Tare V., 2010)
S. No Parameter Technology
ASP MBBR SBR UASB+ EA MBR WSP
1. EffluentBOD,mg/l <20 <20 <10 <20 <5 <40
2. EffluentSS,mg/l <30 <30 <10 <30 <5 <100
3. FaecalColiformremoval,logunit Upto2<3 Upto2<3 Upto3<4 Upto2<3 Upto 5<6 Upto2<3
4. T NRemovalefficiency,% 10 20 10 20 70 80 10 20 70 80 10 20
ThestudyofperformanceevaluationofdifferentTechnologiesusedinSewageTreatmentPlantshowsSTPdesignedonMBR TechnologyresultsinmaximumremovalofBODandSSwiththevaluelessthan5mg/l.ThisisfollowedbySBRTechnology which results in reduction of BOD and SS level to the valueless than 10 mg/l. Maximum removal of Faecal Coliform is achievedbyMBRTechnologywhichisintherangeof5 6logunitandisfollowedbySBRTechnologywhichcanremove FaecalColiformuptotherangeof3 4logunit.MaximumT NremovalefficiencyisfoundinSBRandMBRTechnologyhaving valueof70 80%whereasotherTechnologiesASP,MBBR,UASBandWSPshowsremovalefficiencyof10 20%.WSPhasthe leastwatereffluentquality.Therefore,STPsbasedonMBRandSBRtechnologiesarepredominant.
Table 3: Comparison of area requirement and treatment costs of various technologies for STP (Tare V., 2010)
Technology
S. No Parameter
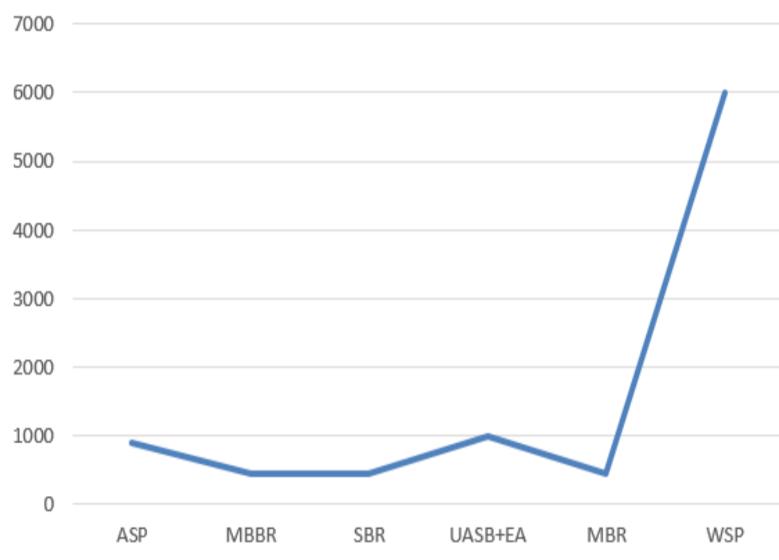
AverageArea,m2perMLD 900 450 450 1000 450 6000
AverageCapitalCost, lacs/MLD 68 68 75 68 300 23 CivilWorks,%oftotalcapitalcosts 60 60 30 65 20 90 E&MWorks,%oftotalcapitalcosts 40 40 70 35 80 10
Chart 4: Comparison of treatment costs of various technologies for STP
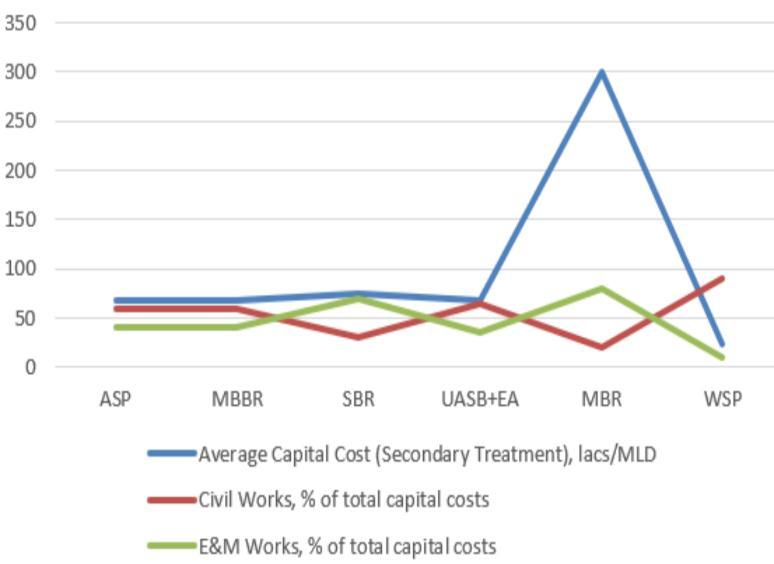
Chart 5: Comparison of area requirements of various technologies for STP
BasedonthedataanalysisandfromaboveChart 4,itisobservedthataveragecapitalcostofSTPbasedonMBRTechnologyis 300lacsperMLD.Thus,makingitundesirable.Secondly,itcanalsobeseenthatWSPrequirescivilworksequalto90%oftotal capitalcostsandASP,MBBR,UASBrequiresalmost60 65%oftotalcosts.ThecivilworksforSTPbasedonSBRTechnology involves30%oftotalcostswhereasMBRTechnologyrequires20%oftotalcosts.Thus,STPbasedonSBRorMBBRtechnology
2022, IRJET | Impact Factor value: 7.529 | ISO 9001:2008 Certified Journal | Page240
International Research Journal of Engineering and Technology (IRJET) e ISSN: 2395 0056
Volume: 09 Issue: 06 | Jun 2022 www.irjet.net p ISSN: 2395 0072
arefoundtobedesirable.However,costforE&MWorksforSTPsdesignedonWSPTechnologyisverylessi.e.,10%oftotal costsandisfollowedbyUASB+EAwith35%oftotalcosts.ASPandMBBRrequires40%oftotalcostswhereasSBRTechnology requires70%oftotalcostswhichisalmostatparwithMBRTechnologyrequiring80%oftotalcosts.
FromChart 5,itisunderstoodthatanaverageareaofabout6000m2perMLDisrequiredforconstructionofSTPincaseof WSPTechnology,whichistoohigh.WhereasMBBR,SBRandMBRTechnologyrequirestheminimalfootprintofthetreatment planti.e.,450m2perMLDfollowedbyASPandUASB+EArequiring900and1000m2perMLDrespectively.
ASP MBBR SBR UASB+EA MBR WSP
1. Energy cost (per MLD)
1.1. Avg. Technology Power requirement,kWh/d/MLD 180 220 150 120 300 2.00
1.2 Avg. Technology Power requirement,kWh/d/MLD 4.5 2.50 2.50 4.50 2.50 2.50
1.3 Total Daily Power Requirement (avg)kWh/d/MLD 184.50 222.50 152.50 124.50 301.50 4.50
1.4 Daily Power Cost (@6.0 per kWh)/MLD/h (including, standby power cost) 46.43 55.93 38.43 31.43 75.93 1.43
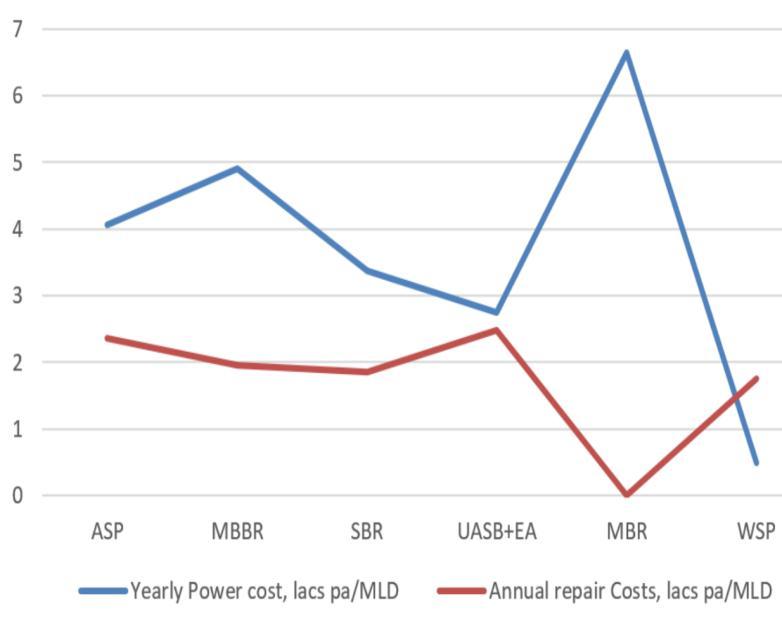
1.5 YearlyPowercost, lacs pa/MLD 4.07 4.90 3.37 2.75 6.65 0.49
2 Repairs Cost (Per MLD)
2.1 Civil works Maintenance, lacs pa/MLD 1.94 1.30 1.04 2.11 1.70
2.2 E&M Works Maintenance, lacs pa/MLD 0.43 0.65 0.81 0.38 0.06
2.3 AnnualrepairCosts,lacs pa/MLD 2.37 1.95 1.85 2.49 1.76
FromChart 6itisunderstoodthatcostofenergy per MLD to run the plant is least with WSP Technology i.e only 0.49 lacs per year per MLD whereas maximum cost is incurred i.e. 6.65 lacs per yearper MLDwithMBR Technology.Energy costtoruntheplantisquitereasonablewhenSTPs are designed on SBR Technology (3.37 lacs per yearperMLD)andUASB+EATechnology(2.75per yearperMLD).ForSBRtechnology,repaircostis 1.85lacsperyearperMLDwhereasforASPand UASBtechnologies basedSTPs is nearly equal to 2.37and2.49lacsperyearperMLDrespectively.
Chart 6: Comparison of O&M cost of various technologies for STPs
2022, IRJET | Impact Factor value: 7.529 | ISO 9001:2008 Certified
International Research Journal of Engineering and Technology (IRJET) e ISSN: 2395 0056
Volume: 09 Issue: 06 | Jun 2022 www.irjet.net p ISSN: 2395 0072
Besidestreatmentcosts,theselectionofatreatmenttechnologymustbebasedontheanalysisofallkeyparametersasdiscussed, thenevaluatedandweighedagainstalternativetechnologiestoreachtoafinalrecommendation.Thevarioustechnologiesare assessedandrankedasLow,Medium,HighandVeryHighandisexhibitedinTable5
ASP MBBR SBR UASB + EA MBR WSP
1. Removal of BOD, COD, TSS High VeryHigh VeryHigh High VeryHigh Medium
2. FaecalColiformRemoval High VeryHigh VeryHigh High VeryHigh Low 3. NitrogenRemoval Low Medium VeryHigh Low Medium Low 4. Phosphorousremoval Low Medium VeryHigh Low Medium Low 5. AreaRequirement High Medium Medium High Low VeryHigh 6. EnergyRequirement High High Medium Medium VeryHigh Low 7. CapitalCost Medium Medium Medium Medium VeryHigh Low 8. RepairCost High Medium Medium High Medium Low 9. SkillRequirement High Medium High Medium VeryHigh Low
Fromtheabovestudy,itcanbeconcludedthatStabilizationPondandUASBarenotapplicablebecausetheycannotgivethe desiredtreatedwaterquality.Moreover,ActivatedSludgeprocessandMovingBedBioReactorprocess(MBBR)canproduce treatedwaterqualitybutitrequiresdownstreamfiltration.Theoverallsystembecomesexpensivefromcapitalandoperation pointofview.Membranereactorproduceseffluentofbetterquality.However,therunningandcapitalcostforplantbasedon MBRisextremelyhigh.Thus,onthebasisofabovestudyandmajorfactorssuchashighperformance,lowarearequirement andlowcapitalcostSBRtechnologyischosenasthemostappropriatetechnology.SBRTechnologycanproducethedesired qualityoftreatedwater.
[1] CrawfordG.(2010),”TechnologyRoadmapforSustainableWastewaterTreatmentPlantsinaCarbon ConstrainedWorld”, WERFReportSeries
[2] Jhansi, Mishra S.C (2013),” Wastewater Treatment and Reuse: Sustainability Options”, Journal of Sustainability Development,10(1),1 15.
[3] ManualonsewerageandSewageTreatmentSystem(2013),MinistryofUrbanDevelopment,NewDelhi,CPHEEO.
[4] Meena S.D(2021),”National Inventory ofSewageTreatmentPlants(2021)”,Central PollutionControl Board, 17 20, www.cpcb.nic.in
[5] MetcalfandEddyInc.,(2003),“WastewaterEngineering Treatment,DisposalandReuse”,4thEdition,TataMcGrawHill PublisherCo.Ltd.,NewDelhi.
[6] TareV.(2010),“SewageTreatmentinClassITowns:RecommendationsandGuidelines”,Report(Code003 GBP IIT EQP S&R O2 Ver1)
[7] WongburiP.et.al(2018),”DecisionmakingtoolsforselectingsustainablewastewatertreatmenttechnologiesinThailand”, EarthandEnvironmentalScience,Volume150,Issue1,pp.012013