International Research Journal of Engineering and Technology (IRJET) e ISSN:2395 0056

Volume: 09 Issue: 06 | June 2022 www.irjet.net p ISSN:2395 0072
International Research Journal of Engineering and Technology (IRJET) e ISSN:2395 0056
Volume: 09 Issue: 06 | June 2022 www.irjet.net p ISSN:2395 0072
1 Department of Computer Engineering, Government Polytechnic College, Cherthala, India 2,3,4 Department of Computer Engineering, College of Engineering, Cherthala, India ***
Abstract Ultrasound isoneofthediagnosticmethods used in breast cancer screening. Ultrasound patterns are known for being low cost and non invasive. The multiplicative speckle noise is a significant disadvantage of ultrasonography. Speckle noise reduces the usefulness of Breast Ultra Sound (BUS) images, lowering the test's efficiency. This research presents a new framework for reducingspecklenoiseandenhancingperformance.The Non Local Means (NLM) filter is used to minimize speckle noise, and then morphological techniques are used to enhance the noise reduced BUS images. When tested on real BUS images, themodelobtainsaPeakSignaltoNoiseRatio (PSNR)of 60 80dB.
Key words: Speckle noise, Breast Ultra Sound (BUS) images, ultrasonography, Non Local Means (NLM) filter, PeakSignaltoNoiseRatio(PSNR).
Image analysis entails extracting essential details with the least amount of human interaction possible [1 3]. The function of medical imaging systems in image processing entails the use of semi automated and fully automated algorithmsforfastandaccurateimageanalysis[4].Forthe diagnosis of human diseases and ailments, such as tumor detection, a wide range of imaging modalities can be used. These gadgets are made to take images of human inside organs in a non invasive manner. The ultrasound scan, often known as a sonogram, is one such instrument used for this purpose. It works by transmitting high frequency sound waves via a bodily part's tissues. It features transducersthatallowittoreceivesoundwaves,whichare then translated to electric impulses, allowing internal structuralimagestobedisplayedonacomputerscreen [5 6].
Machine learning, medical image classification methods, andpatternrecognitionmethodsmustallbeintegratedinto a multidisciplinary technology. To solve the obstacles
connected with detecting and classifying gynecological disorders, this technology must be pursued in partnership with domain specialists. Because lifetime training helps professionals acquire a plethora of information, computer based tools cannot replace human expertise. The hybrid technique is the most successful strategy for abnormality identification, and it can also improve patient care and management [7 9]. When creating a computer based tool, it'scriticaltokeepinmindwhyit'sbeingcreated.This tool must either be created with features that aid decision making, or it must be designed as standard software that facilitates the automatic extraction of features required by domain experts [10,11]. To create an intelligent decision support system model that can segment and identify the risks of malignant breast cancer early on, first identify the limits of existing approaches and try to mitigate their impacts. Ultrasound image restrictions can be divided into threecategories.Oneofthekeyrestrictionsthatcanhinder segmentation and feature extraction is speckle noise. By raising false instances and lowering the clarity of the Region of Interest (RoI) edge, speckle noise reduces segmentation accuracy. Speckle noise has resulted in ambiguousROItextureinformation,whichcan'tbeutilized to detect malignancy threats. As a result, creating or employing a suitable filter can help reduce speckle noise, making the work of segmentation and feature extraction much easier. Second, the artifact created by the machine canmakesegmentationchallenging.Finally,powerfultraits in determining the risk of malignancy may be difficult to come by. As a result, a model has been suggested that can beusedto:
1. Reduce speckle noise with the help of Non Local Means(NLM)filter.
2. Enhance the speckle noise reduced images by applyingvariousmorphologicaltreatments.
Before images are used in model training and inference, image preprocessing steps are required to format them. It
International Research Journal of Engineering and Technology (IRJET) e ISSN:2395 0056
Volume: 09 Issue: 06 | June 2022 www.irjet.net p ISSN:2395 0072
prepares the visual data for model input by cleaning it. It alsocutsdownonmodeltrainingtimeandspeedsupmodel inference.Iftheinputimagesareveryhuge,shrinkingthem will considerably reduce model training time without compromisingmodelperformance.
Various classical filters are used in all current works for BUSpreprocessing.Deeplearningwasusedforaportionof thestudy.
Themedianfilterisanonlineardenoisingfilterthatisoften used to remove noise from images[12]. Because of its efficacy and precision, it is the most widely utilized approach.
(1)
From Equation 1, A(x) and B(x) are the original image and thenoisyimagerespectively.
The adaptive median filter is applied to a rectangular area Sxy. During the filtering operation, it modifies the size of Sxy depending on the conditions given below. The median value in the 3 by 3 neighborhood around the corresponding pixel in the input images is storedineachoutputpixel.Theimages'edges,ontheother hand, are replaced with zeros [13]. The filter's output is a single value that replaces the current pixel value at (x, y), whereSiscurrentlycentered.
The average value of the intensities in each pixel's neighbourhoodissubstitutedforeachpixelusingthemean filter[14].Intermsofmeansquareerror,ithastheeffectof blurringandsmoothingtheimageandisthebestchoicefor additive Gaussian noise. The basic mean filter does not work in this situation because a speckled image is a multiplicativemodelwithnon Gaussiannoise[15].
The adaptive mean filters [14] have been developed to establish a balance between straightforward averaging in homogenous regions and all pass filtering wherethereareedgesinordertoreducetheblurringeffect. They locally adjust to the image's characteristics and remove speckles from particular areas of the image. They efficiently identify and maintain edges and features by using local image statistics including mean, variance, and spatialcorrelation.Bysubstitutingalocalmeanvaluethere, the speckle noise is eliminated. In comparison to mean filters, adaptive mean filters function better and typically lessenspeckleswhilemaintainingedges.
In order to create a uniform histogram, the histogram equalisation technique relates to redistributing the grey levels. In this instance, the integral of the image's histogram is used to replace each pixel [16]. Histogram equalisation is a technique for adjusting contrast in image processing that makes use of the histogram of the image. Theintensitiesonthehistogramcanbemoreevenlyspread by making this adjustment. This makes it possible to improve contrast in places with lower local contrast. By effectively distributing the most frequent intensity values, histogram equalisation achieves this. The technique works well in pictures where the foreground and background are bothdarkorbothbright.
Local contrast enhancement and histogram modification are processed in two stages by the Histogram Modified Local Contrast Enhancement (HM LCE) approach [17]. The capability of this contrast boosting methodology has been significantly increased to the expected level, and this histogram adjusted LCE technique offers better image contrast boosting in terms of both subjective and objective quality.
The Contrast Limited Adaptive Histogram Equalization (CLAHE) technique, a specific case of the histogram equalisation technique that adapts to the image to be enhanced [18] , is used during the contrast enhancement phase. The CLAHE approach was initially created for medical imaging and aims to lessen the noise andedgeshadowingeffectcausedinhomogeneousareas.
For images that have been harmed by blur and additive noise, the Wiener filter istheMean SquaredError (MSE) best stationary linear filter. The signal and noise processes must be assumed to be second order stationary inordertocalculatetheWienerfilter.
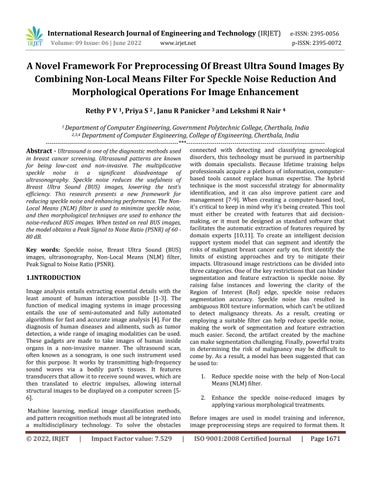
The suggested framework is depicted in Fig. 1 and comprises of two preprocessing methods, one for the improvementofimagesandtheotherfortheeliminationof specklenoiseinBUSimages.Thetechniquemostlyconsists oftwophases:
1. Speckle noise reduction using Non Local Meansfilter.
2. Imageenhancementthroughtheapplicationof severalmorphologicalprocesses.
Because pixel values can range from 0 to 256, the image must be normalised. A color code is represented by each
International Research Journal of Engineering and Technology (IRJET) e ISSN:2395 0056
Volume: 09 Issue: 06 | June 2022 www.irjet.net p ISSN:2395 0072
digit.Thecomputationoflargenumericvaluesmaybecome more difficult when using the image as is for additional processing.Wecannormalisethedatatofallbetween0and 1tolessenthis.
The quality of images is lowered by speckle noise, a granular noise that is present in all images by nature. Spatial correlated multiplicative noise is used to mimic specklenoise[19].Ateverylevel oftheacquisitionprocess, noiseisadded.
A crucial preprocessing step for the extraction of characteristics, analysis, and recognition from measurements of medical ultrasound images is speckle reduction.Sincetheyeliminatethehighfrequenciesandso tend to smooth off the edges of the image, commonly used linear low pass filters, such the mean filters, are not ideal forreducingthespecklenoiseofultrasoundimages.
Equation 2 provides the gamma distribution followingspecklenoiseas ⁄ (2)
Speckle impairs the clarity of ultrasound images and lessens a human observer's capacity to distinguish betweenminutedetailsduringadiagnosticexamination.
wherethevarianceis 2αandgisthegraylevel.Oneofthe spatial domain filters is the non local means filter. In Non local means filtering, a single pixel is reconstructed by averaging every observed pixel. A proposed the non local means algorithm for noise removal by Buades et al. [20][21].Givenadiscretenoisyimagev= ,the estimated value NL[v](i), for a pixel i is computed as a weightedaverageofallthepixelsintheimageandisstated asinEquation3as ∑
(3)
where the weights { w(i,j) }j depend on the similarity betweenthepixelsiandj,andtheconditions0≤w(i,j)≤1 and ∑ aresatisfied.
Two pixels i and j are similar if the intensity gray levelvectorsv(Ni)andv(Nj)aresimilar,whereNk denotesa square neighborhoodoffixedsizeandcenteredatapixelk. This similarity is measured as a decreasing function of the weighted Euclidean distance ‖ ( )‖ where a > 0 is the standard deviation of Gaussian kernel. When used in noisy neighbourhoods, the Euclidean distance raises the equalityshownbyEquation4as
E‖ ( )‖ =‖ ( )‖ (4)
Theweightsaredefinedas ‖ ( )‖ whereZ(i)isthenormalizing constant
∑ ‖ ( )‖
and the parameter h acts as a degree of filtering. It regulates the exponential function's decay, and as a result, weights' decline as a function of Euclidean distances. This
International Research Journal of Engineering and Technology (IRJET) e ISSN:2395 0056
Volume: 09 Issue: 06 | June 2022 www.irjet.net p ISSN:2395 0072
technique has the advantage of maintaining image details whiledenoising.
The next stage, a morphological process for image improvement, receives the speckle noise reduced BUS image. The mathematical morphology method uses an object's structural advantages. These methods abstract the componentsofanimageandemployrelationshipsbetween classes to describe the form of zones. They rely on mathematical ideas. Theinputfor morphological operators is two sets of data, and they are non linear. The original imageisincludedinthemainset,whilethefinalonelabels the structural component known as the mask. The mask will be a matrix of zeros and ones, whereas the original image is in the form of a binary or grey level. A new value foreachandeverypixel isobtainedbyslidingthemask on the original image after applying the final image to the morphological operators. Each mask's value one denotes efficacy, while its value zero denotes final image competencies. A mask can be created using the modified formats.
IfS(p,q)and T(k,l)representsthegray level imageand the structural element matrices respectively, erosion and dilation operators are defined [22] as stated by Equations (5)and(6):
The erosion operator reduces the size of the objectsbutenlargestheholesintheimageandremovesthe fine detail of that image. The finished image seems darker thantheoriginalimageafterbrightregionsbelowthemask are removed. The dilation operator performs in reverse, enlarging and contracting the size of image objects and holes.TheclosingoperatorperformsinreverseasEquation 8, whereas the opening operator corresponds to the presentation of the erosion and dilation operations on the sameimageasEquation7.
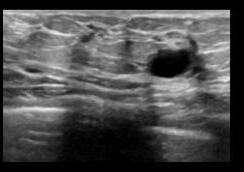
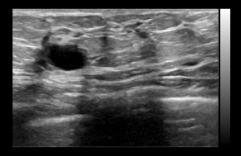
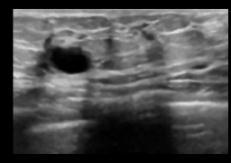
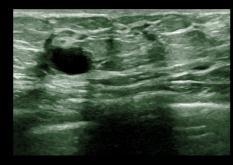
TheBreastUltrasoundImagesDatasetfromKaggle isused for the experiment [23] Breastultrasoundscansof women between the ages of 25 and 75 are part of the baseline data collection. This information was gathered in 2018.Thereare600femalepatientsinall.Withanaverage image size of 500x500 pixels, the collection comprises of 780 images. The majority of ultrasound (US) images are grayscale.AtBaheyaHospital,theyweregatheredandkept in a DICOM format. The images were gathered and annotatedoverthecourseofaboutayear.TheUSdatasetis divided into three categories: benign, malignant, and normal.
1100 images have been gathered up until that point. The dataset's number of images was halved to 780 images after preprocessing. The original images have insignificantinformationthatcannotbecategorisedinbulk. Additionally, they could have an impact on the training process' output results. The LOGIQ E9 ultrasound system and the LOGIQ E9 Agile ultrasound system are the tools utilisedinthescanningprocedure.Thesetoolsaretypically employed in high quality imaging for applications in radiology, cardiology, and vascular care. They generate imageswitha1280x1024resolution.TheML6 15 DMatrix linear probe has 1e5 MHz transducers. PNG files make up theimages.
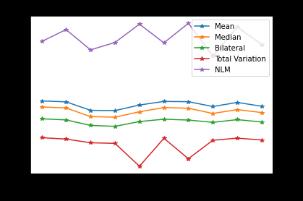
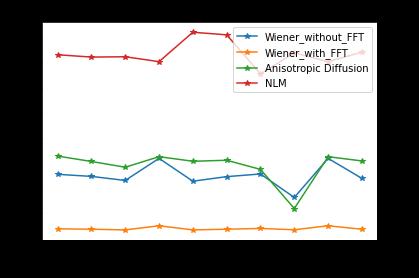
We compared the suggested method to different preprocessingmethodsinordertovalidateit.Byemploying multiple filtering approaches, the preprocessing technique used in this study effort reduces unnecessary noise and improvestheimagequality.Thisstudyemploysavarietyof imagefilteringalgorithms,includingWiener,Mean,Median, Bilateral,AnisotropicDiffusion,Non LocalMeansandTotal Variation. The findings are studied and compared to a standardnoisepattern,aswellasratedintermsofquality. The goal of this study is to focus on selecting the proper
(5) (6) (7) (8)
filtering algorithms and reducing noise by taking into account the type of breast ultrasound images. The used preprocessing strategy not only saves time, but it also compares the seven types of filters and looks for the best
TheapproachwaswritteninPythonandtestedon the Google Colab environment to speed up the process. A comparison of various filters for speckle noise reduction is carried out. The easiest way to compare preprocessing algorithms honestly is to set a benchmark and evaluate them using a widely accepted criterion. Unfortunately, thereisverylittlepublishedresearchinthefieldofmedical imagesegmentationthatcomparesdifferentmethodsfairly.
International Research Journal of Engineering and Technology (IRJET) e ISSN:2395 0056
Volume: 09 Issue: 06 | June 2022 www.irjet.net p ISSN:2395 0072


Even if a method can generate promising results using its own database, it's difficult to say how good it is without peer comparison. As a result, we statistically assess the outcomes using numerous metrics (MSE, PSNR,SSIM,AMBE and SAM in this case), which quantify performance across multipledimensions.
The method's implementation is tested on ten random BUS images. Various denoising filters were used, including Wiener filter without Fast Fourier Transform (FFT),WienerwithFFT,Meanfilter,Medianfilter,Bilateral filter, Anisotropic Diffusion filter and Total Variation filter with the outcome indicating that the proposed method for specklenoisereductionoutperformsallothers.
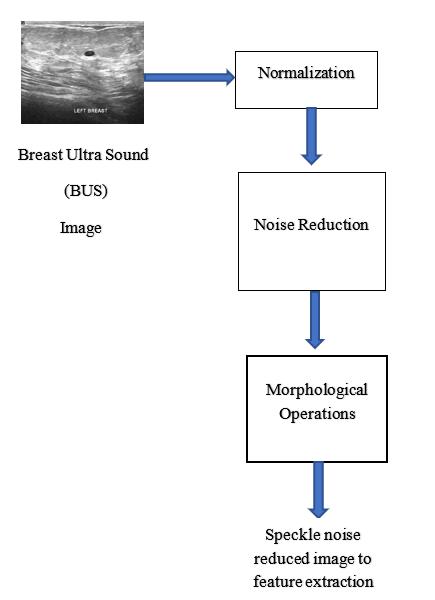
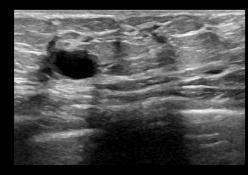
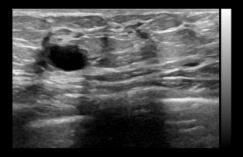
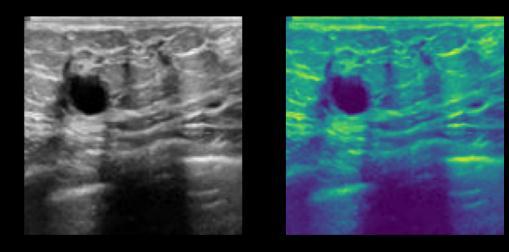
applyingMeanFilter,theresultisshowninFigure2(d).The outcome of the Median Filter is shown in Fig 2(e). Figure 2(f) depicts the outcome of using the Bilateral filter, while Figure 2(g) depicts the result of using the Anisotropic Diffusion filter, Figure 2(h) portraits the result of Total Variation filter and Figure 2(i) shows the result of NLM filter.
Theperformanceofseveraldenoisingfiltersiscompared inChart1,anditisobviousfromthegraphplotthatthe NLMfilteroutperformsallothers.
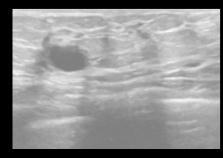
TheoriginalBUSimageisdisplayedinFigure2(a). The output of a Wiener Filter without FFT is shown in Figure2(b),whichusesa3x3kernel.Theresultofapplying the Wiener filter with FFT is shown in Figure 2(c). After
Chart1:PSNRcomparisonofvariousdenoisingfilters
One of the most essential criterion for denoising filters is the determination of performance metrics for image preprocessing algorithms. There are a variety of performance metrics that may be used to evaluate the effectiveness of a noise removal method; in this study, metricsincludingMeanSquareError(MSE),Peak Signal to Noise Ratio (PSNR), and Structural Similarity Index (SSIM) areemployed.
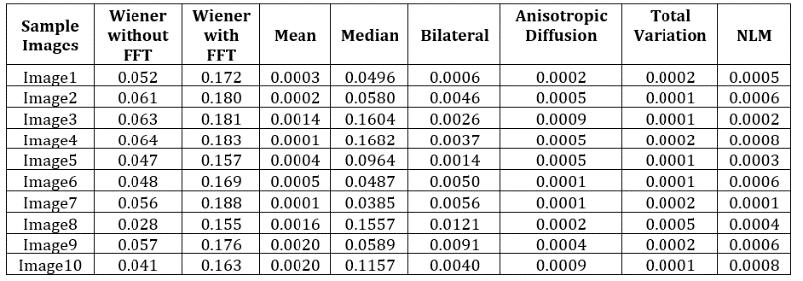
The Mean Square Error (MSE) is a popular performance indicatorfordeterminingimagequality.Itsimplyconsiders the difference between the pixel value and the deformed image,notthepixelsinthesurroundingarea.
MN is the image dimension, where I(x,y) is the original picture and I'(x,y) is the distorted image, according to Equation (9). The highest MSE number is 255, which indicates that the image is of very poor quality, while the lowestMSEvalueshowsthattheimageisofgreatquality.
International Research Journal of Engineering and Technology (IRJET) e ISSN:2395 0056
Volume: 09 Issue: 06 | June 2022 www.irjet.net p ISSN:2395 0072
ThecomparisonanalysisbasedonMeanSquaredError (MSE)isshowninTable1.
Where l(x,y) , c(x,y) and s(x,y) represents the luminanace, contrast and structural terms.
Table1:Comparativeanalysisofvariousdenoisingfiltersforthe BUSImages(measure:MSE)
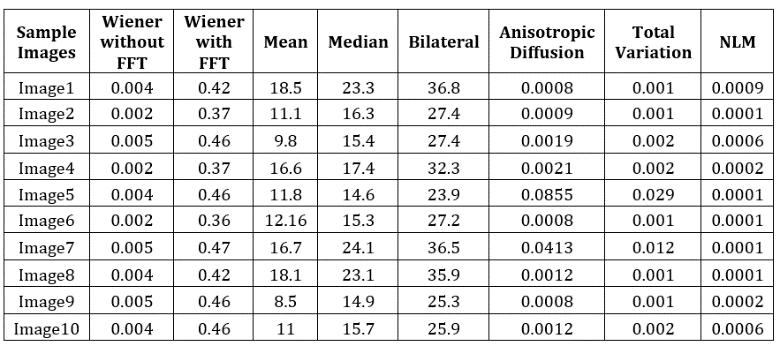
Thepeaksignaltonoiseratio(PSNR)isadecibel based ratiothatcomparesthemaximumsignalpowertothe maximumnoisepower.
log 10(MAX i) 10.log10(MSE) (10)
From Equation (10), MAXi is the possible number of pixel value.ThecomparisonstudyusingPSNRisshowninTable 2.
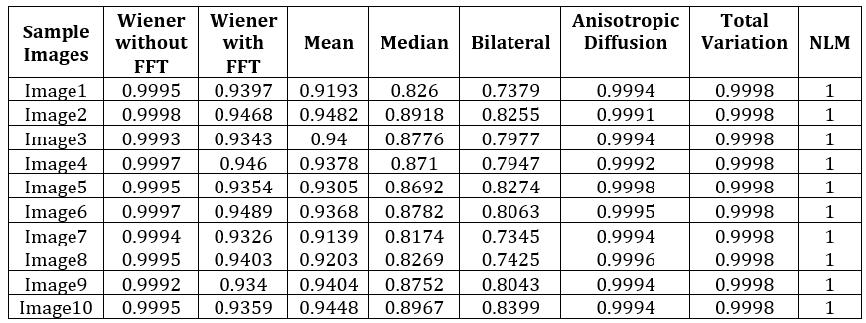
Table3:Comparativeanalysisofvariousdenoisingfilters fortheBUSImages(measure:SSIM)
Table3showsthecomparativeanalysisbasedonStructural SimilarityIndex(SSIM).
(iii)
To judge the performance in keeping the original brightness, an objective measurement is proposed. The absolute difference between the input and output image's mean AMBE = E(X) E(Y) is referred to as absolute mean brightness error (AMBE) and is defined as the absolute differencebetweentheinputandoutputimage'smean.The input and output images are denoted by X and Y, respectively. A lower AMBE suggests that the brightness has been kept more effectively [24]. Table 4 shows the comparative analysis based on Absolute Mean Brightness Error(AMBE).
Table2:Comparativeanalysisofvariousdenoisingfilters fortheBUSImages(measure:PSNR)
The Structure Similarity Indicator (SSIM) is a quality assessmentindexthatisbasedonthecomputationofthree terms: brightness, contrast, and structural. As seen in Equation(11), the overall index is a multiplicative combinationofthethreeterms, SSIM(x,y)=[l(x,y)]α [c(x,y)]β [s(x,y)]γ (11)
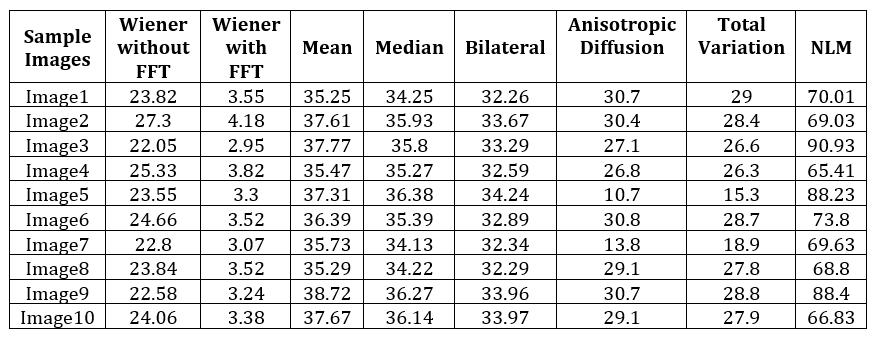
Table4:Comparativeanalysisofvariousdenoisingfilters fortheBUSImages(measure:AMBE)
(iv)
SAMcalculatesaspectralanglebetweentwospectral vectorswiththesameorigintoresolvespectralsimilarity. Equation(12)isusedtocalculatethelengthofaspectrum vectorLρ Lρ=√∑ (12)
International Research Journal of Engineering and Technology (IRJET) e ISSN:2395 0056
Volume: 09 Issue: 06 | June 2022 www.irjet.net p ISSN:2395 0072
Thespectralangle(θ)iscalculatedasinEquation(13): θ= (∑ ) (13)
where Lρ is the length of the endmember vector [25] and isthelengthofthemodeledspectrumvectorcalculated usingEquation.(12)
The error metric for SAM is the spectral angle. A modelled spectrum is categorised as belonging to the endmember class if its spectral angle is less than a user defined threshold.
Table5:Comparativeanalysisofvariousdenoisingfilters fortheBUSImages(measure:SAM)
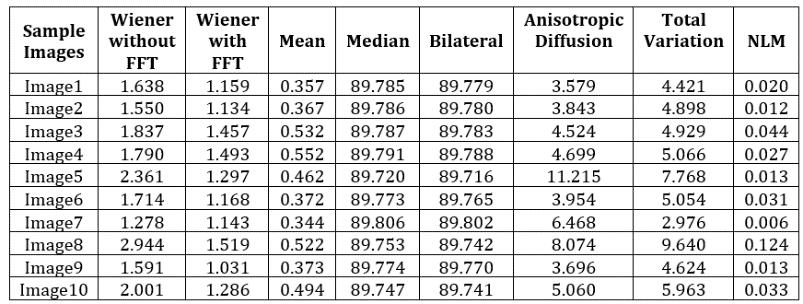
Table 5 shows the comparative analysis based on Spectral AngleMapper(SAM).
The speckle denoised image of BUS is provided as input to various morphological processes for contast augmentation in the second phase. Image components that are important in the representation and description of region form are extracted using morphological techniques. Morphological operations are a set of basic tasks that are reliantonthegeometryoftheimage.It'susuallydonewith binaryimages.Itrequirestwodatasources,oneofwhichis the input image and the other of which is the structuring component. Morphological operators use two inputs: an imageandastructuralcomponent,whicharesubsequently combinedusingsetoperators.Theitemsintheinputimage are processed based on the structuring component's encodedpropertiesoftheimage'sshape.
Opening is comparable to erosion in that it removes bright foreground pixels from the margins of foreground pixels regions. The operator's effect is to protect foreground pixels that are identical to the structuringcomponent,orthatcancompletelyencapsulate
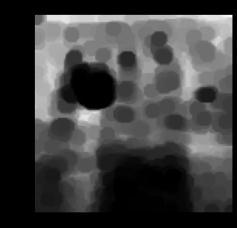
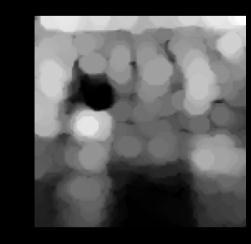
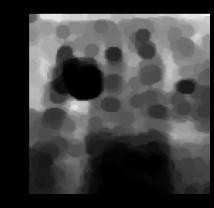
the structuring component while removing all other foreground pixels. An image's internal noise is removed using the opening technique. The first step in the opening processiserosion,followedbydilation. (a) (b) (c) (d) Fig3.(a)NLM denoisedBUS image andBinarized image (d)Dilation operation
(b)Multi erodedimage (c) Opening operation
The NLM denoised image and its associated binarized image are shown in Figure 3(a). Figure 3(b) depicts the outcome of repeated erosion operations. The majority of superfluous artefacts and artefacts are eroded withsuccessiveerosion.
The result of the opening procedure, followed by erosion, is shown in Figure 3 (c). The remaining noise was removed using the opening procedure while the image's essentialfeaturewaspreserved.
The size and shape of the artifacts have shrunk as a result of the successive erosion. Apply consecutive dilation with the same number of times erosion is applied to roughly recover their size. Furthermore, the same structuring elementisusedtoensurethatthecontourofthefeaturesis restored as closely as feasible to the original. The result of thedilationprocedureisshowninFigure3(d).
International Research Journal of Engineering and Technology (IRJET) e ISSN:2395 0056
Volume: 09 Issue: 06 | June 2022 www.irjet.net p ISSN:2395 0072
Inthispaper,welookintoBreastUltrasoundimage preprocessing and suggest a new framework for it. Two processes make up the proposed preprocessing method: speckle noise reduction and contrast enhancement. Many alternative speckle reduction strategies are investigated, and one is used as a preprocessing step in this study. The suggested method outperforms previous BUS image preprocessing methods utilising the same database, proving its superiority. Various performance measures are alsoinvestigated.
The following are some of the benefits of the proposed method:
1.Itisentirelyautomated.
2.Italsoworksnicelywithlow contrastBUSimages.
3. It outperforms other classic denoising filters and other pictureenhancementapproachesintermsofaccuracy.
4. The proposed method takes roughly 20 seconds to analyse.
5.Theproposedapproachisquitestable.
The PSNR values of some BUS images were less than 50dB, which is a shortcoming of the suggested approach.Thisissuewillbeinvestigatedmoreinthefuture. Another potential approach is to apply this technology to other applications like echocardiography and prostate ultrasonography, among others. Because this method is based on ultrasound imaging properties, it should be simpletoadapttovariousultrasoundimages.Theapproach will also be used to segment and classify BUS images into normal,benignandmalignantcategoriesinthefuture.
1. Wein, W., Brunke, S., Khamene, A., Callstrom, M.R. and Navab, N., 2008. Automatic CT ultrasound registration for diagnostic imaging and image guidedintervention.Medicalimageanalysis,12(5), pp.577 585.
2. Rundo,L.,Militello,C.,Vitabile,S.,Russo,G.,Sala,E. and Gilardi, M.C., 2020. A survey on nature inspired medical image analysis: a step further in
biomedical data integration. Fundamenta Informaticae,171(1 4),pp.345 365.
3. Abd Ghani, M.K., Mohammed, M.A., Arunkumar, N., Mostafa, S.A., Ibrahim, D.A., Abdullah, M.K., Jaber, M.M., Abdulhay, E., Ramirez Gonzalez, G. and Burhanuddin, M.A., 2020. Decision level fusion scheme for nasopharyngeal carcinoma identification using machine learning techniques. NeuralComputingandApplications,32(3),pp.625 638.
4. Mohammed, M.A., Al Khateeb, B., Rashid, A.N., Ibrahim, D.A., Abd Ghani, M.K. and Mostafa, S.A., 2018. Neural network and multi fractal dimension features for breast cancer classification from ultrasound images. Computers \& Electrical Engineering,70,pp.871 882.
5. Asgari Taghanaki, S., Abhishek, K., Cohen, J.P., Cohen Adad, J. and Hamarneh, G., 2021. Deep semantic segmentation of natural and medical images: a review. Artificial Intelligence Review, 54(1),pp.137 178.
6. Mahapatra, D., Bozorgtabar, B. and Garnavi, R., 2019. Image super resolution using progressive generativeadversarialnetworksformedicalimage analysis. Computerized Medical Imaging and Graphics,71,pp.30 39.
7. Arunkumar, N., Mohammed, M.A., Abd Ghani, M.K., Ibrahim, D.A., Abdulhay, E., Ramirez Gonzalez, G. and de Albuquerque, V.H.C., 2019. K means clustering and neural network for object detecting and identifying abnormality of brain tumor. Soft Computing,23(19),pp.9083 9096.
8. Obaid, O.I., Mohammed, M.A., Ghani, M.K.A., Mostafa, A. and Taha, F., 2018. Evaluating the performanceofmachinelearningtechniquesinthe classification of Wisconsin Breast Cancer. InternationalJournalofEngineering&Technology, 7(4.36),pp.160 166.
9. Arunkumar, N., Mohammed, M.A., Mostafa, S.A., Ibrahim, D.A., Rodrigues, J.J. and de Albuquerque, V.H.C., 2020. Fully automatic model‐based segmentation and classification approach for MRI brain tumor using artificial neural networks. Concurrency and Computation: Practice and Experience,32(1),p.e4962.
International Research Journal of Engineering and Technology (IRJET) e ISSN:2395 0056 Volume: 09 Issue: 06 | June 2022 www.irjet.net p ISSN:2395 0072
10. England, J.R. and Cheng, P.M., 2019. Artificial intelligenceformedical imageanalysis:a guidefor authors and reviewers. American journal of roentgenology,212(3),pp.513 519.
11. Blum, D., Liepelt Scarfone, I., Berg, D., Gasser, T., la Fougere, C. and Reimold, M., 2019. Controls based denoising, a new approach for medical image analysis, improves prediction of conversion to Alzheimer’s disease with FDG PET. European Journal of Nuclear Medicine and Molecular Imaging,46(11),pp.2370 2379.
12. Devarajan, G., Aatre, V.K. and Sridhar, C.S., 1991, January. Analysis of median filter. In ACE'90. Proceedings of [XVI Annual Convention and Exhibition of the IEEE In India] (pp. 274 276). IEEE.
13. Nagi, J., Kareem, S.A., Nagi, F. and Ahmed, S.K., 2010, November. Automated breast profile segmentation for ROI detection using digital mammograms. In 2010 IEEE EMBS conference on biomedicalengineeringandsciences(IECBES)(pp. 87 92).IEEE.
14. Cheng, H.D., Shan, J., Ju, W., Guo, Y. and Zhang, L., 2010. Automated breast cancer detection and classification using ultrasound images: A survey. Patternrecognition,43(1),pp.299 317.
15. Maitra,I.K.,Nag,S.andBandyopadhyay,S.K.,2012. Technique for preprocessing of digital mammogram.Computermethodsand programsin biomedicine,107(2),pp.175 188.
16. Thangavel, K. and Roselin, R., 2009. Mammogram mining with genetic optimization of ant miner parameters.InternationalJournalofRecentTrends inEngineering,2(3),p.67.
17. Sundaram, M., Ramar, K., Arumugam, N. and Prabin,G.,2011.Histogrammodifiedlocalcontrast enhancement for mammogram images. Applied softcomputing,11(8),pp.5809 5816.
18. Daskalakis, A., Cavouras, D., Bougioukos, P., Kostopoulos, S., Georgiadis, P., Kalatzis, I. and Nikiforidis, G., 2007, July. An efficient CLAHE based, spot adaptive, image segmentation technique for improving microarray genes’
quantification. In 2nd International Conference on Experiments/Process/System Modelling/SimulationandOptimization.
19. Dass, R., 2018. Speckle noise reduction of ultrasound images using BFO cascaded with wiener filter and discrete wavelet transform in homomorphic region. Procedia computer science, 132,pp.1543 1551.
20. Wilson,B.andDas,J.P.,2013.Asurveyofnon local means based filters for image denoising. International Journal of Engineering Research & Technology,2(10),pp.3768 3771.
21. Buades, A., Coll, B. and Morel, J.M., 2005. A review of image denoising algorithms, with a new one. Multiscale modeling & simulation, 4(2), pp.490 530.
22. Mehena, J., 2013. Medical images edge detection based on mathematical morphology. Journal of Computer and Communication Technology: Vol, 4(1),p.2.
23. Khaled, A.D.W.G.M., 2020. H Fahmy A. Dataset of breast ultrasound images Data Brief, 28(104863), pp.10 1016.
24. Chen, S.D. and Ramli, A.R., 2004. Preserving brightness in histogram equalization based contrast enhancement techniques. Digital Signal Processing,14(5),pp.413 428.
25. Dennison, P.E., Halligan, K.Q. and Roberts, D.A., 2004. A comparison of error metrics and constraints for multiple endmember spectral mixture analysis and spectral angle mapper. Remote Sensing of Environment, 93(3), pp.359 367.