International Research Journal of Engineering and Technology (IRJET) e ISSN: 2395 0056

Volume: 09 Issue: 06 | June 2022 www.irjet.net p ISSN: 2395 0072
International Research Journal of Engineering and Technology (IRJET) e ISSN: 2395 0056
Volume: 09 Issue: 06 | June 2022 www.irjet.net p ISSN: 2395 0072
Abstract The extreme flood events are always a chapter of concern all told river basins, among loss of property, lives and economics. Estimation of flood peak discharge for a desired return period is pre requisite for geographical region management, design and execution of structures like bridges, culverts, dams, etc. Hence flood frequency analysis is important to predict the flood peaks of various returnperiods. Estimation of flood magnitude is predicated on probability of flood events. Most important method utilized to estimate intensity of flood magnitude is Flood FrequencyAnalysis. Four statistical techniques namely Generalized Extreme Value (GEV), Log Pearson III (LPIII), Gumbel Max, and Gaussian distribution are evaluated in present study for measuring severity of flood. To estimate return period of flood, four gauging stations of River Meenachilriverthat'sKidangoorare deemed for this work. The flood peak value is completedfor2 , 10 , 50 , and 100 year where computed and further extra polagion may be done to search out out the flood discharge of any return period. The analysis used 34 years of knowledge (1985 2018) to model annual maximum discharge. Peak discharges are found out from daily discharge data at kidangoor gauging station with different return period starting from 2 , 10 , 50 and 100 year and a comparison has been made for locating best fit model. Goodness of fit test are used at 5% significance level. Outcomes signify that Gumbel Max is best fitted distribution ranked as 1st, whereas LP III, GEV and Gaussian distribution are observed to be least fitted in 2nd, 3rd and 4th order, respectively. The plots of return period versus stream flow and reduced variate versus flood peak showed that the Gumbel’s extreme value distribution is suitable for predicting the expected flood flow in Meenachil River. Here, sensitivity analysis is taken into account representing a sign of flood warning. Significance of current study lies in its potential for predicting discharge supported return period after finding an appropriate distribution for sites under study.
Keywords: Generalized Extreme Value, Log Pearson III, Gumbel Max, Normal distribution, Goodness of fit, Return period.
Flood is one altogether the devastating natural disasters which occur in India once a year during the south west
monsoon season. In planning and magnificence of water resourcesprojects,it'simportanttofigureoutthemagnitude and frequency of flood which is ready to occur within the projectarea.Floodfrequencyanalysisisthatthestrategyof fitting a probability model to annual flood peak data recordedoveraperiodofobservationatacatchmentoutlet. Themodelparametersthusestablishedcanthenbewontto predictthefloodpeaksofdesiredreturnperiod.Meenachil River show the threat of wide spread illegal sand mining.Previouslythebanksoftheriverweresubstantially enrichedwithsands.Nowthebanksoftheriverarefullof grassesanddirt.Thedepthofriverisincreasingdaybyday becauseofthisillegalsandmining.Thesewagepollutionis additionally another menace of the river. This river isn't exceptional to annual floods during monsoon and causing destruction to the ultimate public. Meenachil River is incrediblydangerousandwildduringfloodseasonthanksto thedepthofriver.Intensefloodandeventafterpeakflood provides important statistics for hydrologic design. To estimate the magnitude of flood several methods like rational method, empirical method, unit hydrograph, and floodoccurrencestudyareadoptted..Forreducingdamages caused by flood and protect human lives, generally flood modeling is dispensed for estimating flood linked with concernedreturnperiods,whichisbelievedasdesignflood. Estimationofdesignfloodissignificantforvariouspurposes which contains management of flood plains, planning and developmentcontrols,floodinsurancestudiesandelegance ofhydraulicstructures.Amongseveralmethodsaccessible for estimating design flood, the foremost direct method is that the at site FFA. additionally, it is a benchmark for assessing accurateness of other methods applicable for estimatingfloodthesameastherainfallrunoffmodelingand regional flood estimation technique. The aim of FFA is to estimate return period associated with a specified magnitude of flood. Reasonably, at site FFA needs an extendedperiodofcollectedriverflowdata.Asaccessible recordeddatalengthiswaysmalleratseveralgaugedrivers thanspecifiedreturnperiod,designfloodestimationoften necessitatescertaindegreeofextrapolation.InFFA,selecting a probability distribution is of major significance as an incorrectselectionmayleadtosubstantialbias.
Flood frequency analysis may well be a way employed by hydrologists to predict flow values resembling specific returnperiodsorprobabilitiesalongariver.theapplianceof
International Research Journal of Engineering and Technology (IRJET) e ISSN: 2395 0056
Volume: 09 Issue: 06 | Jun 2022 www.irjet.net p ISSN: 2395 0072
statisticalfrequencycurvestofloodswasfirstintroducedby Gumbel. Using annual peak flow data that's available for formofyears,floodfrequencyanalysisisusedtocalculate statistical information like mean, variance and skewness which is further accustomed create distribution graphs. Floodfrequencyplaysacrucialroleinprovidingestimatesof recurrenceoffloodswhichisutilizedindesigningstructures like dams, bridges, culverts, levees, highways, disposition plants,waterworksandindustrialbuildings.soonguagethe optimumdesignspecificationforhydraulicstructures,andto forestallover designingorunderdesigning,it'simperative tousestatisticaltoolstocreatefloodfrequencyestimates. These estimates are useful in providing a measurement parametertoanalysethedamagelikespecificflowsduring floods. along with hydraulic design, flood frequency estimates are also useful overflowing insurance and flood zoningactivities.Accurateestimationoffloodfrequencynot onlyhelpsengineersindesigningsafestructuresbutalsoin protectionagainstlossesineconomicduetomaintenanceof structures.swollen frequency analysis the target is to estimateafloodmagnitudekindoflikeanyrequiredreturn periodofoccurrence.Theresultingmagnitude returnperiod relationship are cited because the Q T relationship. the targetoffloodfrequencyanalysis(FFA)istoassociateflood intensity with a probability of exceedance. Many methods arecurrentlyemployedfor this,rangingfromdistribution fitting to simulation approaches. Many hydrological engineering planning, design, and management problems requireadetailedknowledgeoffloodeventcharacteristics, like flood peak, volume and duration.Flood frequency analysis often point on flood peak values, and hence, provides a limited assessment of flood events.The importanceoffloodfrequencyliesinitsabilitytopredictthe dischargeforareturnperiodafterasuitabledistributionis found for an area. Extremely great floods are among environmental events with the foremost disastrous consequencesfortheentireworld.Estimatesoftheirreturn periods and elegance values are of great importance in hydrologic modelling, engineering practice for water resourcesandreservoirsdesignandmanagement,planning for weather related emergencies, etc. Regional flood frequency analysis resolves the matter of estimating the extreme flood events for catchments having short data recordsorungaugedcatchments.Floodfrequencyanalysisis furthershowntopossessattractivefeaturesforestimating extremesforunusualsitesduringaverynetworkofgauging stations.
Abinash Sahoo, Dileep K. Ghose [1] This work is administratedinfoursensitivegaugingstationsofMahanadi geographicregionconsideringhydrologicaldata.GEV,LP III, Gumbel Max and Gaussian distribution methods are employedforpredictingfloodfrequencyandarelationshipis establishedtoseekoutoutpeakdischargeduringmonsoon
period. Flood plain of Mahanadi geographical region is interferedbetweentwostatesChhattisgarhandOdisha,and4 gauging stations are politically sensitive to encourage the encroachmentofillegalconstructionofhydraulicstructures. withinthepresentstudy,thestraightforwardfitsoftwareis employed for locating goodness of fit and also the effectivenessofproposedprobabilitydistributionmethods. it'sobservedthatconsiderationofthestatisticaldistribution withlowerrangeofprobabilitytriggerwarningsearlierto sensitive gauging stations. The statistical approaches are acceptable tune the magnitude of flood with frequency distributionTheresearchresultsalsocanbeusedfor2Dand 3D flood modeling. The extent of simulated flood may be recommended for control and hazard assessment of Mahanadigeographicarea.
Khan Mujiburrehman Environmental Engineer, Dar Al Handasa,Makkah[2]Thispresentsafrequencydistribution studyonmaximummonthlyflooddataonNarmadaRiveris conducted.TheNormal,Lognormal,LogpearsontypeIIIand Gumbell extreme value type I are proposed and tested togetherwiththeirsingledistributionstoidentifytheoptimal model for maximum monthly flood analysis. Normal distribution curve has been identified as the best fitting distributionforflooddatainNarmadaRiveratGarudeshwar station. The estimation for the best fitting distribution for Maximum monthly flood data amount has been the main interest in several studies. Various forms of distributions havebeentestedinordertofindthebestfittingdistribution. Differenttypesofgoodnessof fittestshavebeenattempted in this study. the Normal distribution curve has been identified as the best fitting distribution for flood data in NarmadaRiveratGarudeshwarstation.However,theflood data should be further analyzed andcorrected for missing data,historicaldataandZerofloodvalues.
M.Ramasamya,S.Nagana,P.SenthilKumarb,c,[3]Inthis study, peak flood flow data for the periods of twenty four years of daily flow measured in stepped weir. It is having advantages of measuring accurate discharge during the differentelevationsofflowaccordingtotheseasonalchanges and monsoon conditions in the river basin and catchment area.ThegaugingstationislocatedneartheVaigaireservoir atAndipattiinThenidistrict,TamilNadu,India,thereservoir waterisusefulforhydropowergeneration,irrigation,small scaleindustriesanddrinkingforfourdistrictsinTamilNadu. Twomethodsareusedinpredictingthefutureexpectedflood dischargeinthegaugingstationfordifferentreturnperiods of5,10,50,75,100,and1000.AmongsixdifferentTvalues,the firsttwoshortfrequenciesofevents5and10twomethods showcomparativelythesameresults.Assuch,theextended RPvaluesof50,75,100,and1000,thepredictedmagnitudes show high variation. In the case of LLRGM indicates the constant rate of increase of flood magnitudes for different length of RP and merely a straight line extended for the longer duration since suchdirect proportionality does not
International Research Journal of Engineering and Technology (IRJET) e ISSN: 2395 0056
Volume: 09 Issue: 06 | Jun 2022 www.irjet.net p ISSN: 2395 0072
existanditsaccuracymainlydependsonR2values.Inthis case,itis0.8904.Ifthisvalueis1anditisassumedtobethe highlycorrectmagnitude.Itismeasuredthatthemaximum dailypeakflowmeasured8.7595×102(cumecs)intheyear 1998,andthepredictedRPof5,10,50,and75magnitudesare already existing in the record, and even the RP of 100 magnitudesisverycloserthisvalueof8.970×102(cumecs).
Sandeep Samantaray and Abinash Sahoo [4] during this paper,anendeavorhasbeenmadetoforecastdischargesat variousreturnperiodsusingstatisticalmethods.Here,four statistical methods are accustomed predict flow discharge within the Mahanadi geographical area, covering four stations.Fourorganizationmethods,namely,Normal,LPIII, Gumbelmax,andGen.extremevaluemethodareemployed here.supportedthetrendsofthelast60years,theutmost and minimum discharges are found at 150 years and 10 years’ return period, respectively. the speed of increase of dischargeisextremelyhighattheinitialreturnperiodsand soitbecomesconstantandeventuallylower.Theshapesof thegraphsarecommoninnatureandmostofthetimethey aredoingnotintersectwithoneanother.Inmostofthecases, GumbelmaxgivestheheightfloodFigure4|Confidenceband for monsoon season of gauging stations (a) Rampur, (b) Sundargarh,(c)Jondhra,and(d)Basantpur.TheGumbelmax isthatthemostgenerallyusedmethodtogetflooddischarge asthismaybeusedforinfinitesamplesizes.Theinfluencing factoroffrequencyisanalyzedonthepremiseofresearchof therunoffcomplexityfromdrainagebasins.
Nirman Bhagat [5] during this paper flood frequency analysis disbursed for Lower Mahi River using 30 year’s annual peak flow data.Graph showsa plotofthe reduced variate and peak flood of the river using the observed data.Fromthelineequation,R2givesaworthof0.9649.the worth r = 0.9649 shows that the pattern of the scatter is narrowwhichGumbel’sdistributionmethodissuitablefor predicting expected flow within the river.Also the instantaneous mean flow within the river is 10242 m3 /s which has a return period of about 2 years and it's visiblewithin the flood peak data also. this implies the predictionoffloodswithinthebasinissortofaccurate.This prediction of flood will be utilized within the designing of importanthydraulicstructuresandbridgeswithintheriver reach. Also just in case of utmost floods emergency evacuation of individuals will be distributed well before. Similarstudycanevenbedisbursedonanotherstudyregion, because the method used for the study has a continuing formula,whichremainsspatiallyconstant.
BahramSaghafian,SaeedGolian,AlirezaGhasemi[6]Flood frequencyapproachesvaryfromstatisticalmethods,directly applied on the observed annual maximum flood series, to adoptingrainfall runoffsimulationmodelsthattransform design rainfalls to flood discharges. Reliance on statistical floodfrequencyanalysisdependsonseveralfactorslikethe
chosenprobabilitydistributionfunction, estimationofthe function parameters, possible outliers, and length of the observed flood series. Through adopting the simulation approachduringthispaper,watershed averagerainfallsof assortedoccurrenceprobabilitiesweretransformedintothe corresponding peak discharges employing a calibrated hydrologicalmodel.AMonteCarloschemewasemployedto contemplate the uncertainties involved in rainfall spatial patternsandantecedentsoilmoisturecondition(AMC).For any given rainfall depth, realizations of rainfall spatial distributionandAMCconditionswereenteredasinputsto the model. Then, floods of various return periods were simulatedbytransformingrainfalltorunoff.
Biskra(Algeria)S.Benameur,A.Benkhaled,D.Meraghni,F. ChebanaandA.Necir[7]themostobjectiveofthisstudyis to estimate flood events of Abiod wadi at given return periodsatthegaugestationofM’chouneche,locatedclosely totownofBiskraduringasemiaridregionofsoutherneast ofAlgeria.thiscanbeaproblematicissueinseveralways, thanks to the existence of a dam to the downstream, includingthesectorofthesedimentationandalsothewater leaksthroughthedamduringfloods.Theconsidereddata seriesisnew.anentirefrequencyanalysisisperformedona series of observed daily average discharges, including classical statistical tools yet as recent techniques. The obtained results show that the generalized Pareto distribution(GPD),thattheparameterswereestimatedby theutmostlikelihood(ML)method,describestheanalyzed seriesbetter.Also,tothedecision makerstheimportanceto regularmonitoringdataatthisstation.
MuhammadFarooq&MuhammadShafique1&Muhammad Shahzad [8] Khattak3 This paper evaluates four most typically used distribution methods, i.e., Generalized ExtremeValue(GEV),LogPearson3(LP3),GumbelMax,and Normalthatofthefloodfrequencyandrecurrenceofflood estimation.Flood frequency analysis is that the foremost typical technique used for the at site estimation of flood recurrence magnitude. In Pakistan, floods are among the foremost devastating and recurring natural hazards. Assessmentoffloodhazardrequiresfloodeventmagnitude andprobabilityofoccurrence.Differentstationsdatasuchas hydrological data namely Khwazakhela, Chakdarra, Panjkora,andMundaHeadworklocatedatSwatriverwas taken from Provincial Irrigation Department, Khyber Pakhtunkhwa.Theanalysisiscompletedfor5 ,10 ,25 ,50 , and 100 year return periods by using annual maximum discharge data from 1980 to 2016 (37 year). Three goodness of fittestswereappliedtothefitteddistributions, i.e., Kolmogorov Smirnov, Anderson Darling, and Chi squaredat5%significancelevel.ResultsindicatethatLP3 and GEV were ranked top two distributions in within the slightest degree locations while Gumbel Max and Normal were the tiniest amount fitted having rank 3 and 4, respectively.
International Research Journal of Engineering and Technology (IRJET) e ISSN: 2395 0056
Volume: 09 Issue: 06 | Jun 2022 www.irjet.net p ISSN: 2395 0072
NibeditaGuru,RamakarJha[9]Theanalysiswascarriedout for flood series data of two gauging stations Kesinga (upstream) and Kantamal (downstream) of Tel basin, Mahanadiriversystem.Analysiswasperformedusingboth theAnnualMaximumandPeakoverThreshold(POT)flood seriesdata.thasbeenobservedthatthevaluesbelow5% probability of exceedance are affecting the downstream regionsandmaycreatedisasterinMahanadibasin. Outof Fourteenfrequencydistributions,GeneralizedPareto(GP) distribution showed the best results for AM data sets, whereasLN(3P)distributionshowedbestresultsforPOT datasetsfollowedbyGPdistribution.
Vikas Kamal, Priyadarshini Singh, Chandrashekhar Azad Vishwakarma[10]TheGangaRivermaybeamajorriverof North India and is understood for its fertile alluvium deposits formed because of floods throughout the Indo Gangetic plains. Flood frequency analysis has been administrated through various approaches for the Ganga Riverbymanyscientists.Withchangesinriverbedbrought outbyanthropogenicchangestheintensityoffloodhasalso changedwithinthelastdecade,whichentailsfurtherstudy. thecurrentstudyisinaveryapartoftheUpperIndo Ganga plainssubzone1(e).DistributionssuchasStatiticalapplied on the discharge data at two stations found that for HaridwarlognormalandforGarhmukteshwarGumbelEV1 isapplicable.Theimportanceofthisstudyliesinitsabilityto predictthedischargeforareturnperiodafteranacceptable distributionisfoundforapart.
M. Sultan Bhat, Akhtar Alam, Bashir Ahmad, Bahadur. S. Kotlia, Hakim Farooq, Ajay K. Taloor , Shabir Ahmad [11] Thisstudyaimstocarryoutthefloodfrequencyanalysisof riverJheluminKashmirbasin.Probabilitydistributionsarea employedforsimulatingthefutureflooddischargescenarios usingannualpeakflow(1956 2014)from3gaugingstateof riverJhelum.Thefindingrevealthattheestimateddischarge of all return period exceeds the current average carrying capacity,soitislikelytofloodinreturnperiodof5years.The presentstudydemonstratesthattheriverdischargecanbe satisfactorilyprojectedby anyoneoftheused probability distributionmethods;however,asrevealedbythegoodness of fittest,Log PearsonTypeIIIwasfoundtobethebetter fittedprobabilitydistributionamongthetwo.
Kalpalatha Ganamala, Sundara Kumar Pitta [12] Flood frequencyanalysisisthatthemostvitalstatisticaltechnique in understanding the character and magnitude of high dischargeduringariver.thetargetoffrequencyanalysisis to relate the magnitude of events to their frequency of occurrence through probability distribution. the size and shapeparametersofthedistributionwereestimatedusing method of moments. The study which was carried in Vijayawada aimed toward Prediction of Flood frequency analysisofKrishnariverofPrakasambarrageatVijayawada using Gumbel's, California, Hazen's methods. Here all are
estimatedusingdifferentdata’soffloodfrom1990 2014of Prakasam Barrage which were collected from Water ResourcesDepartmentofVijayawada.Themagnitudeofthe delugeinvolvesbefor20yearsand50yearsis1823.33TMC and1873.34TMC.
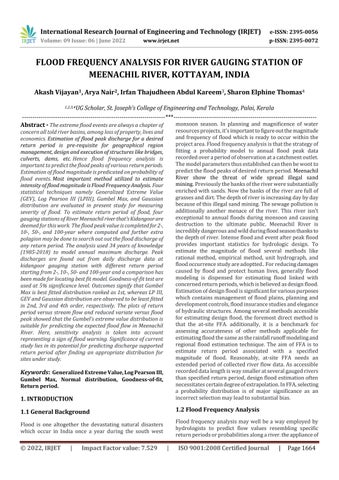
TheSectiondiscussonthemethaTheGEV,Normal,Gumbel Max and LP III distributions are generally utilized in differenthydrologicalstudiestoestimateextremevaluesof observed data series. Table 2 depicts the different parameters and parameters estimation methods used by GEV,GumbelMax,LP IIIandNormaldistributions.Statistical distribution details are provided by McCuen and Hosking andWallis.EasyFitpackagehelpsinfittingtheGEV,Gumbel Max, Normal, and LP III distributions automatically to datasetswiththehelpofparameterestimationtechniques. Probability Distribution Function (PDF) and Cumulative DistributionFunction(CDF)arecharacterizedforKidangoor gaugingstationofMeenachilRiverbasin.ThePDFforGEV, Normal,GumbelMaxandLP IIIdistributionarerepresented inEquations.
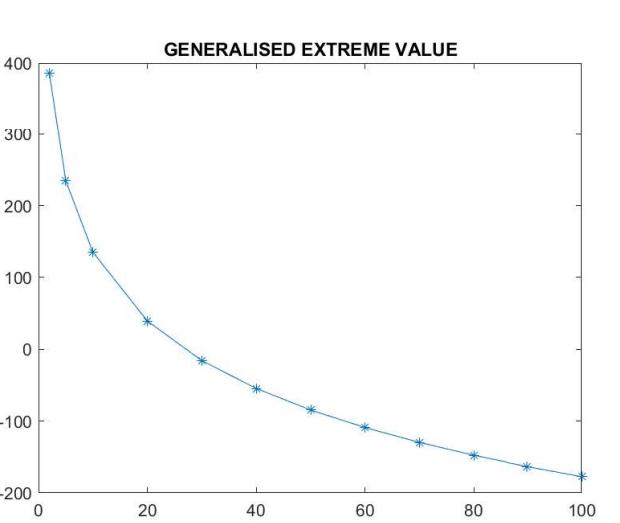
Extreme value distributions are quite useful in civil engineering where the extreme conditions, which occur rarely,arethecriticaldesignelements.Thisisparticularly true when considering the natural hazards such as the maximum intensity of the earthquake in the life span of a building,maximumfloodlevelsinthelifespanofabridge. These distributions are also useful in travel behaviour modellingwherethedecisionsrelatedtothemode choice are presumed to follow EV distribution. Gumbel, which is also identified as type 1 EV distribution, is one such distributionthatdealswithminutedatasets.Ifmagnitudeof datasets is more than 50, GEV will perform well with superiorresults.FrequencyfactorforGEVDistribution:
International Research Journal of Engineering and Technology (IRJET) e ISSN: 2395 0056
Volume: 09 Issue: 06 | Jun 2022 www.irjet.net p ISSN: 2395 0072
Finally,Qp iscomputedfordifferentreturnperiodsforthe respectiveseasons.
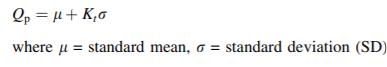
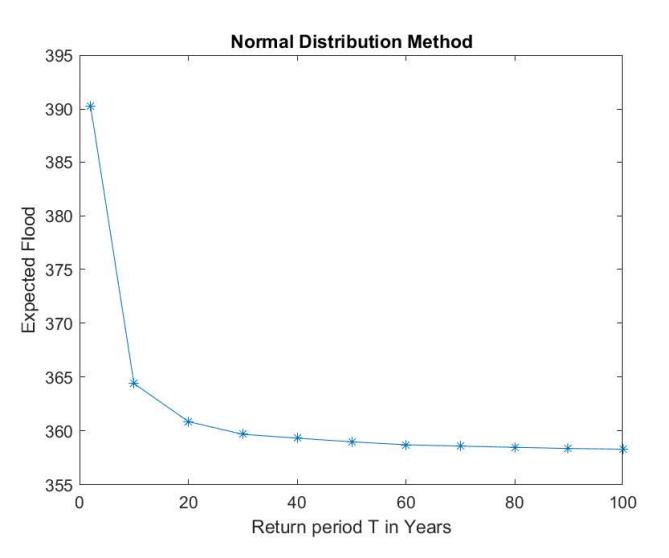
For different return period, predicted discharge (Qp) is found out utilizing normal distribution formula which is givenby
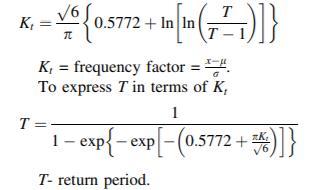
In theory of likelihood, statistical distribution may be a commonly used probability distribution. this is often significantinstatisticalfieldandisoftenutilizedinnatural andscienceforrepresentingrealvaluedarbitraryvariable. MeanandSDaretwoconstraints.mean(orsimplemean)of a sample x1+ x2+……….+ xn usually signified as l is summationofsamplevaluesdividedbynumberofitem(n).
LP III distribution is a method used in statistics to fit frequency distribution data for predicting flood at gauge stationsofa stream.Fromthecollecteddata,wecalculate theactualdischarge(Q)formonsoonseason.Thennatural logarithm of Q is calculated and its logarithmic l and logarithmicrisfoundoutforrespectiveseasonsusing
Subsequently, coefficient of skewness (Cs) is determined utilizing logarithmic discharge ð Þ Z and for specified T, probability(P)iscalculatedusing
ForspecifiedT,probabilityfactorðÞPiscalculatedin(%) usingconversionformulagivenby
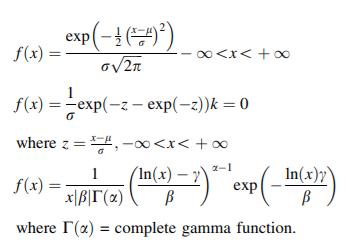
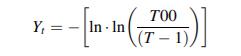
Gumbel distribution is possibly the most commonly used statistical distribution for hydrological modeling. From collecteddata,actualdischargeðÞQhasbeenevaluatedfor monsoonseason.Thenformulaeoflandrhavebeenutilized to standardize calculated discharges for corresponding seasons. For specified T, reduced variate (Yt) is evaluated usingformula
Abridged mean (Yn) and abridged SD (Sn) has been determined for given sample size (N) from Gumbel distributiontable.ThenKtisestimatedby
TestGoodnessoffithelpstoexplainhowstatisticalmodel fitswelltoobserveddatasets.Thismethodcharacteristically summarizes difference amid observed values and people expected under the considered model. This test is additionallyutilizedfortestingifobtaineddataarefittingto a distribution from certain population (i.e., normal or Weibull distribution population). Three subsequent goodness of fit tests (KS, AD and CS tests) were used for varioussampleatsignificancelevelof0.05.
Gaugingstation Kidangoor Peakflooddischarge expecteddischarge Returnperiod Fourmethods Goodnessoffittest
The daily discharge data observed at gauging station 412.40 E, 423 N ofMeenachilgeographicregionfor aperiodof34yearsfrom1985to2018wascollectedfrom the Irrigation Design and Research Board (IDRB) Trivandrum, Department of Irrigation, Kerala. Also the discharge data of gauging station Kidangoor of Meenachil basinfortheseperiodwasobservedandcomparedtogether to search out out the values needed for our post project calculations.anumberofthevaluesofdischargehasbeen collected from the location where gauging stations are established.
International Research Journal of Engineering and Technology (IRJET) e ISSN: 2395 0056
Volume: 09 Issue: 06 | Jun 2022 www.irjet.net p ISSN: 2395 0072
Maximum discharge of Kidangoor gauging station were collected from year 1985 to 2018 from Central Water Commission(CWC)coimbatore,India.Theannualmaximum dischargedatawereusedforfloodfrequencyanalysis.
Flowdataaredenotedintermsofexceedanceprobabilities and recurrence intervals. Considering, as the annual maximumfloodinyeariandthequantile(F)asthevalueof expectedtoexceedwithprobabilityF,thefollowingrelation, P ≥ F =F,duringtheyearofconcernisderived.Thus, there is an F % chance for Q ≥ Q F occurrence. In other way,thereisa 1−F %chancethateventsX<Q F occurs. The return period T of a flood, is the reciprocal of the probabilityofexceedanceinoneyearcomputedas1/(F).
HereweusetheSoftwarecalledMATLABtoplotthegraphs ofcollecteddata.MATLABisaprogrammingplatformused by millions of engineers and scientists to analyse data, developalgorithms,andcreatemodels.
Basedondata,returnperiodandpredicteddischargeneed tobecalculatedandplottinggraphusingMATLAB.Sothe procedureisgivenbelow;
Plot the graph of 4 methods of return period predictedfloodgraphandreturnperiod measured flowdischargegraph.
InMATLAB,afteryouimportdataintotheMATLAB workspace,itisagoodideatoplotthedatasothat youcanexploreitsfeatures.Anexploratoryplotof the data enables to identify discontinuities and potentialoutliers,astheregionsofinterest.
Loadandplotdatafromthetextandrecord.Each data column in the file represents data for one intersection.
The Result will be getting the plotted Graph of the followingdata.
FourGraphsshowsthe4methodsofReturn
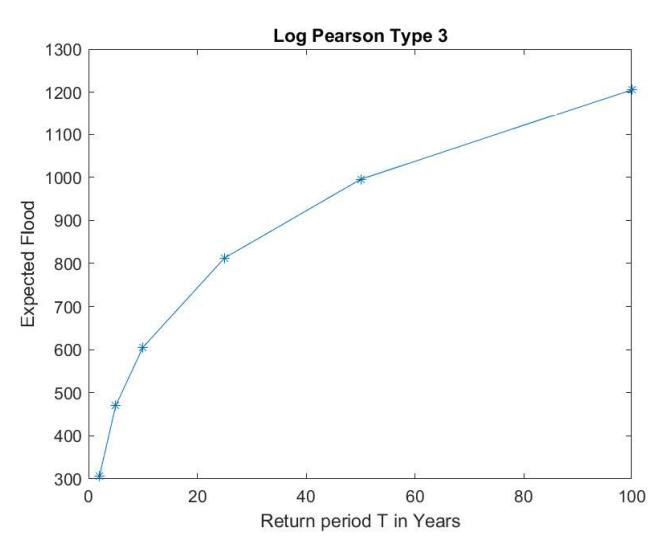
From the Gumbel’s distribution, the expected estimated discharges for return periods of 2yrs, 10yrs, 50yrs and 100yrswereobtainedas331.41m³/s,616.84m³/s,867.08 m³/s and 972.87 m³/s respectively. These values can be adoptedasaguideforstormwatermanagementintheregion during flood. The predicted value and measured value of dischargeshowedgoodagreementwithoutmuchvariationas indicatedinFig.4.Floodfrequencyanalysiswascarriedout
International Research Journal of Engineering and Technology (IRJET) e ISSN: 2395 0056
Volume: 09 Issue: 06 | Jun 2022 www.irjet.net p ISSN: 2395 0072
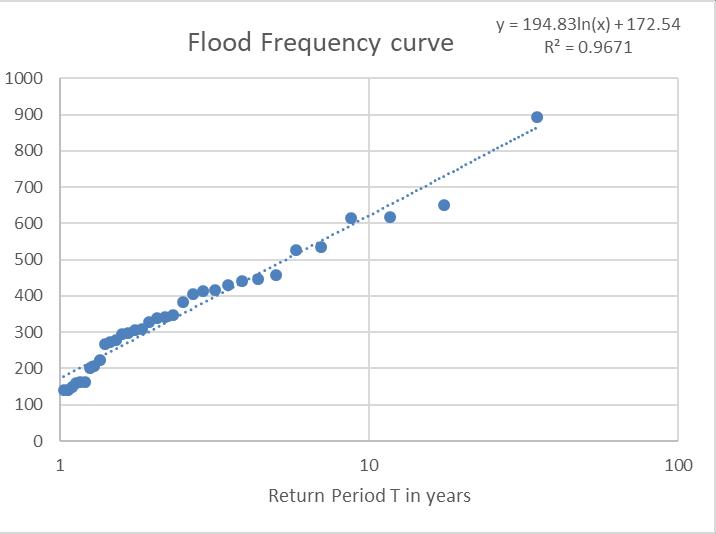
for Pala watershed, which lies in the upstream side of MeenachilRiverbasin.Theanalysisusedpeakdischargedata of34yearsfrom1985 2018.Fromtheplotofthereduced variate versus peak flood, the trend line equation gives R² valueof0.9778.Thisshowedthatthepatternofthescatteris narrow and therefore Gumbel’s distribution method is suitableforpredictingexpecteddischargeintheriver.The frequency analysis also showed good capability of the Gumbel distribution to predict river flood magnitudes occurring in different return period. There were no significantdifferencesbetweenthepredictedandmeasured dischargevalues.Hence,themodelcanbereliablyappliedto predict the occurrence of floods in the catchment. This mathematical relation can also be considered for several extremeeventdistributionsintheregionwhereemergency evacuation of people could be done. This type of flood predictioncanalsobeutilizedinthedesigningofimportant hydraulicstructuresintheriverreach.
FFAanalysesincorporateassumptionsateachstageofthe modellingprocess.Animportantoneistheassumptionofa highdegreeofaccuracyintheestimationofdischarges.
This work is carried out in Kidangoor gauging stations of MeenachilRiverbasinconsideringhydrologicaldata.GEV, LP III, Gumbel Max and Normal distribution methods are employedforpredictingfloodfrequencyandarelationship is established to find out peak discharge during monsoon period.Inthepresentstudy,theEasyfitsoftwareisutilized forfindinggoodnessoffitandtheeffectivenessofproposed probability distribution methods. It is observed that considerationofthefrequencydistributionwithlowerrange ofprobabilitytriggerwarningsearliertosensitivegauging stations.
Thestatisticalapproachesarefittotunethemagnitudeof floodwithfrequencydistribution.Onbasisofranking,itis foundthatGumbelmaxrankedas1st,whereasLPIII,GEV and normal distribution as 2nd, 3rd and 4th respectively. Fromtheplotofthereducedvariateversuspeakflood,the trendline equation gives R²valueof 0.9778.Thisshowed that the pattern of the scatter is narrow and therefore Gumbel’s distribution method is suitable for predicting expecteddischargeintheriver.Thefrequencyanalysisalso showedgoodcapabilityoftheGumbeldistributiontopredict riverfloodmagnitudesoccurringindifferentreturnperiod. Thispredictionoffloodcan beutilisedinthedesigning of important hydraulic structures and bridges in the river reach.Also in the case of extreme flood emergency evacuation of people can be carried out well in advance. Similarstudycanalsobecarriedoutonsomeotherstudy region,asthemethodusedforthestudyishavingaconstant formula,whichremainsspatiallyconstant.
1) M. Ramasamy a, S. Nagan a, P. Senthil Kumar b (2022)“Acasestudyoffloodfrequencyanalysisby intercomparisonofgraphicallinearlog regression method and Gumbel’s analytical method in the VaigairiverbasinofTamilNadu,India”.
2) Abinash Sahoo Dillip K. Ghose (2020) “Flood FrequencyAnalysisforMenaceGaugingStationof MahanadiRiver,India”TheInstitutionofEngineers (India).
3) Sandeep Samantaray and Abinash Sahoo (2020) “Estimation of flood frequency using statistical method: Mahanadi river basin, India” H2Open JournalVol3No1.
4) NirmanBhagat(2019 “FloodFrequencyAnalysis UsingGumbel'sDistributionMethod:ACaseStudy of Lower Mahi Basin, India” Journal of Water ResourcesandOceanScience.Vol.6,No.4,2017.
5) Bahram Saghafian, Saeed Golian, Alireza Ghasemi 201 “Flood frequency analysis based on stimulated peak discharge” journal of natural hazardsVolume71.
6) Biskra (Algeria)S. Benaneur, A. Benkhaled, D. Meraghni, F. Chebena and A. Necir (2019) “Complete flood frequency analysis in Abiod watershed”JournaloftheinternationalSocietyfor the prevention and mitigation of natural hazards (2019),volume86,Issue2.
7) KalpalathaGanamala,SundaraKumarPitta(2018) “Case on flood frequency analysis” International Journal of Civil Engineering and Technology, Volume84,Issue8.
8) Kalpalatha Ganamala (2017) “A CASE STUDY ON FLOOD FREQUENCY ANALYSIS” International Journal of Civil Engineering and Technology (IJCIET)Volume8,Issue4.
9) KhanMujiburrehman(2013)“FrequencyAnalysis ofFloodFlowatGarudeshwarStationinNarmada River, Gujarat, India” Universal Journal of EnvironmentalResearchandTechnologyVolume3, Issue6:677 684.