International Research Journal of Engineering and Technology (IRJET) e ISSN: 2395 0056

Volume: 09 Issue: 06 | Jun 2022 www.irjet.net p ISSN: 2395 0072
International Research Journal of Engineering and Technology (IRJET) e ISSN: 2395 0056
Volume: 09 Issue: 06 | Jun 2022 www.irjet.net p ISSN: 2395 0072
Niharika Ambati1, Ankitkumar Somabhai Patel2 , Hiralkumar Vinodchandra Patel3
1PG Student Ganpat University 2Assistant Professor Ganpat University 3Assistant Professor Ganpat University
3U. V. Patel collage of engineering, Ganpat University, Mehsana, Gujarat, India ***
Abstract Risk identification and analysis for high rise construction projects has become the significant part of the present day project management. The development of the area with respect to population and demand always increases the need of greater construction projects with different types of buildings. Currently Ahmedabad city is in one such phase of development where the need of high rise and tall buildings are increasing. With such blooming rise of construction projects the risk management becomes a vital role for the contractors and other stakeholders. Due to the awareness of risk management among the industry experts many risks has been recognized. The top most factors found among the different research papers are socio economic risk, environmental risk, project management risk, resource risk, labor productivity risk, plant and equipment risk, design related risk, legal problems etc. the research The current research paper focuses on the risks involved in the newly developing high rise construction projects in Ahmedabad city and what risks are involved in the construction. The data collection methodology includes preparation of questioner survey where the risk factors were selected with the help of literatures and discussions and informal meetings with industry experts who are involved in high rise construction. The risk factors are given the scale of likelihood and impact which would be helpful for further data analysis. The results from the questioner survey are analyzed by using various analysis methods. For data analysis qualitative and quantitative approaches are implemented and the severity of the risks are determined. This research paper mainly aims on comparing the results obtained through different analysis methods and to identify the top rated risk factors and the risks which come in common among the different analysis method. The top most risks found in this research cost overrun, inexperienced staff, lack of coordination between agencies, improper project scheduleand safety relatedrisks.
Key Words: Risk Management, High Rise Construction, Risk Factors, Cost Overrun
Risk management is the systematic process of analysing, identifying, and responding to projects risk. Construction industry being one of the most complex business it rises the need of risk management. Due to rise of vertical
construction from past few decades multi storied buildings are the most common projects the risk factors increases and the need of risk management becomes necessary. The risks in construction projects are addressed to various factors like environmental risks, geographical risks, socio economical risks, construction risk,landacquisitionrisksetc.
Risk identification, analysis and management is a very essential task at planning stage of the construction projectswhichcanledtosmoothexecutionoftheproject. It is generally found that high rise building are the most importantpartoftheconstructionindustryforthegreater development. The major part of the construction industry leads to the high rise building. Hence risk involved in this part also rates higher in the construction industry. Risk management is not a complex task. But if the above steps are followed properly the risks can be decreased to a significant level. The risk management process is bifurcated into four main steps which are risk identification, risk qualification, risk response, risk monitoringandcontrolling.
The primary objective of this research paper is to analyze theriskfactorsassociatedwiththehighrisebuildings. To evaluatetherisk involvedineachactivityofhighrise. The secondaryobjectiveistomeasuretheseverityandrankthe probability of the most likely risks in the construction process.Tocomparetherelationshipbetweenthedifferent variablesofdatacollected
Riskmanagementisaverycrucialprocessthatisessential to be carried out to control the outcomes of a project and for a smooth execution. With the increasing rate of high rise projects from the past 5 years in Ahmedabad city in Gujarat state risk management becomes more important. The majority of current high rise building projects in Ahmadabadconsistsofheightmorethan30mreachingup to 90 m height. With buildings reaching such range of heights the no. of risk factors becomes high and risk managementbecomestoppriority.
International Research Journal of Engineering and Technology (IRJET) e ISSN: 2395 0056
Volume: 09 Issue: 06 | Jun 2022 www.irjet.net p ISSN: 2395 0072
Fordata collection qualitativeapproachis adopted where risk factors are selected by discussions and informal meetings and past research papers. For risk factors appropriate research papers were reviewed. From the selectedriskfactorsrisksfromeachactivityarebifurcated into the selected risk factors. Questioner is prepared in googleformsandtheresponsesaretakenaccordingtothe sample size decided. For analysis of data qualitative and quantitativemethodsareused.
Studyingthepastresearchpapersgivesanoverviewofthe past work and the researches carried out on the topic selectedwhichhelpsindecidingthescopeofwork.Inpast research papers, the authors mainly focuses on the hazards involved in high rise construction projects. Various number of methods are used by the authors for data analysis of risk factors selected. By referring such researchpapersmanybenefitsareobtainedtoresearchers andindustryexperts.
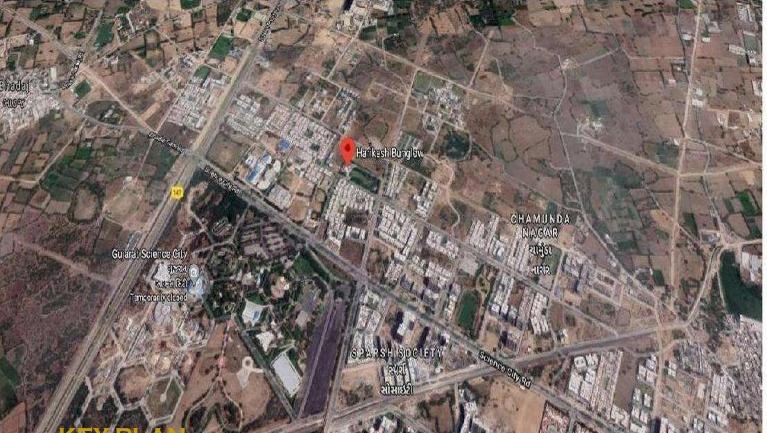
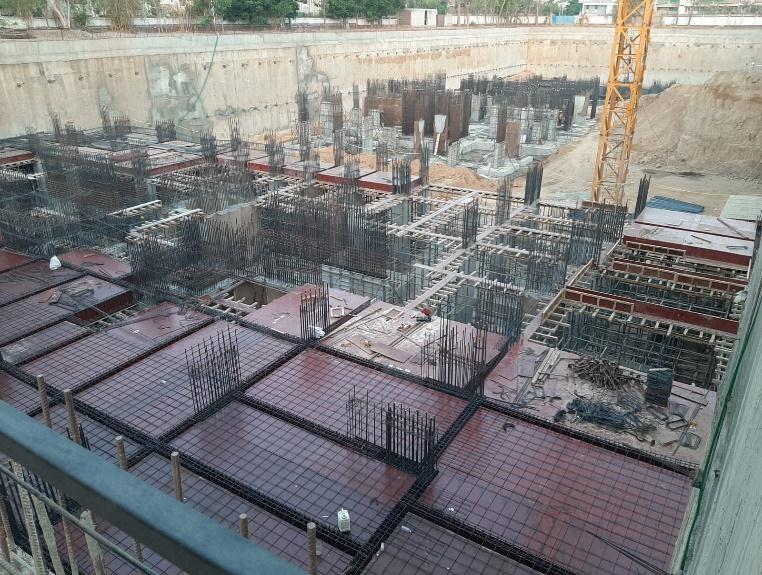
HarmonyHarikeshApartmentsisaluxuriousmodernflats locatedatsciencecitysolaAhmedabad.Itisa3BHKand4 BHK flats with 3 blocks and 3 basements and is the first tallest residential of Gujarat with 32 floors with area of 15000 sq. m. below table 1: shows the details of the high risebuildings.
All the major hazards are selected with the help of literature review and discussions and informal interview withthesiteexperts.Therisksarebifurcatedinto10main factors. For the questioner pattern format the risks are quantified likelihood, impact and weightage. Likelihood gives the probability of the occurrence of the risk and impact describes the effect of the particular risk on the project. The weightage gives the multiply value of the likelihood and impact value. The risks are ranked from 1 to5scalerankingfromverylowtoveryhigh.
Following is the Cochran formula equation used for sample size collection which determines the number of responses to be taken for the questioner survey which is calculatedasfollowing:
Equation 1 Cocheren formula
International Research Journal of Engineering and Technology (IRJET) e ISSN: 2395 0056
Herezisconfidencelevelwhichistakenas95% Pstandsforpopulationsizewhichis0.5 estandsforcorrectionerror12% Theresultforabovevaluesareasfollowing: =(1.96)2*(0.5)*(1 0.5)/(0.12)2 =0.9604/0.0144 =66.69say66 Thesamplesizeis67
Table 2: RiskFactors
Riskfactors Likelihood impact Weightage Contractual risk
Organizational risk Designrisk Resourcerisk Project management risk Environmental risk Socio economicrisk Plant and equipment risk Financialrisk Safety related risk
Theanalysisof10majorriskfactorsare analyzed.The10 major risks selected in high rise construction are 1) contractual risk, 2) organizational risk, 3) design risk, 4) resource risk, 5) project management risk, 6) environmental risk, 7) socio economic risk, 8) plant and equipment risk, 9) financial risk, 10) safety related risk. Analysis is done by both qualitative and quantitative method.Qualitativeanalysisisdonebyriskmatrixmethod while quantitative analysis is done by risk severity analysisandprobabilisticanalysis.
Probability can defined as the possibility of an event occurring,whiletheoutcomesofhowtheeventaffectsthe project is the impact of the risk. According to the responses gained by the questioner survey the risks are ranked according to their possibility of occurrence. A graph is generated by the results gained where the most
likelyriskwhichhasthehighestprobabilityisplottedfirst and likewise all the risks are ranked respectively. The belowgraphnamed probabilistic analysisshowsthe risks selectedinadescendingorderi.e.fromthehighestriskto thelowestrisk.Thisgraph helpsinknowingthetopmost riskfactorsinvolvedfromtheselectedriskfactors.Chart1 shows probabilistic analysis where the risk factors are rankedonthebasisofthehighestfactortolowestfactor.
0.48 0.530.550.550.550.560.570.570.570.580.580.580.580.590.590.590.590.590.600.600.600.600.600.600.610.610.610.620.620.620.630.630.630.640.640.640.640.640.640.650.650.670.670.69 0.00 0.10 0.20 0.30 0.40 0.50 0.60 0.70 0.80 l i k e l i h o o d p o l i t i c al in s t ab i l i ty w i n d lo ad s man ag i n g c h an g e o rd e rs tr an s p o rt th ro u g h c i t i e s s u p p l y o f d e fecti ve … i n c r e as e i n rate o f… p o o r c o n tr ac t w ri ti n g l ac k o f m an a g e me n t… F al l fro m s c aff o l d i n g o r… i s s u e s w i th c o n tr ac to rs Impr o p e r S afet y t alk s … mat e r i al u n av ai l ab i l i ty ri s e in f u e l p ri c e s De l ay in p a yme n t fro m…
Todetermine the risk ofthe activityrisk severityanalysis methodisusedwhichisexplainedbelow:
Lstandsforlikelihoodoftheactivity, Istandsforimpactoftheactivity, Wstandsforweightageoftheactivity, CLFstandsforcompositelikelihoodfactoroftheactivity, CIFstandsforthecompositeimpactfactoroftheactivity.
Likelihood (L):Theprobabilitynumbermustbebetween
0and1.Thelikelihoodistheoccurrenceprobabilityofan activityandisdeterminedbytheresultsobtainedfromthe questionersurvey.
Impact (I):Theimpactnumbermustbetween0and1. Theimpactcanbeexplainedastheeffectoftheriskon costandtimeoftheprojectoranactivity.
Weightage: (W): the weightage can vary according to the local priority (LP), where all sub activities of a given activityhaveaweightof1.Ontheotherhand.Theweight
Volume: 09 Issue: 06 | Jun 2022 www.irjet.net p ISSN: 2395 0072 © 2022, IRJET | Impact Factor value: 7.529 | ISO 9001:2008 Certified Journal | Page1538
International Research Journal of Engineering and Technology (IRJET) e ISSN: 2395 0056
Volume: 09 Issue: 06 | Jun 2022 www.irjet.net p ISSN: 2395 0072
canbe variedaccordingtotheglobal priority(GP), where allprojectactivitieshaveaweightof1.
Composite likelihood factors (CLF): the CLF can be determinedbythemultiplicationofweightagesoftherisk totheirrespectivelikelihoodsi.e.(CLF=L*W)
Composite impact factor (CIF): the CLF can be determinedbythemultiplicationofweightagesoftherisk totheirrespectiveimpacti.e.(CLF=I*W)
Riskseverityanalysiscanbeused withtheconceptofCLF and CIF. The severity of the risk can be obtained by the product value of likelihood and impact. Table 3 describes the severity classification where the severity is classified from 0 to 1. Table 4 describes the factors divided accordingtotheseverityclassification
Table 3: severityclassification
labors
Fallingofheavyobjects Pumpingandplacingconcreteat extremeheights
Selectionofcontracttype
Poorcontractwriting Designerrorandomission
Designprocesstakestimethat processed
Defectivedesigns
Selectionofmaterials
Supplyofdefectivematerials Issueswithcontractorsandsuppliers Riseinfuelprices
Unavailabilityofskilledoperators
Financialinstabilityofclients ImproperuseofPPE
Inadequatetrafficmarshalsand safetypersonalsdeployedduring executionofwork
Impropermonthlymachineryand equipmentchecks
Unavailabilityofspareparts Improperplacingofmaterials
International Research Journal of Engineering and Technology (IRJET) e ISSN: 2395 0056
Volume: 09 Issue: 06 | Jun 2022 www.irjet.net p ISSN: 2395 0072
Changeinpolicies
Low(0.21 0.31) Riskinexchangeofforeignmoney Verylow(0.00 0.20)
CLF
0.70
0.700.74 0.00
0.790.730.74 0.00
0.720.680.670.700.72 0.00
0.65 0.75 0.61 0.700.70 0.63 0.710.650.69 0.00
0.680.690.64 0.00
0.670.680.620.590.640.69 0.00
0.640.620.60 0.70 0.00
0.700.720.710.74 0.00
0.60
0.50
0.40
0.30
0.20
0.10
0.590.60 0.00
0.640.64 0.67 0.00
0.64 0.60 0.640.65 0.58 0.00
0.57 0.64 0.550.610.590.570.630.600.62 0.00
0.580.590.56 0.00
0.59 0.48 0.550.530.57 0.64 0.00
0.650.67 0.60
0.580.58 0.55 0.62 0.00
0.69 0.00
0.63 0.60 0.630.590.600.610.620.61 0.00
0.80 s e l e c ti o n o f c o n tr a c t typ e i n e x p e ri e n c e d s taff d e s i g n ri s k d e s i g n p r o c e s s take s ti me th e n … re s o u rce ri s k te c h n o l o g y c h an g e s man ag i n g c h an g e o rd e rs l ac k o f m an a g e me n t s o ftw are u s e ad ve rs e c l i mate c o n d i ti o n s s o c i o -e c o n o mic ri s k p o l i t i c al in s t ab i l i ty ri s e in f u e l p ri c e s tr an s p o rt th ro u g h c i t i e s fin a n c i al r i s k F i n an c i al In s tab i l i ty o f c l i e n t
Chart 2: Composite Likelihood Factor
Impr o p e r S afet y t alk s an d tr ain i n g to … Impr o p e r p l ac i n g o f mate ri als F al l i n g o f he avy o b je c t s
Chart- 3: Composite Impact Factor
0.50
0.40
0.30
0.20
0.10
0.41 0.44 0.00
0.51 0.47 0.50 0.00
0.46 0.410.43 0.45 0.41 0.00
0.37
0.47 0.33 0.420.41 0.36 0.00
0.45 0.39 0.43 0.00
0.390.40 0.36 0.00
0.40 0.330.340.310.36
0.44 0.00
o p e r S
0.700.720.680.650.690.720.750.69 0.00 0.10 0.20 0.30 0.40 0.50 0.60 0.70 0.80 0.90 i n e x p e ri e n c e d s taff d e s i g n ri s k d e s i g n p r o c e s s take s re s o u rce ri s k te c h n o l o g y c h an g e s man ag i n g c h an g e … l ac k o f m an a g e me n t… ad ve rs e c l i mate … s o c i o -e c o n o mic ri s k p o l i t i c al in s t ab i l i ty ri s e in f u e l p ri c e s tr an s p o rt th ro u g h fin a n c i al r i s k F i n an c i al In s tab i l i
y… Impr o p e r p l ac i n g o
f F al l i n g o f he avy…0.45 0.48 0.43
0.370.36 0.33
0.43 0.00
0.51 0.00
0.450.430.43 0.38 0.410.440.460.42 0.00
0.60 c o n tr ac tu al r i s k o rg an i z ati o n al r i s k l ac k o f c o o rd i n ati o n b e tw e e n … d e s i g n e r r o r s an d o mi s s i o n s d e fecti ve d e s i g n s mate ri al u n av ai l ab i l i ty s u p p l y o f d e fecti ve mate ri als i mp ro p e r p ro je c t s c h e d u l e e n vir o n me n tal ri s k w i n d lo ad s w ars c h an g e in p o l i c i e s p r o c u re me n t o f sp e c i ali z e d u n ava i l ab i l i ty o f s ki l l e d o p e r a t o rs De l ay in p a yme n t fro m c l i e n t s s afet y re l ate d ri s k In ad e q u ate tr aff i c mars h als an d F al l fro m s c aff o l d i n g o r p l atfo rms
Chart 4: Severity
International Research Journal of Engineering and Technology (IRJET) e-ISSN: 2395-0056
Volume: 09 Issue: 06 | Jun 2022 www.irjet.net p-ISSN: 2395-0072
Description Composite Likelihood Factor(CLF)
Composit e Impact Factor (CIF)
Severity (CLFx CIF)
selectionofcontract type 0.59 0.70 0.41
Poorcontract writing 0.60 0.74 0.44
inexperiencedstaff 0.64 0.79 0.51 lackofmanagersona constructionsite 0.64 0.73 0.47 lackofcoordination betweenagencies 0.67 0.74 0.50
Complexdesigns 0.64 0.72 0.46 designerrorsand omissions 0.60 0.68 0.41 designprocesstakes timethencalculated 0.64 0.67 0.43
Designcostoverrun 0.65 0.70 0.45
defectivedesigns 0.58 0.72 0.41 labordisputesand strikes 0.57 0.65 0.37 material unavailability 0.64 0.75 0.47 technologychanges 0.55 0.61 0.33
Selectionofmaterials 0.61 0.70 0.42 supplyofdefective materials 0.59 0.70 0.41 managingchange orders 0.57 0.63 0.36 improperproject schedule 0.63 0.71 0.45 lackofmanagement softwareuse 0.60 0.65 0.39 issueswith contractorsand suppliers
0.62 0.69 0.43 adverseclimate conditions 0.58 0.68 0.39
earthquakezones 0.59 0.69 0.40
value:
windloads 0.56 0,64 0.36 increaseinrateof interests 0.59 0.67 0.40
wars 0.48 0.68 0.33
politicalinstability 0.55 0.62 0.34 riseinexchangeof foreignmoney 0.53 0.59 0.31
changeinpolicies 0.57 0.64 0.36
riseinfuelprices 0.64 0.69 0.44 procurementof specialized equipment
0.58 0.64 0.37 transportthrough cities 0.58 0.62 0.36 unavailabilityof spareparts 0.55 0.60 0.33 unavailabilityof skilledoperators 0.62 0.70 0.43
Delayinpaymentto vendors/ subcontractors
0.65 0.70 0.45
Delayinpayment fromclients 0.67 0.72 0,48
FinancialInstability ofclient 0.60 0.71 0.43
Costoverrun 0.69 0.74 0.51
ImproperSafetytalks andtrainingtolabors 0.63 0.70 0.45 ImproperuseofPPE 0.60 0.72 0.43
Inadequatetraffic marshalsandsafety personneldeployed duringexecutionof work
0.63 0.68 0.43
Improperplacingof materials 0.59 0.65 0.38
Improper monthly machinery andequipment checks
0.60 0.69 0.41
Fallfromscaffolding orplatforms 0.61 0.72 0.44
In this research work the data collection was done by quantitative approach where the questioner survey includes 10 major risk factors of high rise buildings. The risks considered are 1) contractual risk, 2) organizational risk,3)designrisk,4)resourcerisk,5)projectmanagement risk, 6)environmental risk, 7)socio economic risk, 8)plant andequipmentrisk,9)financialrisk,10)safetyrelatedrisk. The risk factors are taken from contractor’s point of view
as to what kind of risks are involved in construction projects for a contractor. The risks of each activity is bifurcated into the 10 major risks. From the responses obtained fromthe googleformsthecalculationsaremade andfromtheresultsobtainedtheanalysisisdonebyboth qualitative and quantitative method. Mainly three methods are used for analysis which is probabilistic method,severitymethodandriskmatrix.Theresultsfrom this methods are explained in below points. For quantitativeapproachprobabilistic methodisused where the risk factors are ranked from the most likely factor to leastlikelyfactor.
Costoverrun,lackofcoordinationbetweenagencies,delay in payment to vendors/subcontractors, rise in fuel prices, lack of managers on a construction site are the top five risks from the probabilistic analysis method. From the severity analysis method it is concluded that inexperiencedstaff,lackofmanagersonconstructionsite, lack of coordination between agencies, complex designs, design cost overrun were the top risks which are in very highscale.Forqualitativeapproachriskmatrixmethodof analysisisusedwherethetopriskresultedintothesever column are design cost overrun, improper project schedule,costoverrun,pumpingandplacingofconcreteat extreme heights, financial instability of client. The top risks resulted in significant column are inexperienced staff, selection of contract type, lack of managers on construction site, lack of coordination between agencies, complex designsandfalling ofobjects. Themost repeated factors in all the three analysis method are cost overrun, inexperienced staff, and lack of coordination between agencies,design cost overrun, rise in fuel prices, falling of heavyobjects
In regard of the developing technology and demand the need of high rise buildings has risen and many promising high rise projects of height more than 70 m are expected totakeplaceinthecomingdecades.Withsuchablooming riseintheconstructionsectormanynewtechnologiesand complex methods will be used which involves many risks in each and every step of the construction process. The risk factors taken in this work would be helpful in recognizinghazardsandinthemanagementandplanning oftheprojectsbytheindustryexpertsandcontractors.
1. Akintoye, A. a. (1997). Risk analysis and management in construction. International Journal of Project Management
2. AratiChougule,A.W.(2015).RiskManagementin High-Rise Building Construction. International Journal for Scientific Research& Development
International Research Journal of Engineering and Technology (IRJET) e ISSN: 2395 0056
3. Boris Titarenko, A. H. (2018). Project risk
management in the construction of high rise buildings. E3S WebofConferences 33
4. Daniel Baloi, A. D. (2002). Modelling global risk factors affecting construction cost performance. InternationalJournal of Project Management
5. Danish Ali, a. h. (2016). Risk Management Strategies in Construction Companies in India. International Journal for Innovative Research in Science & Technology. .
6. Debasis Sarkar, S. P. (2015). Integrated Interpretative Structural Modeling and Fuzzy Approach for Project Risk Management of Ports. International Journal of Construction Project Management
7. Florence Yean Yng Ling, L. H. (2006). Risks faced by Singapore firms when undertaking construction projects in India. International Journal of Project Management,10.
8. GavitShivamkumarChandubhai,D.J.(2019).Risk ManagementInHighRiseConstructionProjectsIn Surat City. International Journal of Technical Innovation in Modern Engineering & Science (IJTIMES)
9. Gavit shivkumar chandubhai, d. j. (2019). Risk ManagementInHighRiseConstructionProjects:A Review. International journal of emerging technologies and innovative research
10. Junying Liu, Q. X. (2017). “Impact of Design Risk on the Performance of Design Build Projects. AmericanSociety of Civil Engineers.
11. Kansal, r. (2012). “Risk assessment methods and application in construction projects. International journalofmodernengineering research
12. Kaushal V. Wadhvaniya, D. J. (2019). Analysis Of Risk Categories And Factors For PPP Projects Using Analytic Hierarchy Process (AHP): A Review JETIR
13. Luv bhalani, u. p. (2018). Importance of project risk management in construction of multi storied buildings. International journal for scientific researchand development.
14. M.G., B. (2014). Management of Risk in Construction Projects in Maharashtra. International Journal of Engineering Science Invention, 14 17.
15. Manlian Ronald. A. Simanjuntak, H. A. (2017). ImportantRisk IdentificationonHigh Rise School Building in Eastern Part of Indonesia. Imperial Journal of Interdisciplinary Research(IJIR)
16. Mostafa H. Kotb, A. K. (2015). Risk Analysis in Construction Projects in Gaza Strip (Contractor's Perspective). IUG Journal of Natural and EngineeringStudies
17. Neha verma, h. v. (2017). A Study on Risk Assessment and Safety Management in the constructionofhigh risebuilding. IJEDR
18. Patil, R. K. (2014). Study of High Rise Residential Buildings in Indian Cities (A Case Study Pune City). International Journal of Engineering and Technology (IACSIT).
19. Schieg, M. (2010). Risk management in construction project management. Journal of Business Economics and Management, Volume VII, No2,77 83.
20. Terry Lyons, M. S. (2004). Project Risk Management in the Queensland Engineering Construction Industry: A Survey. International Journal of Project Management.
21. V.Sakthiniveditha, P. (2015). A Study on Risk Assessment in the Construction of High Rise Buildings. International Journal of Science and EngineeringResearch(IJ0SER).
22. Vidivell, K. J. (2016). Analysis of Major Risk in constructionProject. Journal of Engineering.
Volume: 09 Issue: 06 | Jun 2022 www.irjet.net p ISSN: 2395 0072 © 2022, IRJET | Impact Factor value: 7.529 | ISO 9001:2008 Certified Journal | Page1544