Prediction Model for Emotion Recognition Using EEG
Abstract: EEG signal based emotion recognition has been employed in medical, affective computing, and other biotech domains. Compare the work by analysing the main factors involved in the recognition process, such as feature extraction, subjects, and classifiers. The emotional activation curve is used for the demonstration of the emotional activation process. Have used different algorithms, each of which extracts features from EEG signals and classifies emotions using machine learning techniques such as CNN, KNN, LSTM, and random forest, in which different parts of the trail are used to train the proposed model and predict its impact on emotion recognition results.
This paper gives a comparative analysis of existing approaches and proposed methods. The accuracy of identifying depression patients' emotions as positive, negative, or neutral is better when a randomforest method is applied.
Keywords: Random Forest, CNN, KNN and LSTM, EEG, Mind Monitor
I. Introduction
Emotion and voice recognition can be used to identify depression, which is a prevalent mood disorder defined as feelings of melancholy or anger that interfere with a person's personality and can be used to determine and classify people's depression. As a result, the earlier depressionisidentified,themoreeasilyitcanbetreated.

EEG (electroencephalography) is being used in brain systems and rehabilitation engineering to address this problem with a low cost, non invasive, and high resolutiontechnology.
The experimental paradigm, emotion and voice feature extraction, feature selection, training, and testing datasets, as well as geographical information feature extractionandselection,areallcoveredinthiswork.
The main focus will be on investigating different categorization strategies and how they affect accuracy andmoduleselection,aswellaswhichmodelisbestand howtoselectthebestmodule.
Developedanonlinewebapplicationthatmaybeusedto determine whether a person is depressed on a positive, negative,orneutralscale.
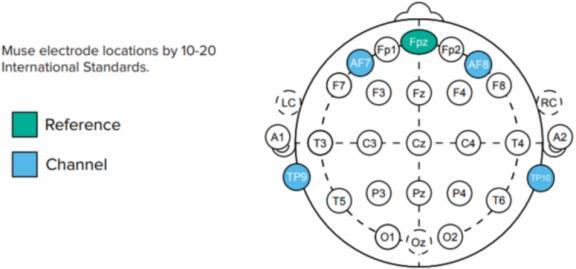
The participants were given stimuli of six human faces presented with faces in the crowd, and the dataset included 16 patients with depression and 14 healthy controls.
Dimension features can deceive classifiers, so selecting the correct features is crucial. Support vector machine, Bayes Net, K nearest neighbor (knn), Convolutional neural network (CNN), Long short term memory (LSTM),andRandomForestapproachesarewidelyused fordiscriminatingclasses.
EEG signals, like many other physiological signals, are nonlinear and nonstationary. To analyse them, linear and nonlinear parameters such as spectrum density, Lempel complexity, variance, fluctuations, entropy, correlation dimension, and permutation entropy are used.
electroencephalogram (EEG) system and device with 1/4/812/24/36/48/60 channels. It is the process of recordingandinterpretingelectricalactivityinthebrain. The electrical impulses produced by brain nerve cells followarhythmicpattern.
Thisisconsistentwiththeneurosciencepremise that neurons are the brain's building blocks. These neurons transmit data from the rest of our body to the brain and back. It analyses the change in electrical potential caused by an electrically active cell's impulse. Ion flow causes the action potential. Ions are positively or negatively charged molecules. A neuron can generate acurrentbymodifyingtheflowoftheseions,resultingin an action potential. If neurons stimulate the ion flow from one neuron, these flows accumulate, and a threshold is met, indicating that this neuron will create anactionpotential.EEGrecordingsarenowavailable.
EEGequipmentisprimarilyusedtocaptureandmeasure brain wave patterns, and the resulting recording is referredtoasanelectroencephalogramorEEG.
For the EEG dataset, eight linear features and nine non linear features were derived from alpha 8 13Hz, beta 13 30Hz, and theta 4 8Hz waves, with the beta frequency band receiving the greatest accuracy using RandomForestandKNN.
The channel dimension comprises EEG spatial information since the electrode channels are positioned at different locations on the human skull. The best
International Research Journal of Engineering and Technology (IRJET) e ISSN:2395 0056
Volume: 09 Issue: 06| June 2022 www.irjet.net p ISSN:2395 0072
spatial information must be chosen while selecting EEG channels. The common spatial pattern (CSP) was demonstrated to be the most successful technique for braininterfaceoptimizationofthespatialspectrumfilter inthepreviousresearch.
Thisresearchcomparesmultiplecategorizationmethods to offer an excellent EEG based depression diagnosis approachbasedongeographicalinformation.
II. Implementation:
1. Data Selection and Loading
The data selection process involves choosing datafromtheEEGemotiondatasettopredictdepression in patient emotions. We need EEG equipment to collect real time data. A few questions may arise, so let's addressthem.
2. Device configuration:
The dry electrodes of the Muse 2 headset are made up of a single metal that functions as a conductor between the electrodes and the skin. The connection is aided by a small amount of sweat between the skin and the electrode. Wet electrodes, which use an electrolytic gel as a conductor between the skin and the electrodes, are also available. The Muse is a dry electrode that is easytouse.
Seven sensors are included in the Muse headband, four ofwhicharepassiveelectrodes.
Frontal electrodes: AF7 and AF8 Temporal electrodes: AF7andAF8Frontal electrodes:AF7andAF8Temporal electrodes: AF7 and AF8 Temporal electrodes: AF7 and AF8 Temporal electrodes: TP9 and TP10 are two differenttypesofTP.
A reference sensor (Fpz) and two bridging grounds are locatedinthecentreoftheforehead.
Intermsofbrainstructure,the10 20placementdivides the brain into some important areas for EEG implantation.
Executive processes including planning, decision making, expression, behaviour, and managing certain parts of speech and language are all pre frontal (Fp) activities.
Movement control, logic, emotions, speaking, and problem solvingareallfrontal(F)functions.
Auditory (A), memory (M), and processing (P) are all temporal(T)concepts.
Parietal(P):attentiveness,sensoryperception
Visual functions are performed by the occipital (O) cortex.
Sensorimotoractivitiesarelocatedinthecentral partof thebrain(C).
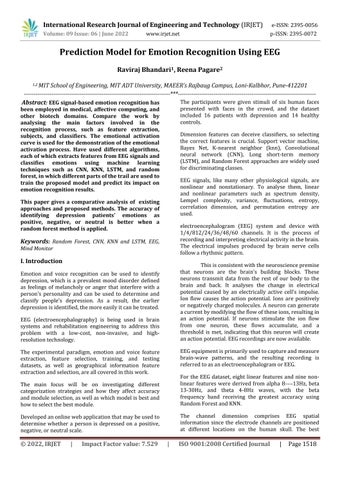
Nowthatwehavethisbrainstructure,wecaninsertthe muse sensors. Figure 4 depicts the 10 20 system, with coloursindicatingwheretheMuse2electrodesshouldbe placed.
Figure 1: 10 20 system placement of the muse2 electrodes
Src: Mind Monitor
The reference electrode in Muse is Fpz, and the electrodes are TP9 (left ear), TP10 (right ear), AF7 (left forehead), and AF8 (right forehead). It monitors the potential differences (voltage) between the active electrodes and Fpz rather than capturing brain inputs. Muse measures voltage fluctuations in the temporal/parietallobe(TP)andfrontallobe(FL)(AF).
As neurons are present in the brain and are wired together, this is how it functions. Neurons frequentlyfireinclusters,andalargerclusterofneurons firing at the same time results in a larger amplitude in our EEG readings. According to a study, huge groups of neurons fire together every now and then, while small groupsfiremorefrequently.Asaresult,lowerfrequency brainwaveshadhigheramplitudeandviceversa.
Let's take a look at what human brain waves are and howtheycanaidindatacollection.
Based on the logarithm of the power spectral density (PSD) of the EEG data for each channel. The EEG PSD values read from the sensors are typically in the 1 +1 range.Thesehavethefollowingfrequencyspectrum:
Delta 1 4Hz
Theta 4 8Hz
Alpha 7.5 13Hz
Beta 13 30Hz
Gamma 30 44
International Research Journal of Engineering and Technology (IRJET) e ISSN:2395 0056
Volume: 09 Issue: 06| June 2022 www.irjet.net p ISSN:2395 0072
3. Collecting thedata
The Mind Monitor app is a popular data collectionapp.Thisisathird partyappthatassistsinthe datacollectionfromMusedevices.
Sprinkle some water on the electrodes on the Muse device for better measurement; this will assist in leaving a trail of sweat on the forehead, which will improvetheconnection.
Also, set the notch filter to the desired notch frequency, which eliminates electrical signals from the power line. You can enable marker buttons just above the notch frequency. These can be used to identify certainareasofourdata.This will aidinthelabelling of specificactivitiesduringtherecordingprocess.
To record, press the record button on Muse, whichwillcreateaCSVfile.Bydefault,dataforabsolute brainwaves,rawEEGsignals, accelerometer,gyroscope, headband on or off, and HSI is captured every second (HorseshoeIndicator).
The recording interval can be modified, and it canbesettoconstant,i.e.,rawEEGsignalsarecaptured at256Hz,andbrainwavedataisacquiredat10Hz.
We can band pass the signal after getting the EEG data to keep the frequencies that carry relevant informationandapplyanotchtoeliminateACinference. Now, distinct frequency bands are analysed independently by band pass filtering each band, namely delta, theta, alpha, beta, and gamma, which have lower frequencies with higher amplitude and vice versa. Following that, we can segment the data using markers to distinguish sentences; these segments are then used asindependenttraining/classificationtrails.
We can employ Short Term Energy (STE) for feature extraction, which is similar to multiple speech processing methodologies. Equation 1 is used to determinetheSTE.
2
Thelengthofthehammingwindowfunctionfor thesamplesis'w,'andtheinputEEGsignalis'x.'
The multi taper (MT) spectrogram can be used for visualisation to validate the method of removing delta band influence from the beta band in EEG signals. The multi taper method multiplies the signal with pairwise orthogonal data taper windows to provide multipleindependentestimatesfromthesamesample.
After that, you can get the final spectrum by averaging all statistically independent tapered spectra. We now need the time domain in order to specify the
taper parameters for the time bandwidth product and the number of tapers, as well as the moving window length with sample shift. The MT spectrogram of the beta delta band signal can be captured with the STE for syllable likespectralfeatures.
Now we know how to collect the data from the EEG (MUse2device)andwhichtoselect.
Herehowthedatasetlookslike:
Table 1: Sample Muse2 EEG dataset. mean_ 0_a mean_ 1_a mean_ 2_a mean_ 3_a mean_ 4_a 4.62E+ 00 3.03E+ 01 ##### ### 1.56E+ 01 2.63E+ 01 2.88E+ 01 3.31E+ 01 3.20E+ 01 2.58E+ 01 2.28E+ 01 8.90E+ 00 2.94E+ 01 ##### ### 1.67E+ 01 2.37E+ 01 1.49E+ 01 3.16E+ 01 ##### ### 1.98E+ 01 2.43E+ 01 2.83E+ 01 3.13E+ 01 4.52E+ 01 2.73E+ 01 2.45E+ 01 3.10E+ 01 3.09E+ 01 2.96E+ 01 2.85E+ 01 2.40E+ 01 1.08E+ 01 2.10E+ 01 4.47E+ 01 4.87E+ 00 2.81E+ 01
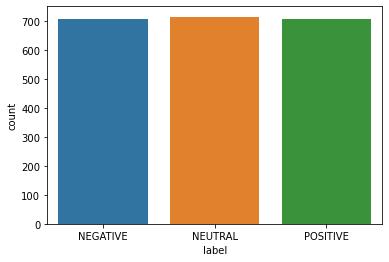
Figure 3: Dataset FFT signal
4. DataPre processing
Data preprocessing is the process of removing the unwanteddatafromthedataset,i.e.
● Removing missing data: The null values are removed.
● Encoding Categorical Data: they are variable withafinitesetoflabelvalues.
● MIN MAXscalar: itscalesallthedatafeaturesin the range [0,1] or in the range [ 1,1] if any negativevaluesinthedataset.Scalartransforms featuresbyscalingeachfeaturetoagivenrange.
● Data Normalisation: Use to scale the data of an attribute so that it falls in a smaller range, such as 1.0to1.0or0.0to1 .0.
● Batch Normalisation: Applied on neural networkswheretrainingisdoneinmini batches on neuron activation such that the mean of outputliescloseto0andthestandarddeviation liescloseto1.
● Layer Normalisation: dependent on batches, then the normalization is applied to the neuron for a single instance to all features. Here, mean activation and standard deviation remain close to0and1.
The adjustments made to our data before applying the method are referred to as pre processing. It's used to turnuncleandataintocleandata.
The data must be in the appropriate format for the machinelearningmodeltogetthebestresults.
Outlier detection, removal, and missing values are the initial steps in the preprocessing pipeline. Here, we employed a distribution based outlier detection approach, in which a combination of distributions is fittedtothedata.Becausethedatainoursoftwarewould be difficult to fit adequately with just one distribution, wemightbeabletoattainamoreaccuratefitbyusinga blend of distributions. As a result, we employ a mixture
model. In this example, we utilised three different distributions.
Whenthedistributionislessthan0.005,adatapointcan be called an outlier. In a dataset with 2000 data points, we use outliers on average approximately ten times, with30outliers.
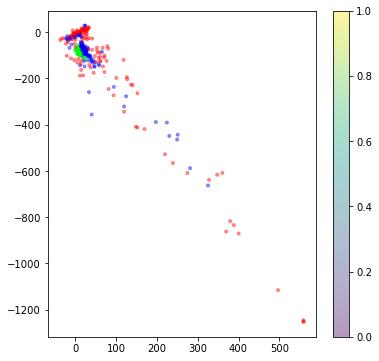
Figure 4: An outlier detection using a mixture model.
5. Data Transformation and DimensionReduction.
Dimension reduction with PCA (Principal Component Analysis) is used for feature engineering and data transformation.PCAisusedtoreducethedimensionsof the data for visualisation, such as plotting a 2D or 3D graph by lowering the dimensions to 2 or 3. Here, we must choose which components should be included in the data. In PCA, the first and last components explain themostandleastvariance, respectively.Nowweselect avariancethatdoesnotdiminishsignificantly.
Fortheengineeringfeatureinthewindows:
1. Addthefrequencywiththelargestamplitudeas an indicator of the most relevant frequency in thewindowfortheengineeringcharacteristic.
2. Multiply each frequency with its amplitude to get the weighted signal average of the frequency.
3. Divide the sum of the results by the sum of the amplitudes.
4. Calculatethespectralentropyofthesystem.We compute the power spectral density, then normalizethevaluestothesumof1,allowingus toseeitasaprobabilitydensityfunction.
5. Calculate the entropy using the entropy calculation.
The next step is to combine all of our datasets into a single large dataset. We shuffle all of our user data at randomanduseitasinputforourmodel.Thiswillassist
International Research Journal of Engineering and Technology (IRJET) e ISSN:2395 0056
us in determining whether or not our situation is non temporal.
Creating, validating, and testing training and test sets. We'lldivideourdataby60 20%intotrainingdata,20% intovalidationdata,and20%intotestdataatrandom.
6. Machine Learning Models/Classification
Using sci kit learn, build six distinct machine learning models. Non deterministic models have a random component, whereas deterministic models always producethesameresults.
Deterministicmodelsare:
● ConvolutionalNeuralNetworks(CNN)
● K nearestNeighbours(KNN)
● LSTM(recurrentneuralnetwork)
Non Deterministicmodelsare:
● NeuralNetwork
● RandomForest(RF)
HerewefoundthattheRandomForestModel,withgrid search,givesthebestaccuracyof97%,followedbyCNN, withanaccuracyof82%,andKNN,with94%.
The reasonforutilising the RNN model isthat it triesto find out what the differences are between our positive and negative instances so that classification can be performed. These networks, known as RNNs, read your input sequentially while maintaining a "memory" of what they've already read. Because of the association between words, these are extremely beneficial when dealingwithtext.
Itnowcombinesthepredictionsofseveraldecisiontrees intoasinglemodel,asitdoeswithRandomForest.Also, by integrating several trees into one ensemble model, RM helps reduce the large variance of a flexible model likeadecisiontree.
The Neural Network will require far more data than a single person can provide. For the sake of performance, theneuralnetworkwilljustshredtheinterpretabilityof ourfeaturestothepointthattheybecomeworthlessfor specificmodelsortasks.
The outcome of a KNN algorithm is entirely dependent on the nearest neighbours, which may differ depending onourselection.Itisalsoaffectedbydistancemetrics.
CNN, on the other hand, takes the characteristics from theinputdataandextractsthem.whicharereallyuseful forconductingresearch.
III. Result
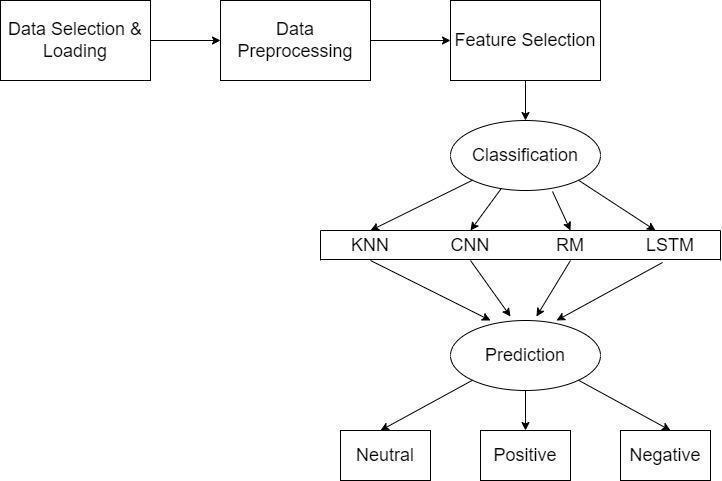
Fig. 4: System FLow diagram
Table 2: Classification Techniques with an Accuracy Difference
Models > KNN CNN RM RNN (LSTM)
Accuracy 94% 86% 97% 95%
MAE 0.07 0.58 0.05 0.4
MSE 0.41 0.75 0.11 0.30
RMSE 0.56 0.86 0.33 0.66
Volume: 09 Issue: 06| June 2022 www.irjet.net p ISSN:2395 0072 © 2022, IRJET | Impact Factor value: 7.529 | ISO 9001:2008 Certified Journal | Page1522
Random Forest has the highest accuracy of 97 percent, followed by CNN and KNN, which have 84 percent and 94percentofaccuracy,respectively.
International Research Journal of Engineering and Technology (IRJET) e ISSN:2395 0056
Volume: 09 Issue: 06| June 2022 www.irjet.net p ISSN:2395 0072
References
[1] Beomjun Min, Jongin Kim, Hyeong jun Park, and Boreom Lee “Vowel imagery decoding towards silent speech BCI using extreme learning machine with an electroencephalogram,” BioMes research international, vol.2016,2016.
[2] KatharineBrighamandBVKVijayaKumar“Imagined speech classification with EEG signals for silent communication: preliminaryinvestigation intosynthetic telepathy,”in Bioinformatics and Biomedical Engineering (iCBBE), 2010 4th International Conference 0n. IEEE, 2010,pp.1 4.
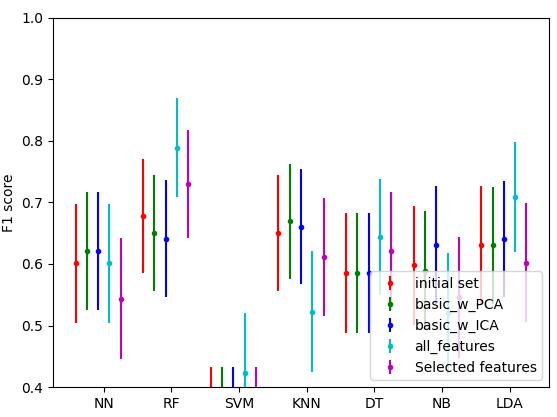
Fig. 6: Evaluation of a three label classification.
Found that the random forest model, with grid search, givesthebestperformance:anF1scoreofaround0.85.
IV. Conclusion
The system analyses the user's mindset using EEG signals and makes a prediction based on that. Because these solutions are more affordable, government hospitalsandmedicalexpertsmayprefertousethemfor diagnosis.
This research looks at a variety of categorization model strategiesthatcanhelpyougetthebestresults.Random Forest has the highest accuracy of 97 percent, followed byCNNandKNN,whichhave84percentand94percent accuracy,respectively.
Acknowledgment


I’m extremely grateful to Dr. Reena Pagare, Assistant Professor, MIT ADT University, Pune, India, who has been an invaluable source of help and direction during thisproject.
Author Biography
Raviraj Bhandari,
Pursuing Integrated Mtech degree from MIT Adt University, in Computer science engineering and specialisation in Intelligencesystemandanalysis.
Dr.Reena Pagare, Associate Professor MIT Art, Design and Technology University, University Lead Manager, Executive Body Member MIT ADTU Alumni Association, Chair IEEE Pune Section Engineering in Medicine and BiologySociety.
[3] XueminChia,JohnBHagedorna,DanielSchoonovera, and Micheal D’Zmuraa, “EEG based discrimination of imagined speech phonemes,” International Journal of Bioelectromagnetism, vol.13,no.4,pp.201 206,2011.
[4] Sarah N Abdulkader, Ayman Atia, and Mostafa Sami M Mostafa, “Brain computer interfacing: Applications and challenges,” Egyptian Informatic Journal, vol. 16, no. 2,pp.213 230,2015.
[5] BernardJBaarsandNicoleMGage, Cognition, brain, and consciousness: Introduction to cognitive neuroscience Chapter 7, 11, AcademicPress,2010.
[6] Tan Tian Swee, Sheikh Hussain Shaikh Salleh, and Mohd Redzuan Jamaludin, “Speech pitch detection using short time energy parameterstoclassifysyllablesinthe spanish language,”in Iberoamerican Congress on Pattern recognition. Springer,2005,pp.161 170.
[7] David J Thomson, “Spectrum estimation and harmonicanalysis,” Proceeding of the IEEE, vol.70,no.9, pp.1055 1096,1982.
[8] Lija V Bondarko, “The syllable structure of speech anddistinctivefeaturesofphonemes,” Phonetica, vol.20, no.1,pp.1 40,1969.
[9] Jacques Mehler, “The role of syllables in speech processing: Infant and adult data,” Phil. Trans. R. Soc. Lond. B, vol.295,no.1077,pp.333 352,1981.
[10] Waleed H Abdulla, David Chow, and Gray Sin, “Cross words reference template for dtw based speech recognition systems,” in TENCON 2003. Conference on Convergent Technologies for the Asia Pacific Region. IEEE, 2003,vol.4,pp.1576 1579.
[11] Hiroaki Sakoe, “ Two level dp matching a dynamic programming based pattern matching algorithm for connected word recognition,” IEEE transactions on Acoustics, Speech, and Signal Processing, vol.27,no.6,pp. 588 595.
International Research Journal of Engineering and Technology (IRJET) e ISSN:2395 0056
Volume: 09 Issue: 06| June 2022 www.irjet.net p ISSN:2395 0072
[12]KatharineBrighamandBVKVijayaKumar,“Subject identification from electroencephalogram (EEG) signals during imagined speech,” in Biometrics: Theory Application and systems (BTAS), 2010 Fourth IEEE International Conference on. IEEE,2010,pp.1 8.
[13] Martin Spuler, “A high speed brain computer interface(BCI)usingdryEEGelectrodes,” Plos one, vol.1, no.2,pp.20172400,2017.
[14] Sergio Machado, Fernanda Araujo, Flavia Paes, Bruna Velasquez, Mario Cunha, Henning Budde, Luis F Basile, Renato Anghinah, Oscar Arias Carrion, Mauricio Cagy, et al., “EEG based brain computer interfaces: an overview of basic concepts and clinical applications in neurorehabilitation,” Review in the Neurosciences, vol.21, no.6,pp.451 468,2010.
[15]KangWang,XueqianWang,andGangLi,“Simulation experiment of BCI based imagined speech EEG decoding,” arXivpreprint arXiv:1705.07771, 2017.
[16] Mel frequency cepstrum. http:/en.wikipedia.org/wiki/Mel frequency_cepstrum
[17]DouglasO’ShaughnessyRivarolVergin,“Generalised Mel Frequency Cepstral coefficients for Large Vocabulary Speaker Independent Continuous Speech Recognition,” IEEE transaction on speech and Audio Processing, vol.28,no.5,pp.525 532
[18] Abhay Kumar, “Voice Based Control Command Signal Generation for Intelligent System,” In Electrical Computer and Electronics (UPCON), 2015 IEEE UP section conference, Allahabad, 2015,pp.1 6.
[19] MFCC (Mel Frequency Cepstral Coefficients) for audioformat website;iq.opengenus.org
[20] MarcoA.Wiering,LambertR.B.Schomaker,“Multi Layer Support Vector Machines” In book: Regularisation, optimization, Kernels, and Support Vector Machines. Edition: CRC Machine Learning and Pattern Recognition Series, Boca Raton, USA, Oct 2014. Chapter.20
[21] Support Vector machine (SVMs) versus Multilayer Perception (MLP) in data classification, in Mathematics Dept., Computer Science Section, Faculty of Science, Sohag University, SOhag, Egypt., Egyptian Informatics Journal, Volume13,Issue3,November2012,pages177 183.
[22] You xi Wu, Lei Guo, Yan Li, Xue qin Shen, Wei li Yan, “Multi Layer Support Vector Machine and its Application,” In 2016 International Conference on Machine Learning and Cybernetics. Print ISBN: 1 4244 0061 9;INSPECAccessionno.9155546,Dalian,China.